

When evaluating the chart as a whole, Ethereum appears to be entering a phase where its trading range is becoming increasingly compressed.
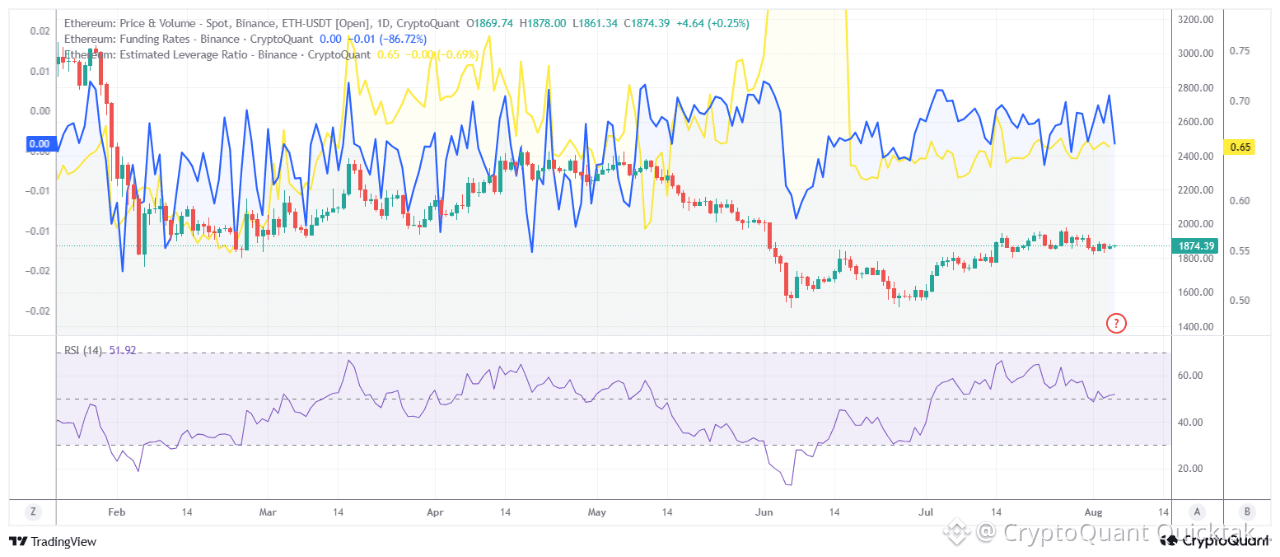
The current Funding Rate is close to 0.00, indicating no clear dominance between long and short positions. This suggests that recent price action has been driven primarily by spot market buying and selling rather than excessive positioning in the futures market.
Meanwhile, the Estimated Leverage Ratio remains elevated at 0.6, showing that a significant amount of leveraged open interest is still in the market. As a result, even relatively small price movements could trigger liquidation cascades and increase volatility.
Following June's sharp decline, ETH has recovered from around $1,550 to approximately $1,875. However, recent candlesticks have become smaller and trading volume has continued to decline, reflecting weakening momentum and a period of sideways consolidation.
The RSI is currently around 52, placing it in neutral territory. It is neither overbought nor oversold, meaning technical indicators do not currently favor a mandatory move in either direction.
Overall, there are no strong signs of selling pressure, but a sustained upward move will likely require stronger spot demand. While the neutral Funding Rate points to a healthier derivatives market structure, the still-high Estimated Leverage Ratio leaves Ethereum vulnerable to sudden, high volatility squeeze events. At this stage, the next major price move is likely to depend on spot buying strength and on-chain capital inflows rather than futures positioning.
Written by PelinayPA