
$BNB just gave traders a wild ride today.
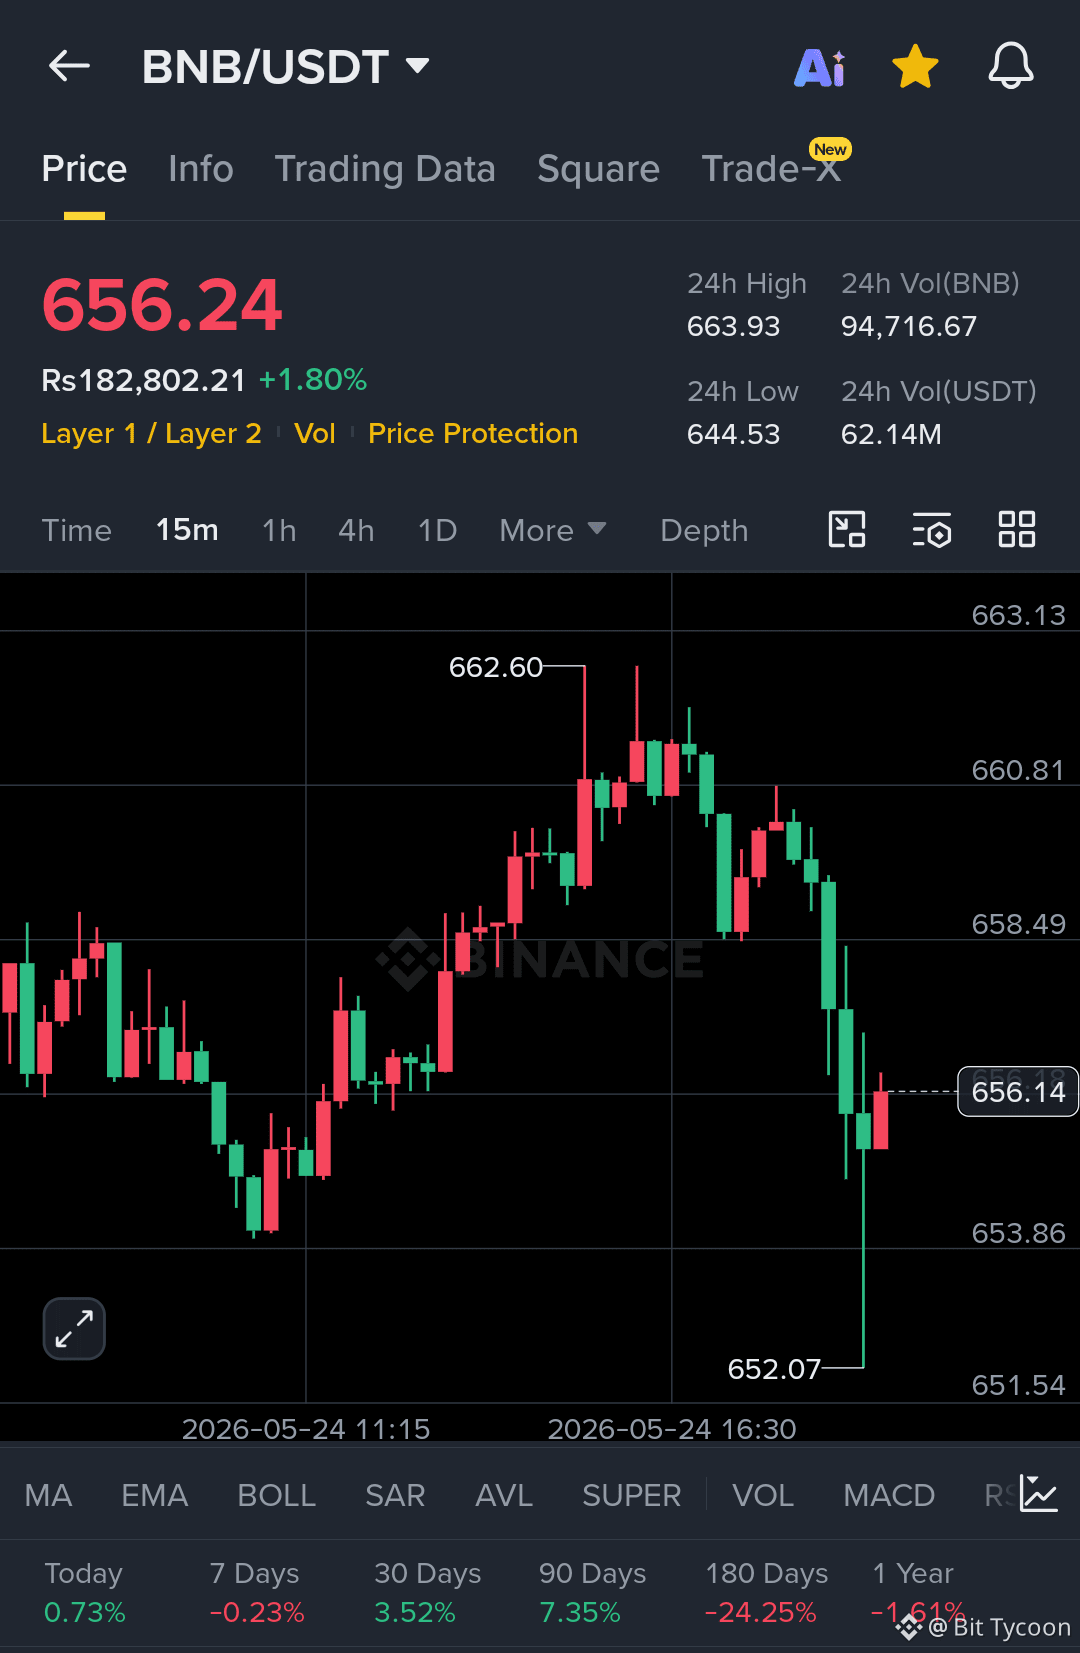
After pushing all the way up to $663.93, the market suddenly flipped and dropped hard toward the $652 zone before buyers stepped back in. Right now, BNB is trading around $656.24, still holding a solid 1.80% gain on the day, but the chart is showing pure volatility.
The 15-minute chart tells the whole story.
Bulls were fully in control during the climb toward $662, but the rejection near the top triggered fast selling pressure. Within a short time, BNB dropped more than $10, shaking out weak hands and liquidating impatient traders along the way.
What makes this move interesting is the recovery reaction after touching $652.07. Buyers instantly defended that level and pushed price back above $656, showing that demand is still alive despite the sharp sell-off.
Current market stats: • Price: $656.24
• 24H High: $663.93
• 24H Low: $644.53
• 24H Volume: 62.14M USDT
• Short-term trend: Highly volatile with aggressive swings
The next important area traders are watching is around $660 to $664. If BNB breaks back above that resistance zone, momentum could return quickly. But if sellers stay active, another retest of the $652 support area would not surprise the market.
One thing is clear — BNB traders are getting action from both sides today, and the market is moving fast with emotions running high.
#TrumpSaysIranDealLargelyNegotiated #RussiaExpandsMinerInfoRequirements #StablRDepegsAfterAttack #BitcoinBreaksBelow75KAsWarshTakesFedHelm #FenwickWestSettlesFTXFor54M
After pushing all the way up to $663.93, the market suddenly flipped and dropped hard toward the $652 zone before buyers stepped back in. Right now, BNB is trading around $656.24, still holding a solid 1.80% gain on the day, but the chart is showing pure volatility.
The 15-minute chart tells the whole story.
Bulls were fully in control during the climb toward $662, but the rejection near the top triggered fast selling pressure. Within a short time, BNB dropped more than $10, shaking out weak hands and liquidating impatient traders along the way.
What makes this move interesting is the recovery reaction after touching $652.07. Buyers instantly defended that level and pushed price back above $656, showing that demand is still alive despite the sharp sell-off.
Current market stats: • Price: $656.24
• 24H High: $663.93
• 24H Low: $644.53
• 24H Volume: 62.14M USDT
• Short-term trend: Highly volatile with aggressive swings
The next important area traders are watching is around $660 to $664. If BNB breaks back above that resistance zone, momentum could return quickly. But if sellers stay active, another retest of the $652 support area would not surprise the market.
One thing is clear — BNB traders are getting action from both sides today, and the market is moving fast with emotions running high.
#TrumpSaysIranDealLargelyNegotiated #RussiaExpandsMinerInfoRequirements #StablRDepegsAfterAttack #BitcoinBreaksBelow75KAsWarshTakesFedHelm #FenwickWestSettlesFTXFor54M