
Date: 19-10-2024
Technical Analysis:
Read charts like never before with Flow Chart Diagram .Stay tuned and watch the levels closely for any signs of a breakout or breakdown!


Understanding chart patterns is one of the most powerful tools in a trader’s arsenal. These patterns aren’t just lines—they reflect psychology, supply-demand dynamics, and the behaviour of both retail and institutional players. Recognizing these patterns early can help you predict reversals or breakouts before they happen.
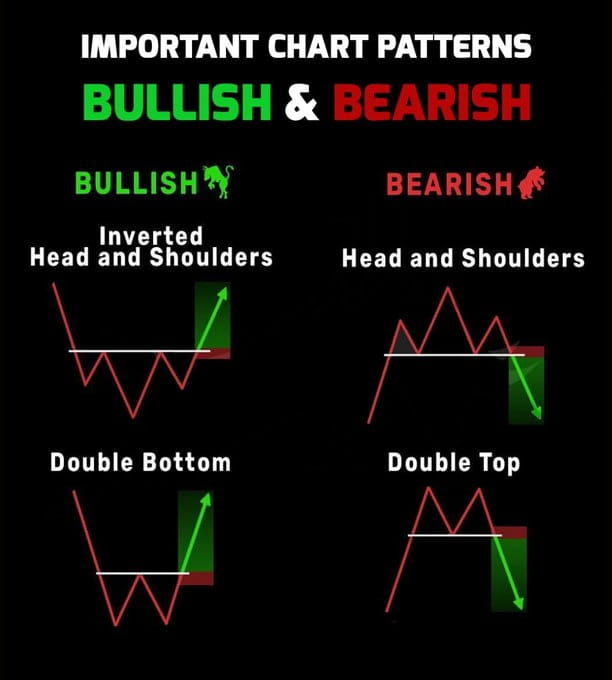
The chart showcases four essential patterns, divided into bullish and bearish signals. Let’s dive deep into each pattern to decode what it means, how to trade it effectively, and how these patterns fit into bull or bear cycles. Plus, we’ll highlight how to avoid fakeouts and maximize profits using them.
🟢 Bullish Chart Patterns (Buy Signals)
Bullish patterns indicate upward movement—great signals to enter long positions during accumulation phases or corrections. These patterns often appear after downtrends, signalling a trend reversal or a continuation of an existing uptrend.
1️⃣ Inverted Head and Shoulders 🐂
Structure: This pattern has three troughs: the middle (head) is the lowest, while the two side troughs (shoulders) are relatively higher.
Psychology: Sellers push the price lower to form the head, but buyers step in aggressively, forming the second shoulder and signalling a reversal.
Breakout Point: Once the neckline (horizontal resistance) is broken, a sharp upward rally usually follows.
💡 Pro Tip:
Measure the distance between the head and the neckline—this gives a target for the upward move.
Volume: Look for rising volume at the breakout—this confirms buyer strength.
2️⃣ Double Bottom 🚀
Structure: Price forms two identical lows before breaking higher.
Psychology: The market tests a support level twice but fails to break lower, indicating buyer strength.
Breakout Point: When price closes above the neckline (previous resistance between the two bottoms), expect a strong upward move.
💡 Pro Tip:
Use RSI (Relative Strength Index) to confirm. If RSI shows bullish divergence (higher low on RSI while price makes a lower low), the reversal is highly probable.
Target: Measure the distance between the bottom and neckline to predict the next move.
🔴 Bearish Chart Patterns (Sell Signals)
Bearish patterns appear during uptrends or consolidation phases and warn of a potential reversal downward. These patterns are crucial to avoid buying near tops and help traders short the market effectively.
3️⃣ Head and Shoulders 🐻
Structure: Price makes three peaks—the middle one (head) being the highest, with two smaller shoulders on either side.
Psychology: Buyers attempt to push higher (forming the head), but fail to sustain momentum. Sellers take control after the second shoulder, triggering a reversal.
Breakout Point: When price falls below the neckline, expect a steep decline.
💡 Pro Tip:
Use Fibonacci retracement: Check if the neckline aligns with a key Fib level (like 61.8%)—this gives extra confirmation of a breakdown.
Watch for volume spikes on the way down.
4️⃣ Double Top 🛑
Structure: Price forms two identical peaks, failing to break higher the second time.
Psychology: Buyers attempt to push higher but get rejected twice at the same resistance level, signalling buyer exhaustion.
Breakout Point: Once price breaks below the neckline (previous support), it triggers a strong downward move.
💡 Pro Tip:
Use moving averages (MA) to confirm the pattern. If the price breaks the 50 or 200-day MA during a double top, it strengthens the bearish signal.
🔄 How These Patterns Impact Bull & Bear Market Cycles
🐂 Bull Market Scenarios
Bullish patterns appear frequently during bull markets, especially after pullbacks.
Breakouts from inverted head-and-shoulders or double bottoms are great opportunities to add to long positions during corrections.
During bull runs, bearish patterns (like double tops) are often fakeouts, triggering only minor pullbacks before the trend continues higher.
Pro Tip:
In a bull market, buy the dip on bullish patterns. But if bearish patterns appear multiple times across large caps, rotate your capital into safer assets or prepare for a correction.
🐻 Bear Market Scenarios
In bear markets, bearish patterns play out aggressively. Head-and-shoulders and double tops often lead to sudden drops, liquidating leveraged positions.
Bullish patterns in bear markets are often short-lived rallies (dead cat bounces)—so take profits early.
🎯 How to Trade These Patterns with Confidence
1️⃣ Wait for Confirmation:
Don’t jump in early—wait for a close beyond the neckline to confirm the breakout or breakdown.
2️⃣ Use Stop-Losses:
Place stop-losses just below the neckline (for bullish patterns) or above it (for bearish patterns) to protect against fakeouts.
3️⃣ Watch for Volume:
Rising volume during a breakout confirms the move. Low volume? Beware—a fakeout might be lurking.
💡 Conclusion: Turn Chart Patterns into Your Edge
These bullish and bearish chart patterns aren’t just theories—they reflect real market behavior. Whether you’re trading crypto, stocks, or forex, recognizing and reacting to these patterns will give you a significant edge. Master them, stay disciplined, and remember:
In bull markets: Use inverted head and shoulders and double bottoms to ride the trend.
In bear markets: Head and shoulders and double tops will help you catch trend reversals early.
Understanding these patterns means the difference between catching the next breakout and getting stuck in a fakeout.
Disclaimer: The content of this article is for informational purposes only and does not constitute financial advice. Cryptocurrency investments are highly volatile and may lead to substantial financial loss. Always perform your own research and consult a qualified financial advisor before making any investment decisions. The opinions expressed are solely those of the author and do not represent the views of the publisher or its affiliates. Investing in cryptocurrencies involves inherent risks, and past performance is not a reliable indicator of future results. Please exercise caution.