
Date: 04-10-2024
Technical Analysis:
Read charts like never before with Flow Chart Diagram .Stay tuned and watch the levels closely for any signs of a breakout or breakdown!

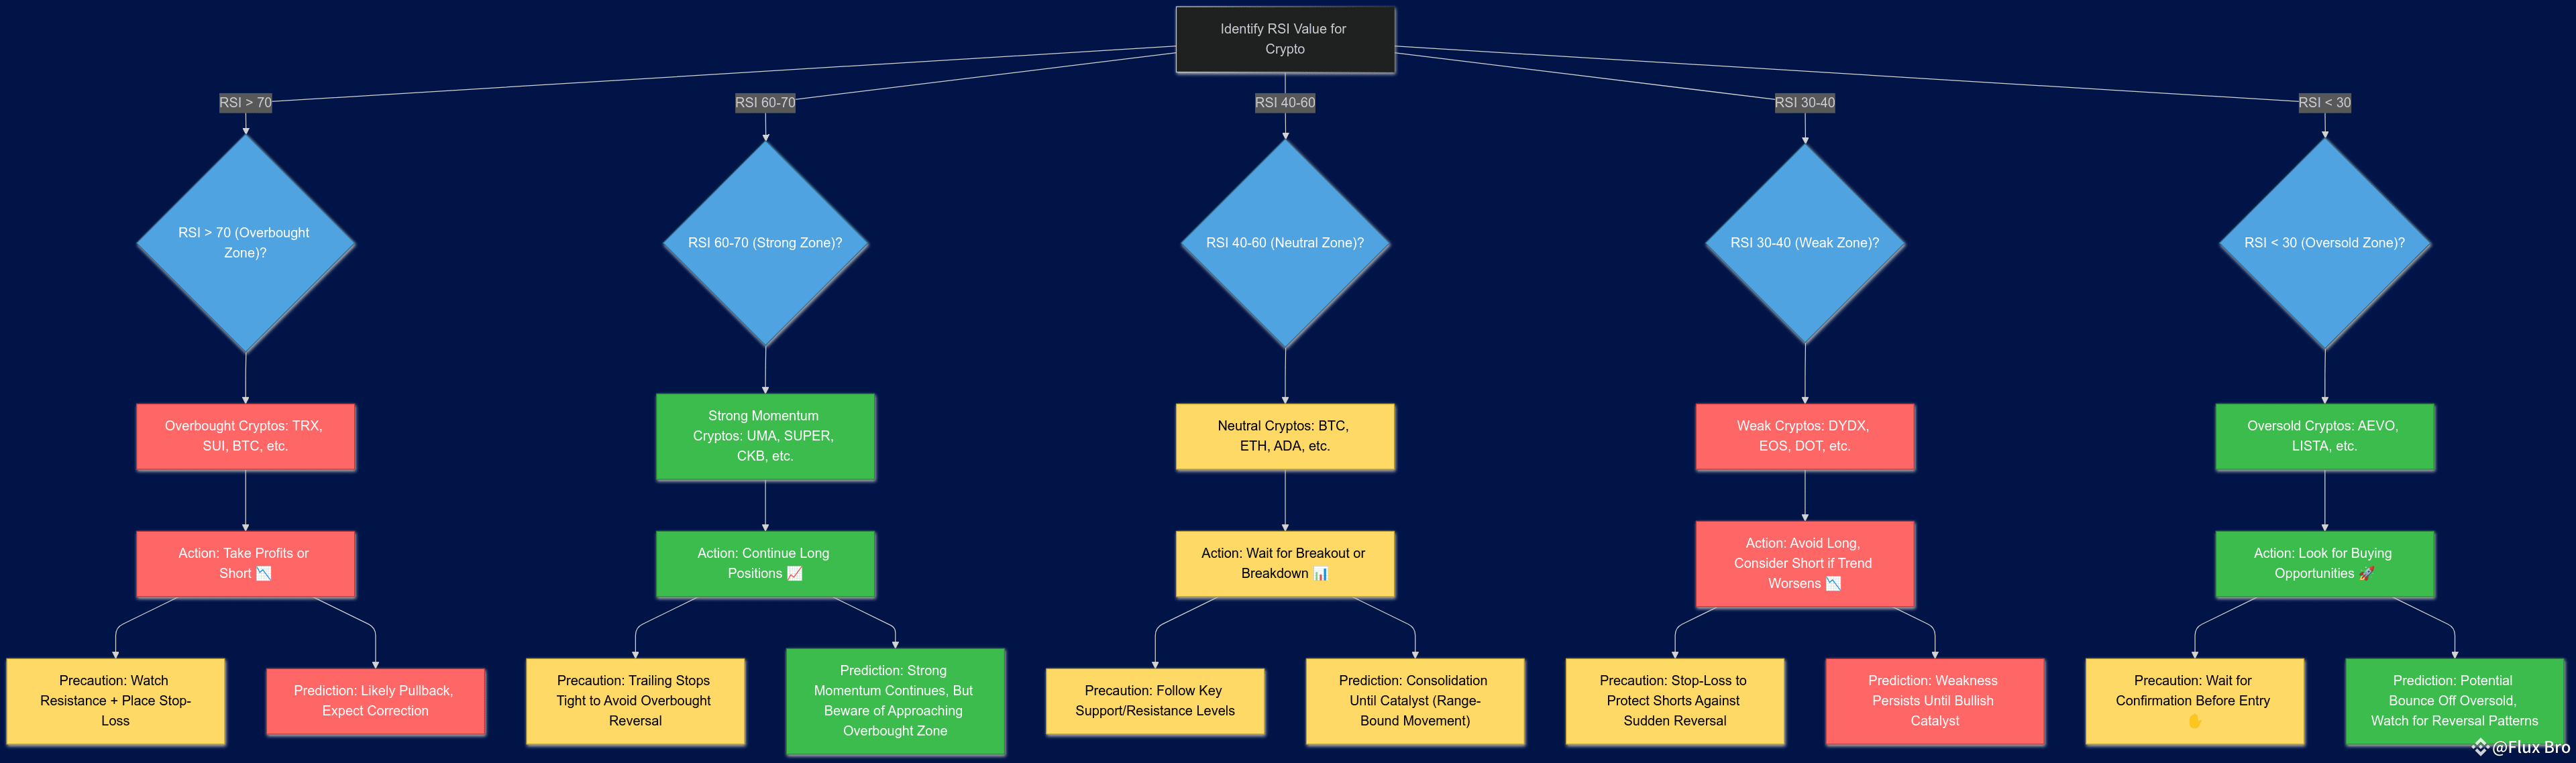
This RSI (Relative Strength Index) heatmap provides an at-a-glance view of multiple cryptocurrencies based on their RSI values over the past week. The chart uses a color-coded system and segregates the cryptos into four primary zones based on their RSI levels: Oversold, Weak, Neutral, Strong, and Overbought. Each category offers insights into the current momentum and possible future movements of these assets.
Key Takeaways from the Chart:
Overbought Zone (RSI > 70): Red zone indicates cryptos that are potentially overextended and may be due for a correction.
Strong Zone (RSI ~60-70): Cryptos in this zone are seeing strong upward momentum.
Neutral Zone (RSI ~40-60): Most cryptos reside here, reflecting a balance between buyers and sellers.
Weak Zone (RSI ~30-40): Assets in this zone are losing momentum, but not fully oversold.
Oversold Zone (RSI < 30): These cryptos are experiencing heavy selling pressure, and may be nearing a potential reversal.
🔴 1. Overbought Cryptos: RSI > 70
SUI, TRX, BTCDOM, OM are some of the notable names in the overbought zone, with BTCDOM (Bitcoin Dominance) standing out.
Conclusion:
TRX and SUI are among those indicating overbought conditions, implying potential exhaustion of their recent upward price movements.
Predictions:
These cryptos may see short-term pullbacks as the RSI over 70 often signals that the market has been overbought and is ripe for a correction. Expect sellers to start taking profits soon.
Precautions:
If you hold long positions in these assets, consider tightening your stop-loss orders or taking partial profits.
Traders could potentially short these assets once the price starts showing signs of weakness (e.g., bearish candlestick patterns or decreased volume).
🟠 2. Strong Cryptos: RSI 60-70
UMA, SUPER, CKB, CELO are in the strong zone. These cryptos are still performing well, but nearing overbought levels.
Conclusion:
These assets are showing strong momentum and may still have room to run upward. Traders can ride the trend but should be cautious as they're approaching overbought territory.
Predictions:
Momentum may continue upward in the short term, but a correction could soon follow if these cryptos push into the overbought zone (above 70 RSI).
Precautions:
Consider placing trailing stop-loss orders to lock in profits as they rise.
Watch for signs of bearish divergence between price and RSI, which would signal that the current uptrend may be weakening.
🟡 3. Neutral Cryptos: RSI 40-60
Most of the market falls into the neutral zone, including big names like BTC, ETH, ADA, AVAX, INJ, and many more.
Conclusion:
Neutral RSI reflects a balance between buying and selling pressure. These assets are neither overbought nor oversold, suggesting a consolidation phase.
Predictions:
Assets in this range could break out in either direction, making it a critical zone to monitor for future movement.
BTC and ETH, being in the neutral zone, indicate that the market is waiting for a catalyst (news or technical signals) to either push higher or break lower.
Precautions:
Keep an eye on key support and resistance levels for these cryptos. If they break through resistance with strong volume, it could lead to a bullish run. Conversely, a break below support could signal a bearish trend.
Use RSI divergence as a leading indicator to anticipate potential reversals. If RSI drops while prices are holding steady, it could be a sign of weakening momentum.
🟢 4. Weak Cryptos: RSI 30-40
DYDX, EOS, DOT, LDO, ARB, MKR are among the cryptos in the weak zone. These assets are starting to lose momentum but haven’t fully entered oversold conditions.
Conclusion:
These cryptos are showing signs of weakness, but they are not in free fall yet. Traders should be cautious, as these could be potential setups for shorting if the weakness persists.
Predictions:
Without a strong bullish catalyst, these assets could continue drifting lower. If they drop into the oversold territory, there may be a buying opportunity at that point.
Precautions:
Avoid long positions until these cryptos show signs of strength, such as increased volume or bullish RSI divergence.
Consider short positions, but place stop-losses near recent highs to protect against sudden reversals.
🔵 5. Oversold Cryptos: RSI < 30
PORTAL, AEVO, LISTA are some notable names in the oversold zone.
Conclusion:
Cryptos in this zone are experiencing heavy selling pressure. Typically, when RSI falls below 30, it suggests that the market is oversold and could be due for a bounce.
Predictions:
These assets may present buying opportunities soon, especially if they show signs of bullish divergence or key support holds.
Precautions:
Don’t rush into long positions right away. Wait for confirmation in the form of increased buying volume or bullish candlestick patterns like a hammer or morning star. If you're already short, consider taking profits before a potential bounce.
📈 RSI Divergence and Overall Market Sentiment
The average RSI for the market is 43.67, which means the overall market sentiment leans towards neutral-weak. This reflects a cooling off period from recent rallies or a consolidation phase before the next significant move.
Market Prediction:
With a majority of assets sitting in the neutral-to-weak zone, we could be in for a period of sideways movement or mild corrections. However, any major catalyst (e.g., macroeconomic news, regulatory developments) could quickly shift sentiment either way.
Precautions:
In neutral markets, it’s often best to sit on the side-lines until clearer trends emerge. Watch for breakouts or breakdowns from current ranges before entering new positions.
General Trading Strategies Based on RSI Zones 📊
Overbought Zone:
Best for taking profits or initiating short positions if further confirmations of a reversal exist.
Wait for corrections before re-entering long positions.
Strong Zone:
Ride the momentum with tight stop-losses.
Add to long positions on dips, but be wary of approaching overbought conditions.
Neutral Zone:
Consider range-bound strategies, buying near support and selling near resistance.
Wait for volume or trend confirmations before aggressive entries.
Weak Zone:
Avoid long entries until there are signs of recovery.
Consider short opportunities if weakness persists, but be ready for quick reversals.
Oversold Zone:
Look for bargain-buying opportunities after confirming a bottom.
Be cautious about buying too early; wait for bullish RSI divergence or candlestick patterns to confirm a reversal.
Final Thoughts 🌟
The RSI heatmap provides invaluable insights into the current state of the crypto market. By understanding the implications of different RSI levels, you can optimize your trading strategies to enter and exit positions at the most opportune times.
Overbought assets signal potential profit-taking opportunities or shorts.
Oversold assets suggest impending reversals, which could be prime buying zones if properly confirmed.
The market overall leans towards neutral-weak, indicating a period of consolidation.
Traders should keep a close eye on volume and other technical indicators like MACD or Bollinger Bands to confirm their RSI-based strategies. Staying disciplined and patient in neutral markets is key to maximizing profits while minimizing risks.
Disclaimer: The content of this article is for informational purposes only and does not constitute financial advice. Cryptocurrency investments are highly volatile and may lead to substantial financial loss. Always perform your own research and consult a qualified financial advisor before making any investment decisions. The opinions expressed are solely those of the author and do not represent the views of the publisher or its affiliates. Investing in cryptocurrencies involves inherent risks, and past performance is not a reliable indicator of future results. Please exercise caution.


