

Mr_Ethan
33.1k منشورات

Mr_Ethan
إبلاغ
حظر المُستخدم
Crypto Lover || Crypto influencer || BNB || Content Creator || Crypto influencer
فتح تداول
مُتداول مُتكرر
1 سنوات
1 تتابع
33.0K+ المتابعون
20.0K+ إعجاب
منشورات
الحافظة الاستثمارية
الكل
اقتباسات
Live
·
--
صاعد
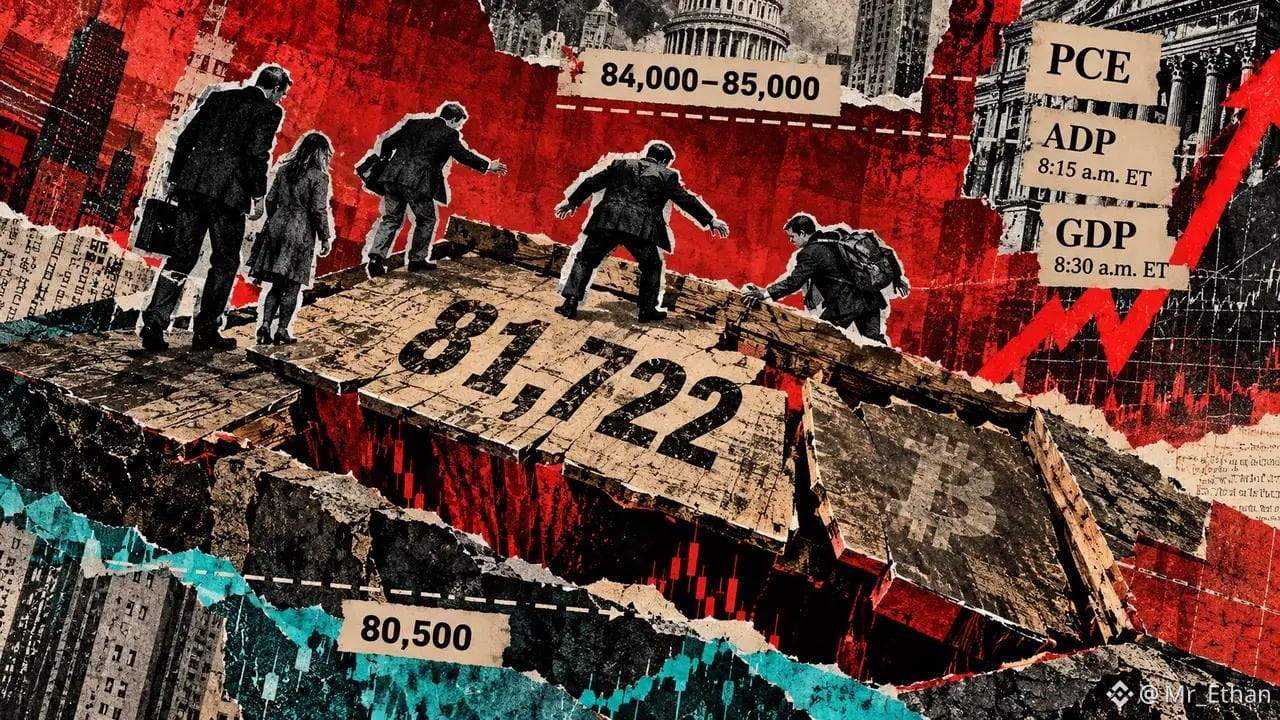
إن مستوى التعادل التقديري للبيتكوين بالنسبة لحامل متوسط لصندوق ETF يبلغ حوالي 81,722 دولارًا، وفقًا لما ذكره جيمس سييفارت من بلومبرج.
ويحظى هذا المستوى باهتمام متزايد مع مواجهة BTC لاختبار محتمل من بيانات اليوم حول التضخم والوظائف. أغلقت عملة بيتكوين يوم 29 سبتمبر قرب 83,579 دولارًا، ما يعني أن هبوطًا بنحو 2.2% من شأنه أن يعيد السعر إلى منطقة التعادل التقديرية لحامل صندوق ETF.
أعتقد أن هذا مستوى مهم لمراقبته لأن تدفقات صناديق ETF أصبحت جزءًا كبيرًا من البنية السوقية للبيتكوين. عندما تكون مجموعة كبيرة من المستثمرين قريبة من متوسط تكلفةها، قد يصبح تحرك السعر حول تلك المنطقة أكثر حساسية.
إذا حافظت BTC على مستوى أعلى من 81,722 دولارًا رغم بيانات اقتصادية جديدة، فقد يشير ذلك إلى أن المشترين ما زالوا مستعدين للدفاع عن مستويات أقل. أما من ناحية أخرى، فإن حدوث اختراق واضح إلى ما دون هذا المستوى قد يزيد ضغط البيع، خصوصًا إذا دفعت الأرقام الاقتصادية المستثمرين إلى تبنّي نظرة أكثر حذرًا للمخاطر.
في الوقت الحالي، لا أنظر إلى مستوى 81.7 ألف دولار باعتباره منطقة دعم مضمونة. بل هو ببساطة نطاق سعر يستحق المتابعة عن كثب.
قد يعتمد التحرك القادم إلى حد كبير على كيفية تفاعل الأسواق مع بيانات التضخم والوظائف اليوم. ومع بقاء حالة عدم اليقين بشأن الاقتصاد الكلي مرتفعة، قد تشهد بيتكوين بعض التحركات الحادة قبل أن تتضح الاتجاهات بشكل أكبر.
$BTC
{future}(BTCUSDT)
إن مستوى التعادل التقديري للبيتكوين بالنسبة لحامل متوسط لصندوق ETF يبلغ حوالي 81,722 دولارًا، وفقًا لما ذكره جيمس سييفارت من بلومبرج.
ويحظى هذا المستوى باهتمام متزايد مع مواجهة BTC لاختبار محتمل من بيانات اليوم حول التضخم والوظائف. أغلقت عملة بيتكوين يوم 29 سبتمبر قرب 83,579 دولارًا، ما يعني أن هبوطًا بنحو 2.2% من شأنه أن يعيد السعر إلى منطقة التعادل التقديرية لحامل صندوق ETF.
أعتقد أن هذا مستوى مهم لمراقبته لأن تدفقات صناديق ETF أصبحت جزءًا كبيرًا من البنية السوقية للبيتكوين. عندما تكون مجموعة كبيرة من المستثمرين قريبة من متوسط تكلفةها، قد يصبح تحرك السعر حول تلك المنطقة أكثر حساسية.
إذا حافظت BTC على مستوى أعلى من 81,722 دولارًا رغم بيانات اقتصادية جديدة، فقد يشير ذلك إلى أن المشترين ما زالوا مستعدين للدفاع عن مستويات أقل. أما من ناحية أخرى، فإن حدوث اختراق واضح إلى ما دون هذا المستوى قد يزيد ضغط البيع، خصوصًا إذا دفعت الأرقام الاقتصادية المستثمرين إلى تبنّي نظرة أكثر حذرًا للمخاطر.
في الوقت الحالي، لا أنظر إلى مستوى 81.7 ألف دولار باعتباره منطقة دعم مضمونة. بل هو ببساطة نطاق سعر يستحق المتابعة عن كثب.
قد يعتمد التحرك القادم إلى حد كبير على كيفية تفاعل الأسواق مع بيانات التضخم والوظائف اليوم. ومع بقاء حالة عدم اليقين بشأن الاقتصاد الكلي مرتفعة، قد تشهد بيتكوين بعض التحركات الحادة قبل أن تتضح الاتجاهات بشكل أكبر.
$BTC
ويحظى هذا المستوى باهتمام متزايد مع مواجهة BTC لاختبار محتمل من بيانات اليوم حول التضخم والوظائف. أغلقت عملة بيتكوين يوم 29 سبتمبر قرب 83,579 دولارًا، ما يعني أن هبوطًا بنحو 2.2% من شأنه أن يعيد السعر إلى منطقة التعادل التقديرية لحامل صندوق ETF.
أعتقد أن هذا مستوى مهم لمراقبته لأن تدفقات صناديق ETF أصبحت جزءًا كبيرًا من البنية السوقية للبيتكوين. عندما تكون مجموعة كبيرة من المستثمرين قريبة من متوسط تكلفةها، قد يصبح تحرك السعر حول تلك المنطقة أكثر حساسية.
إذا حافظت BTC على مستوى أعلى من 81,722 دولارًا رغم بيانات اقتصادية جديدة، فقد يشير ذلك إلى أن المشترين ما زالوا مستعدين للدفاع عن مستويات أقل. أما من ناحية أخرى، فإن حدوث اختراق واضح إلى ما دون هذا المستوى قد يزيد ضغط البيع، خصوصًا إذا دفعت الأرقام الاقتصادية المستثمرين إلى تبنّي نظرة أكثر حذرًا للمخاطر.
في الوقت الحالي، لا أنظر إلى مستوى 81.7 ألف دولار باعتباره منطقة دعم مضمونة. بل هو ببساطة نطاق سعر يستحق المتابعة عن كثب.
قد يعتمد التحرك القادم إلى حد كبير على كيفية تفاعل الأسواق مع بيانات التضخم والوظائف اليوم. ومع بقاء حالة عدم اليقين بشأن الاقتصاد الكلي مرتفعة، قد تشهد بيتكوين بعض التحركات الحادة قبل أن تتضح الاتجاهات بشكل أكبر.
$BTC
92
·
--
$SEI
{future}(SEIUSDT)
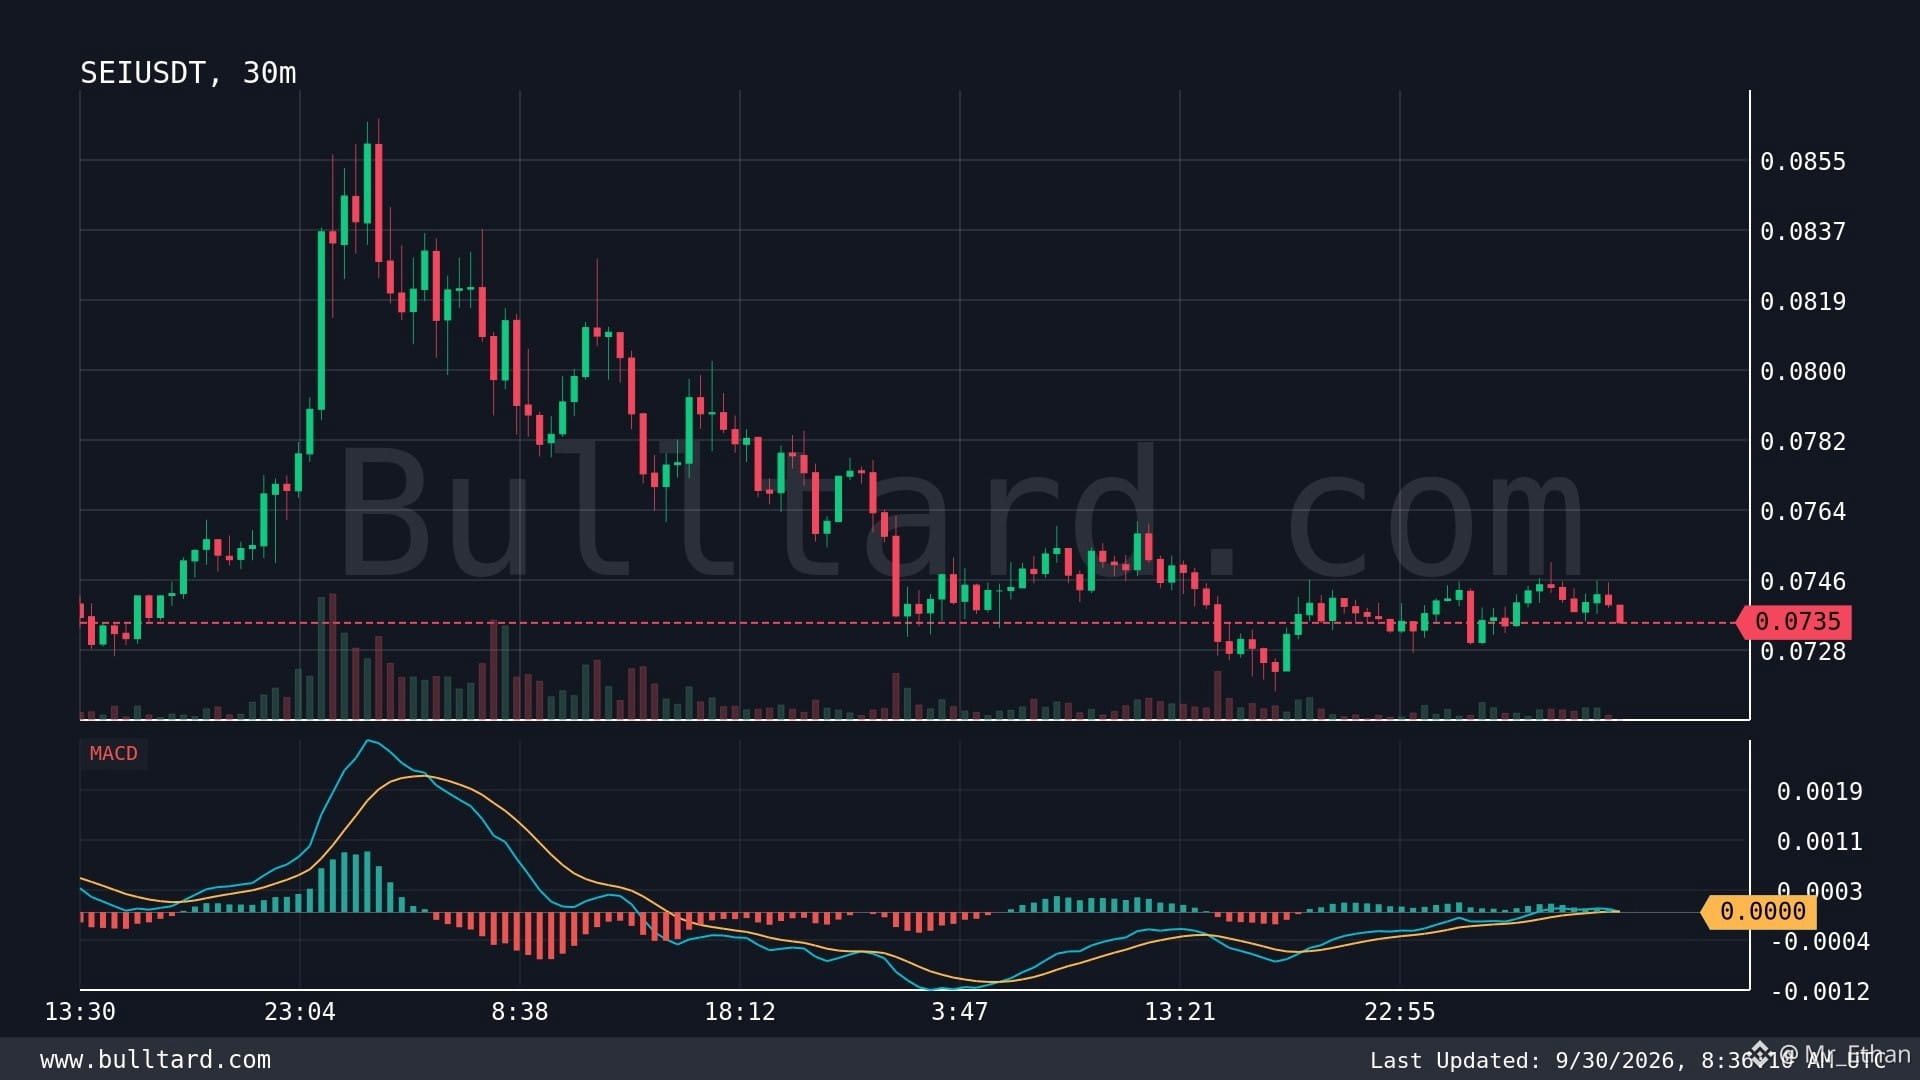
/USDT تُظهر علامة تحذير على مخطط 30m. تم طباعة تقاطع هبوطي شديد عبر MACD، والسعر حول $0.07348.
لقد تعلمت ألا أتعامل مع مؤشر واحد على أنه اتجاه مضمون. ومع ذلك، عندما يتغير الزخم بهذه الحدة، عادةً ما أراقب الشموع القليلة التالية عن كثب. لدى SEI إمكانات قوية كسلسلة بلوكتشين سريعة وقابلة للتوسع، لكن مثل معظم العملات البديلة، قد تشهد تحركات عدوانية عندما يضعف معنويات السوق.
تركيزي هنا سيكون على رد فعل السعر قرب الدعم القريب بدلًا من ملاحقة الحركة. إذا دخل المشترون واستعادوا المقاومة قصيرة المدى، فقد يفقد الإشارة الهبوطية قوتها. أما إذا انكسر الدعم مع حجم تداول، فقد تستمر الضغوط الهبوطية.
من إحدى الدروس التي التقطتها من عالم الكريبتو: تعمل إشارات الزخم بشكل أفضل عندما تُؤكَّد بحركة السعر وحجم التداول. تقاطع واحد فقط لا يكفيني.
أنا أراقب SEI عن كثب الآن. هل سيدافع المشترون عن هذا المستوى، أم سيسيطر البائعون بشكل أكبر؟
$SEI
/USDT تُظهر علامة تحذير على مخطط 30m. تم طباعة تقاطع هبوطي شديد عبر MACD، والسعر حول $0.07348.
لقد تعلمت ألا أتعامل مع مؤشر واحد على أنه اتجاه مضمون. ومع ذلك، عندما يتغير الزخم بهذه الحدة، عادةً ما أراقب الشموع القليلة التالية عن كثب. لدى SEI إمكانات قوية كسلسلة بلوكتشين سريعة وقابلة للتوسع، لكن مثل معظم العملات البديلة، قد تشهد تحركات عدوانية عندما يضعف معنويات السوق.
تركيزي هنا سيكون على رد فعل السعر قرب الدعم القريب بدلًا من ملاحقة الحركة. إذا دخل المشترون واستعادوا المقاومة قصيرة المدى، فقد يفقد الإشارة الهبوطية قوتها. أما إذا انكسر الدعم مع حجم تداول، فقد تستمر الضغوط الهبوطية.
من إحدى الدروس التي التقطتها من عالم الكريبتو: تعمل إشارات الزخم بشكل أفضل عندما تُؤكَّد بحركة السعر وحجم التداول. تقاطع واحد فقط لا يكفيني.
أنا أراقب SEI عن كثب الآن. هل سيدافع المشترون عن هذا المستوى، أم سيسيطر البائعون بشكل أكبر؟
/USDT تُظهر علامة تحذير على مخطط 30m. تم طباعة تقاطع هبوطي شديد عبر MACD، والسعر حول $0.07348.
لقد تعلمت ألا أتعامل مع مؤشر واحد على أنه اتجاه مضمون. ومع ذلك، عندما يتغير الزخم بهذه الحدة، عادةً ما أراقب الشموع القليلة التالية عن كثب. لدى SEI إمكانات قوية كسلسلة بلوكتشين سريعة وقابلة للتوسع، لكن مثل معظم العملات البديلة، قد تشهد تحركات عدوانية عندما يضعف معنويات السوق.
تركيزي هنا سيكون على رد فعل السعر قرب الدعم القريب بدلًا من ملاحقة الحركة. إذا دخل المشترون واستعادوا المقاومة قصيرة المدى، فقد يفقد الإشارة الهبوطية قوتها. أما إذا انكسر الدعم مع حجم تداول، فقد تستمر الضغوط الهبوطية.
من إحدى الدروس التي التقطتها من عالم الكريبتو: تعمل إشارات الزخم بشكل أفضل عندما تُؤكَّد بحركة السعر وحجم التداول. تقاطع واحد فقط لا يكفيني.
أنا أراقب SEI عن كثب الآن. هل سيدافع المشترون عن هذا المستوى، أم سيسيطر البائعون بشكل أكبر؟
1
399
·
--
صاعد
$ETH أنا أراقب زوج /BTC عن كثب بعد ظهور تقاطع هبوطي في MACD على إطار 30 دقيقة. السعر حاليًا حول 0.03081، وبالنسبة لي هذه إشارة إلى البقاء حذرًا بدلًا من مطاردة صفقة.
لقد رأيت هذه التقاطعات قصيرة الأجل تمنح تحركات قوية، لكنني تعلمت أيضًا أن MACD وحده لا يكفي. أريد أن أرى الحجم، وبنية السعر، ومستويات الدعم الرئيسية تؤكد الضعف.
لا يزال إيثريوم يتمتع بأساسيات قوية، وسيولة عميقة، واعتماد واسع عبر DeFi وL2s وWeb3. لكن أمام BTC، قد يواجه ETH صعوبة عندما يتجه رأس المال نحو بيتكوين أو يصبح المتداولون أكثر تحفظًا.
الخطر الرئيسي هنا هو إشارة هبوطية كاذبة. يمكن أن يؤدي التعافي السريع فوق المقاومة القريبة إلى إبطال هذا التكوين وإطلاق ضغط على المراكز القصيرة.
خلاصة تجربتي في تداول هذه الأزواج بسيطة: إشارات الزخم تعمل بشكل أفضل عندما تتوافق مع البنية الأكبر للسوق. أنا أراقب 0.03081 عن كثب للحصول على تأكيد قبل القيام بحركة أقوى.
هل تعتقد أن ETH يمكنه استعادة قوته مقابل BTC، أم أن هناك مزيدًا من الهبوط قادمًا؟
{spot}(ETHUSDT)
$4
{future}(4USDT)
$BULLA
{future}(BULLAUSDT)
$ETH أنا أراقب زوج /BTC عن كثب بعد ظهور تقاطع هبوطي في MACD على إطار 30 دقيقة. السعر حاليًا حول 0.03081، وبالنسبة لي هذه إشارة إلى البقاء حذرًا بدلًا من مطاردة صفقة.
لقد رأيت هذه التقاطعات قصيرة الأجل تمنح تحركات قوية، لكنني تعلمت أيضًا أن MACD وحده لا يكفي. أريد أن أرى الحجم، وبنية السعر، ومستويات الدعم الرئيسية تؤكد الضعف.
لا يزال إيثريوم يتمتع بأساسيات قوية، وسيولة عميقة، واعتماد واسع عبر DeFi وL2s وWeb3. لكن أمام BTC، قد يواجه ETH صعوبة عندما يتجه رأس المال نحو بيتكوين أو يصبح المتداولون أكثر تحفظًا.
الخطر الرئيسي هنا هو إشارة هبوطية كاذبة. يمكن أن يؤدي التعافي السريع فوق المقاومة القريبة إلى إبطال هذا التكوين وإطلاق ضغط على المراكز القصيرة.
خلاصة تجربتي في تداول هذه الأزواج بسيطة: إشارات الزخم تعمل بشكل أفضل عندما تتوافق مع البنية الأكبر للسوق. أنا أراقب 0.03081 عن كثب للحصول على تأكيد قبل القيام بحركة أقوى.
هل تعتقد أن ETH يمكنه استعادة قوته مقابل BTC، أم أن هناك مزيدًا من الهبوط قادمًا؟
$4
$BULLA
لقد رأيت هذه التقاطعات قصيرة الأجل تمنح تحركات قوية، لكنني تعلمت أيضًا أن MACD وحده لا يكفي. أريد أن أرى الحجم، وبنية السعر، ومستويات الدعم الرئيسية تؤكد الضعف.
لا يزال إيثريوم يتمتع بأساسيات قوية، وسيولة عميقة، واعتماد واسع عبر DeFi وL2s وWeb3. لكن أمام BTC، قد يواجه ETH صعوبة عندما يتجه رأس المال نحو بيتكوين أو يصبح المتداولون أكثر تحفظًا.
الخطر الرئيسي هنا هو إشارة هبوطية كاذبة. يمكن أن يؤدي التعافي السريع فوق المقاومة القريبة إلى إبطال هذا التكوين وإطلاق ضغط على المراكز القصيرة.
خلاصة تجربتي في تداول هذه الأزواج بسيطة: إشارات الزخم تعمل بشكل أفضل عندما تتوافق مع البنية الأكبر للسوق. أنا أراقب 0.03081 عن كثب للحصول على تأكيد قبل القيام بحركة أقوى.
هل تعتقد أن ETH يمكنه استعادة قوته مقابل BTC، أم أن هناك مزيدًا من الهبوط قادمًا؟
$4
$BULLA
351
·
--
صاعد
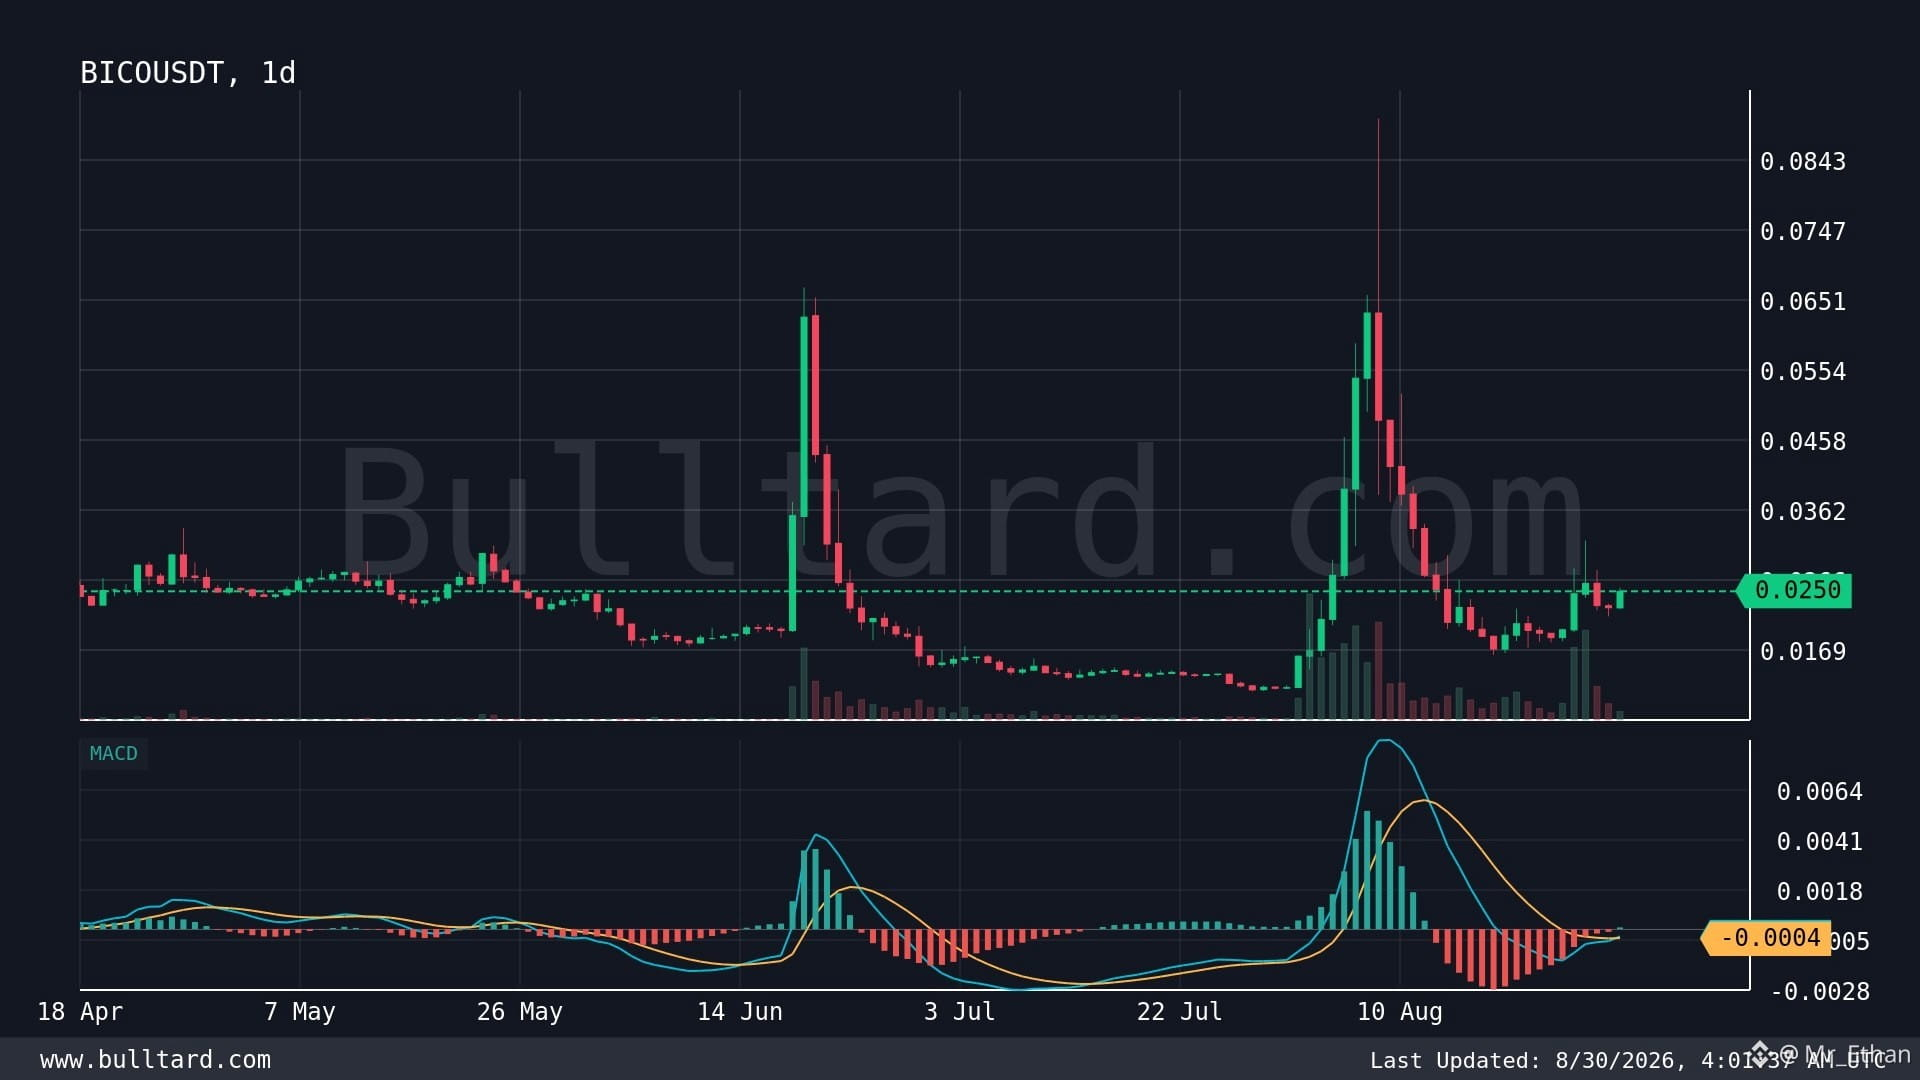
$BICO /USDT يعطيني إشارة وأنا أوليها اهتمامًا 👀🔥
لقد تعلمت أنه عندما يعطي MACD اليومي تقاطعًا صعوديًا قويًا، لا أتعامل معه كإشارة شراء فورية. أتعامل معه كعلامة على أن الزخم قد يبدأ في التغيّر. في الوقت الحالي، تبلغ BICO حوالي 0.025 دولار، لذا فإن هذه الإعدادات تستحق بالتأكيد المتابعة.
يركّز Biconomy على تبسيط معاملات البلوكشين وتحسين تجربة المستخدم لتطبيقات Web3. وهذا مهم لأن بنية تحتية أفضل يمكن أن تساعد في إزالة بعض الاحتكاك الذي يُبعد المستخدمين العاديين عن عالم العملات الرقمية.
ما يعجبني هو جانب البنية التحتية وإمكانية التبنّي الأوسع لـ Web3. لكنني أيضًا أحافظ على توقعاتي واقعية. لا يزال BICO يواجه منافسة، ومخاطر سيولة، وتقلبات في السوق، والمشكلة المعتادة المتمثلة في ما إذا كان الاستخدام الحقيقي يمكن أن يتحول إلى قيمة رمزية طويلة الأجل.
أكبر درس تعلّمته من التداول بهذه الإعدادات هو بسيط: MACD قد يُظهر الزخم، لكن حركة السعر هي التي يجب أن تؤكده. أفضل الدخول في وقت متأخر مع تأكيد بدلاً من مطاردة أول شمعة خضراء.
أنا أتابع BICO عن كثب الآن. هل تعتقد أن هذا التقاطع اليومي يمكن أن يتحول إلى اتجاه أكبر؟
$BICO
{spot}(BICOUSDT)
$BMT
{spot}(BMTUSDT)
$BICO /USDT يعطيني إشارة وأنا أوليها اهتمامًا 👀🔥
لقد تعلمت أنه عندما يعطي MACD اليومي تقاطعًا صعوديًا قويًا، لا أتعامل معه كإشارة شراء فورية. أتعامل معه كعلامة على أن الزخم قد يبدأ في التغيّر. في الوقت الحالي، تبلغ BICO حوالي 0.025 دولار، لذا فإن هذه الإعدادات تستحق بالتأكيد المتابعة.
يركّز Biconomy على تبسيط معاملات البلوكشين وتحسين تجربة المستخدم لتطبيقات Web3. وهذا مهم لأن بنية تحتية أفضل يمكن أن تساعد في إزالة بعض الاحتكاك الذي يُبعد المستخدمين العاديين عن عالم العملات الرقمية.
ما يعجبني هو جانب البنية التحتية وإمكانية التبنّي الأوسع لـ Web3. لكنني أيضًا أحافظ على توقعاتي واقعية. لا يزال BICO يواجه منافسة، ومخاطر سيولة، وتقلبات في السوق، والمشكلة المعتادة المتمثلة في ما إذا كان الاستخدام الحقيقي يمكن أن يتحول إلى قيمة رمزية طويلة الأجل.
أكبر درس تعلّمته من التداول بهذه الإعدادات هو بسيط: MACD قد يُظهر الزخم، لكن حركة السعر هي التي يجب أن تؤكده. أفضل الدخول في وقت متأخر مع تأكيد بدلاً من مطاردة أول شمعة خضراء.
أنا أتابع BICO عن كثب الآن. هل تعتقد أن هذا التقاطع اليومي يمكن أن يتحول إلى اتجاه أكبر؟
$BICO
$BMT
لقد تعلمت أنه عندما يعطي MACD اليومي تقاطعًا صعوديًا قويًا، لا أتعامل معه كإشارة شراء فورية. أتعامل معه كعلامة على أن الزخم قد يبدأ في التغيّر. في الوقت الحالي، تبلغ BICO حوالي 0.025 دولار، لذا فإن هذه الإعدادات تستحق بالتأكيد المتابعة.
يركّز Biconomy على تبسيط معاملات البلوكشين وتحسين تجربة المستخدم لتطبيقات Web3. وهذا مهم لأن بنية تحتية أفضل يمكن أن تساعد في إزالة بعض الاحتكاك الذي يُبعد المستخدمين العاديين عن عالم العملات الرقمية.
ما يعجبني هو جانب البنية التحتية وإمكانية التبنّي الأوسع لـ Web3. لكنني أيضًا أحافظ على توقعاتي واقعية. لا يزال BICO يواجه منافسة، ومخاطر سيولة، وتقلبات في السوق، والمشكلة المعتادة المتمثلة في ما إذا كان الاستخدام الحقيقي يمكن أن يتحول إلى قيمة رمزية طويلة الأجل.
أكبر درس تعلّمته من التداول بهذه الإعدادات هو بسيط: MACD قد يُظهر الزخم، لكن حركة السعر هي التي يجب أن تؤكده. أفضل الدخول في وقت متأخر مع تأكيد بدلاً من مطاردة أول شمعة خضراء.
أنا أتابع BICO عن كثب الآن. هل تعتقد أن هذا التقاطع اليومي يمكن أن يتحول إلى اتجاه أكبر؟
$BICO
$BMT
247
·
--
صاعد
$GRAM /USDT. لقد طبع مؤشر MACD لإطار 30 دقيقة للتو تقاطعًا صعوديًا، والسعر حول 1.358. عادةً أركز على هذه الإشارات لأنها قد تُظهر متى يبدأ الزخم قصير الأجل في التحول.
لقد تعلمت أن تقاطع MACD وحده لا يكون كافيًا بالنسبة لي للدخول. أريد أن أرى حجم التداول، وبنية السعر، والاستمرار/الاختراق الفعلي. إذا استمر المشترون في الدفاع عن المنطقة الحالية وظل الزخم يتزايد، فقد يتطور ذلك إلى حركة أقوى على المدى القصير.
ما يعجبني هو إشارة الزخم المبكرة. نقطة الضعف أن إشارات 30 دقيقة يمكن أن تنعكس بسرعة، خصوصًا في سوق شديد التقلب. عمليات الاختراق الوهمية وعمليات سحب السيولة المفاجئة دائمًا ممكنة، لذلك أحافظ على إدارة المخاطر بشكل صارم.
أهم درس تعلمته من تداول هذه الإعدادات: التأكيد أهم من التقاطع نفسه. أفضل أن أدخل بعد قليل مع تأكيد أقوى بدلًا من مطاردة الشمعة الأولى.
أنا أتابع. $GRAM
{spot}(GRAMUSDT)
$WET
{future}(WETUSDT)
$GRAM /USDT. لقد طبع مؤشر MACD لإطار 30 دقيقة للتو تقاطعًا صعوديًا، والسعر حول 1.358. عادةً أركز على هذه الإشارات لأنها قد تُظهر متى يبدأ الزخم قصير الأجل في التحول.
لقد تعلمت أن تقاطع MACD وحده لا يكون كافيًا بالنسبة لي للدخول. أريد أن أرى حجم التداول، وبنية السعر، والاستمرار/الاختراق الفعلي. إذا استمر المشترون في الدفاع عن المنطقة الحالية وظل الزخم يتزايد، فقد يتطور ذلك إلى حركة أقوى على المدى القصير.
ما يعجبني هو إشارة الزخم المبكرة. نقطة الضعف أن إشارات 30 دقيقة يمكن أن تنعكس بسرعة، خصوصًا في سوق شديد التقلب. عمليات الاختراق الوهمية وعمليات سحب السيولة المفاجئة دائمًا ممكنة، لذلك أحافظ على إدارة المخاطر بشكل صارم.
أهم درس تعلمته من تداول هذه الإعدادات: التأكيد أهم من التقاطع نفسه. أفضل أن أدخل بعد قليل مع تأكيد أقوى بدلًا من مطاردة الشمعة الأولى.
أنا أتابع. $GRAM
$WET
لقد تعلمت أن تقاطع MACD وحده لا يكون كافيًا بالنسبة لي للدخول. أريد أن أرى حجم التداول، وبنية السعر، والاستمرار/الاختراق الفعلي. إذا استمر المشترون في الدفاع عن المنطقة الحالية وظل الزخم يتزايد، فقد يتطور ذلك إلى حركة أقوى على المدى القصير.
ما يعجبني هو إشارة الزخم المبكرة. نقطة الضعف أن إشارات 30 دقيقة يمكن أن تنعكس بسرعة، خصوصًا في سوق شديد التقلب. عمليات الاختراق الوهمية وعمليات سحب السيولة المفاجئة دائمًا ممكنة، لذلك أحافظ على إدارة المخاطر بشكل صارم.
أهم درس تعلمته من تداول هذه الإعدادات: التأكيد أهم من التقاطع نفسه. أفضل أن أدخل بعد قليل مع تأكيد أقوى بدلًا من مطاردة الشمعة الأولى.
أنا أتابع. $GRAM
$WET
345
·
--
صاعد
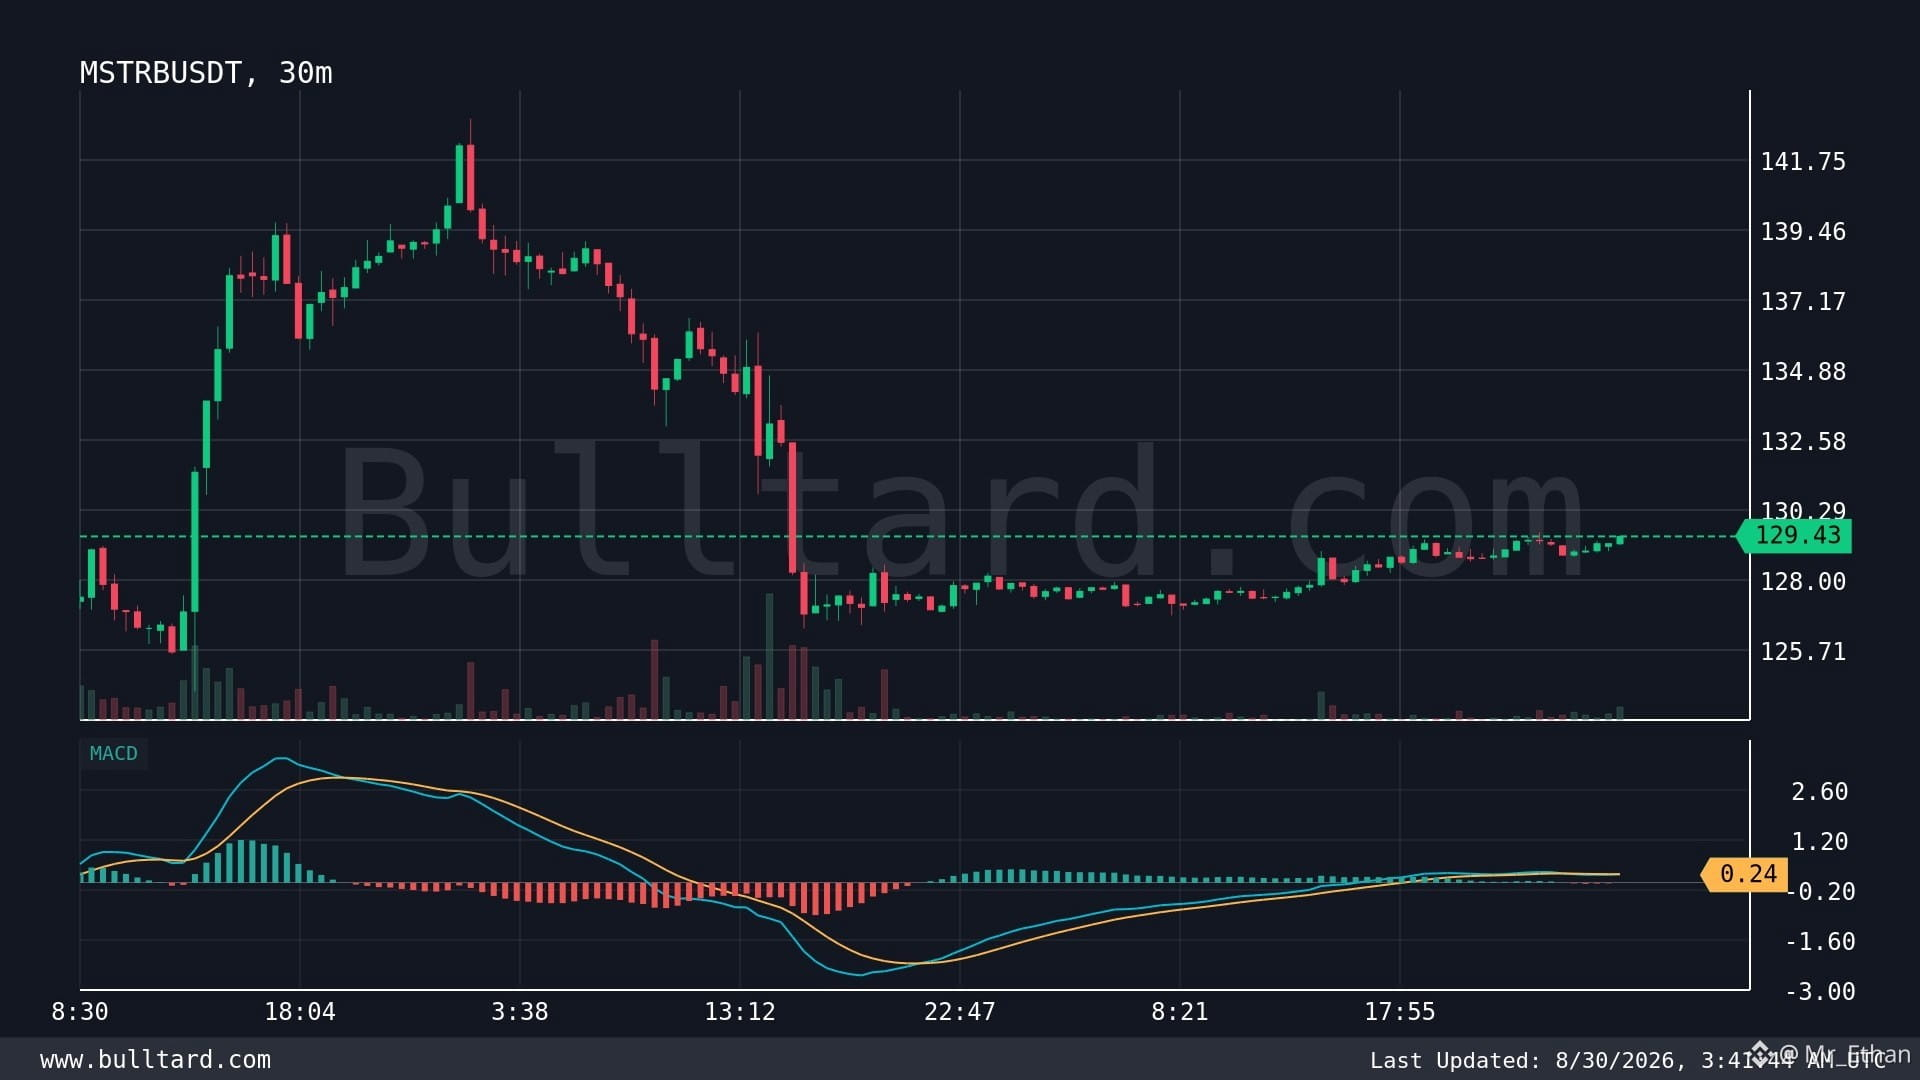
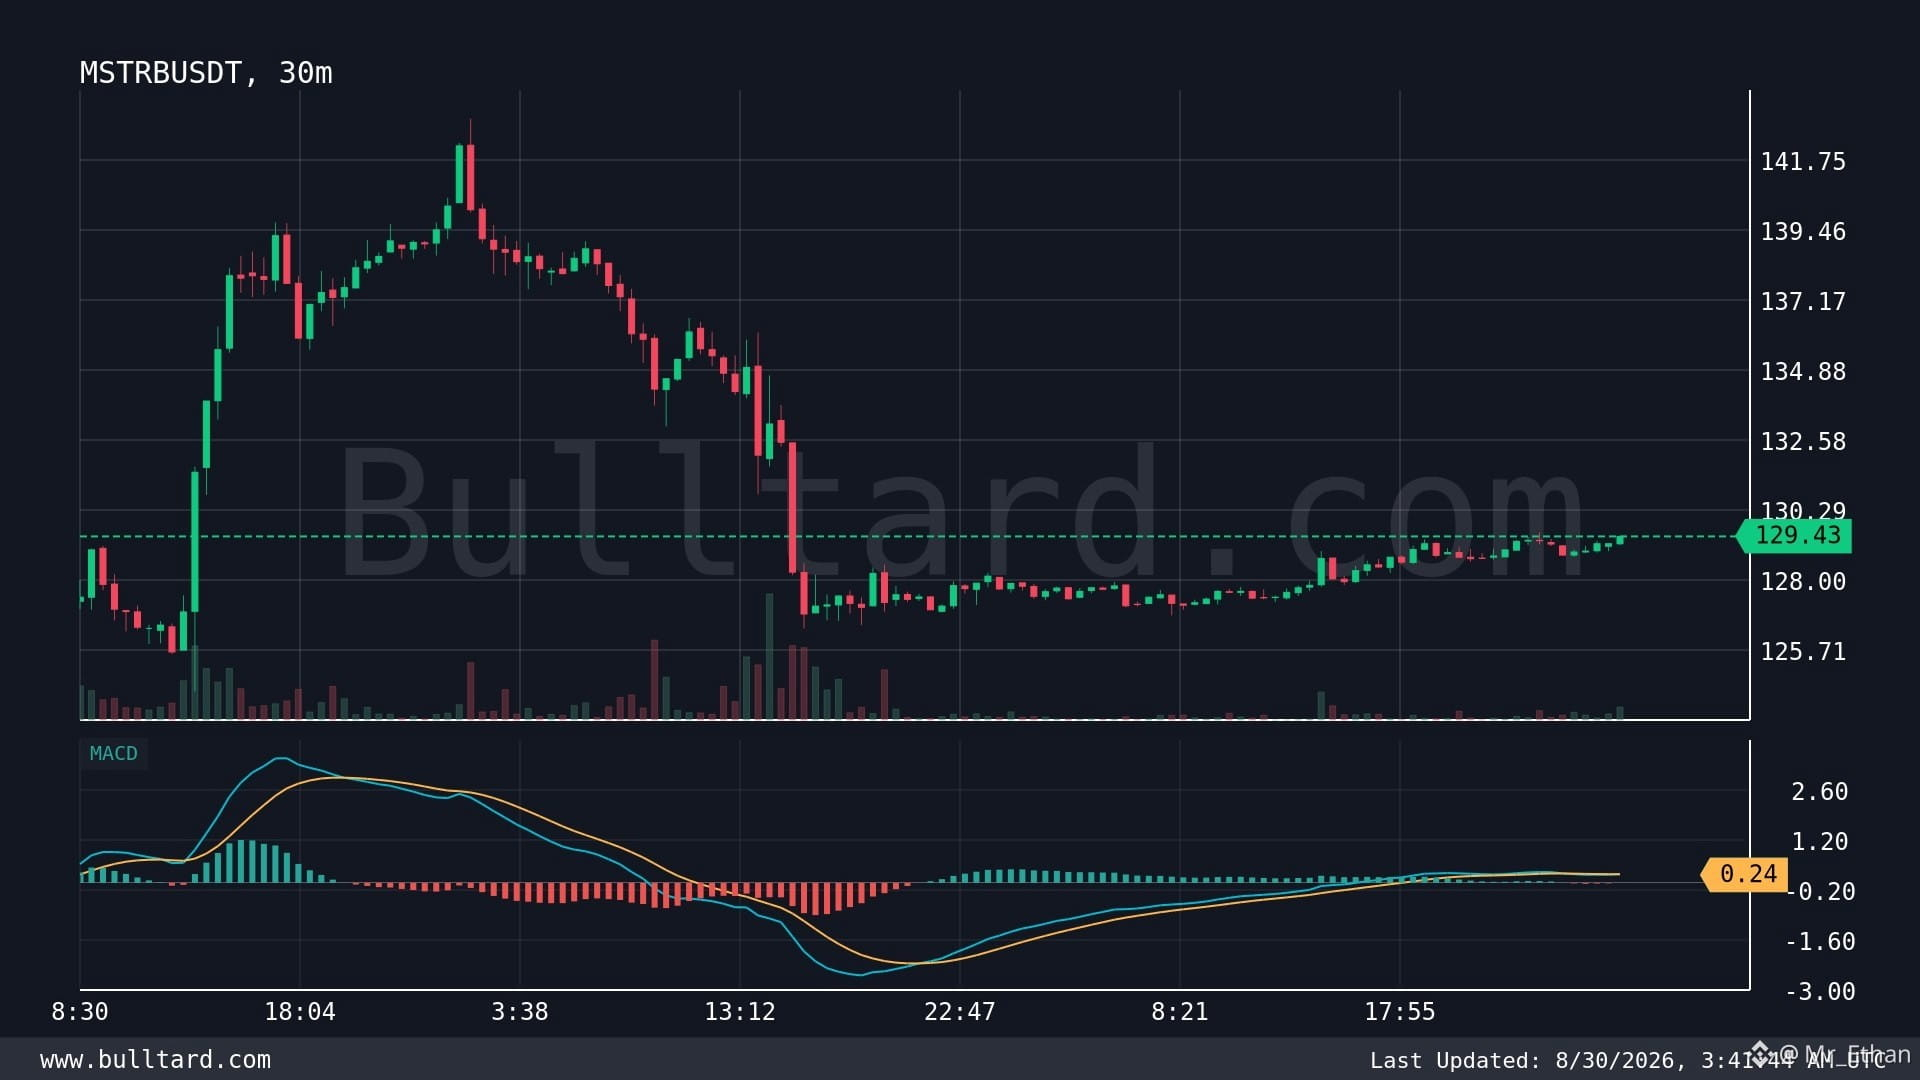
$MSTRB /يُظهر USDT تقاطع MACD صاعدًا على مخطط 30 دقيقة، وأنا أراقب هذا بعناية.
السعر يدور حول 129.43$، وبالنسبة لي، الإشارة الأساسية هنا هي أن الزخم بدأ يتحول إلى الإيجابية. رأيت العديد من تقاطعات MACD تفشل، لذلك لا أتعامل أبدًا مع إشارة واحدة على أنها حركة مضمونة. أريد أن أرى استمرارًا (follow-through)، وزيادةً في حجم التداول بشكل أقوى، وأن يبقى السعر فوق مستوى الدعم القريب.
ما يعجبني هو أن التقاطع الصاعد يمكن أحيانًا أن يلتقط الجزء المبكر من انعكاس اتجاه قصير الأجل. لكن المخاطر بسيطة: إذا خسر المشترون الزخم، يمكن لهذه الإشارة بسرعة أن تتحول إلى إشارة كاذبة.
من تجربتي مع هذه الإعدادات، فإن الصبر أهم من ملاحقة أول شمعة خضراء. أنا أراقب كيف يتصرف السعر بعد التقاطع بدلًا من افتراض أن الحركة مؤكدة بالفعل.
في الوقت الحالي، أنا متفائل بحذر، لكن سأظل منضبطًا وأدير المخاطر إذا تدهور الإعداد.
هل تعتقد أنه يمكنه بناء زخم كافٍ للحركة التالية للأعلى؟
$MSTRB
{spot}(MSTRBUSDT)
$FGII.US
{stock_us}(FGII.US)
$MSTRB /يُظهر USDT تقاطع MACD صاعدًا على مخطط 30 دقيقة، وأنا أراقب هذا بعناية.
السعر يدور حول 129.43$، وبالنسبة لي، الإشارة الأساسية هنا هي أن الزخم بدأ يتحول إلى الإيجابية. رأيت العديد من تقاطعات MACD تفشل، لذلك لا أتعامل أبدًا مع إشارة واحدة على أنها حركة مضمونة. أريد أن أرى استمرارًا (follow-through)، وزيادةً في حجم التداول بشكل أقوى، وأن يبقى السعر فوق مستوى الدعم القريب.
ما يعجبني هو أن التقاطع الصاعد يمكن أحيانًا أن يلتقط الجزء المبكر من انعكاس اتجاه قصير الأجل. لكن المخاطر بسيطة: إذا خسر المشترون الزخم، يمكن لهذه الإشارة بسرعة أن تتحول إلى إشارة كاذبة.
من تجربتي مع هذه الإعدادات، فإن الصبر أهم من ملاحقة أول شمعة خضراء. أنا أراقب كيف يتصرف السعر بعد التقاطع بدلًا من افتراض أن الحركة مؤكدة بالفعل.
في الوقت الحالي، أنا متفائل بحذر، لكن سأظل منضبطًا وأدير المخاطر إذا تدهور الإعداد.
هل تعتقد أنه يمكنه بناء زخم كافٍ للحركة التالية للأعلى؟
$MSTRB
$FGII.US
السعر يدور حول 129.43$، وبالنسبة لي، الإشارة الأساسية هنا هي أن الزخم بدأ يتحول إلى الإيجابية. رأيت العديد من تقاطعات MACD تفشل، لذلك لا أتعامل أبدًا مع إشارة واحدة على أنها حركة مضمونة. أريد أن أرى استمرارًا (follow-through)، وزيادةً في حجم التداول بشكل أقوى، وأن يبقى السعر فوق مستوى الدعم القريب.
ما يعجبني هو أن التقاطع الصاعد يمكن أحيانًا أن يلتقط الجزء المبكر من انعكاس اتجاه قصير الأجل. لكن المخاطر بسيطة: إذا خسر المشترون الزخم، يمكن لهذه الإشارة بسرعة أن تتحول إلى إشارة كاذبة.
من تجربتي مع هذه الإعدادات، فإن الصبر أهم من ملاحقة أول شمعة خضراء. أنا أراقب كيف يتصرف السعر بعد التقاطع بدلًا من افتراض أن الحركة مؤكدة بالفعل.
في الوقت الحالي، أنا متفائل بحذر، لكن سأظل منضبطًا وأدير المخاطر إذا تدهور الإعداد.
هل تعتقد أنه يمكنه بناء زخم كافٍ للحركة التالية للأعلى؟
$MSTRB
$FGII.US
MSTRB-٠٫٢٩%
FGIIUS+٠٫١٤%
109
·
--
هابط
$RE يجذب انتباهي الآن.
على الرسم البياني لمدّة 30 دقيقة، أرى تقاطعًا صعوديًا للـ MACD مع السعر قرب 0.4892 دولار. لا أتعامل مع تقاطع واحد كضمان لاندفاع سعري، لكن من خبرتي فإن تحولات الزخم المبكرة هذه تستحق المتابعة عن كثب، خصوصًا عندما يبدأ الحجم (التيك/السيولة) في تأكيد الحركة.
بالنسبة لي، الجزء المثير للاهتمام هو كيفية استجابة السعر بعد هذه الإشارة. إذا استطاع المشترون الحفاظ على المنطقة الحالية والدفع عبر مقاومة قريبة، فقد يتطور الإعداد إلى اتجاه قصير الأجل أقوى. لكن إذا بقي حجم التداول ضعيفًا، فسأكون حذرًا، لأن إشارات MACD قد تتحول بسهولة إلى إشارات كاذبة في الأسواق المتقلبة.
شيء تعلمته في تداول العملات الرقمية هو أن الدخول لمجرد أن مؤشرًا يتحول إلى اللون الأخضر غالبًا ما يكون خطأ. أفضّل انتظار تأكيد من حركة السعر والحجم وبنية السوق.
القوة هنا تتمثل في تحسن الزخم. أما المخاطرة فهي بسيطة: يمكن أن يفشل التقاطع بسرعة إذا تراجع البائعون.
أنا أتابع عن كثب بدلًا من الاندفاع وراء السعر.
هل ستثق بهذا التقاطع الصعودي، أم ستنتظر تأكيدًا أقوى؟
$RE
{spot}(REUSDT)
$RE يجذب انتباهي الآن.
على الرسم البياني لمدّة 30 دقيقة، أرى تقاطعًا صعوديًا للـ MACD مع السعر قرب 0.4892 دولار. لا أتعامل مع تقاطع واحد كضمان لاندفاع سعري، لكن من خبرتي فإن تحولات الزخم المبكرة هذه تستحق المتابعة عن كثب، خصوصًا عندما يبدأ الحجم (التيك/السيولة) في تأكيد الحركة.
بالنسبة لي، الجزء المثير للاهتمام هو كيفية استجابة السعر بعد هذه الإشارة. إذا استطاع المشترون الحفاظ على المنطقة الحالية والدفع عبر مقاومة قريبة، فقد يتطور الإعداد إلى اتجاه قصير الأجل أقوى. لكن إذا بقي حجم التداول ضعيفًا، فسأكون حذرًا، لأن إشارات MACD قد تتحول بسهولة إلى إشارات كاذبة في الأسواق المتقلبة.
شيء تعلمته في تداول العملات الرقمية هو أن الدخول لمجرد أن مؤشرًا يتحول إلى اللون الأخضر غالبًا ما يكون خطأ. أفضّل انتظار تأكيد من حركة السعر والحجم وبنية السوق.
القوة هنا تتمثل في تحسن الزخم. أما المخاطرة فهي بسيطة: يمكن أن يفشل التقاطع بسرعة إذا تراجع البائعون.
أنا أتابع عن كثب بدلًا من الاندفاع وراء السعر.
هل ستثق بهذا التقاطع الصعودي، أم ستنتظر تأكيدًا أقوى؟
$RE
على الرسم البياني لمدّة 30 دقيقة، أرى تقاطعًا صعوديًا للـ MACD مع السعر قرب 0.4892 دولار. لا أتعامل مع تقاطع واحد كضمان لاندفاع سعري، لكن من خبرتي فإن تحولات الزخم المبكرة هذه تستحق المتابعة عن كثب، خصوصًا عندما يبدأ الحجم (التيك/السيولة) في تأكيد الحركة.
بالنسبة لي، الجزء المثير للاهتمام هو كيفية استجابة السعر بعد هذه الإشارة. إذا استطاع المشترون الحفاظ على المنطقة الحالية والدفع عبر مقاومة قريبة، فقد يتطور الإعداد إلى اتجاه قصير الأجل أقوى. لكن إذا بقي حجم التداول ضعيفًا، فسأكون حذرًا، لأن إشارات MACD قد تتحول بسهولة إلى إشارات كاذبة في الأسواق المتقلبة.
شيء تعلمته في تداول العملات الرقمية هو أن الدخول لمجرد أن مؤشرًا يتحول إلى اللون الأخضر غالبًا ما يكون خطأ. أفضّل انتظار تأكيد من حركة السعر والحجم وبنية السوق.
القوة هنا تتمثل في تحسن الزخم. أما المخاطرة فهي بسيطة: يمكن أن يفشل التقاطع بسرعة إذا تراجع البائعون.
أنا أتابع عن كثب بدلًا من الاندفاع وراء السعر.
هل ستثق بهذا التقاطع الصعودي، أم ستنتظر تأكيدًا أقوى؟
$RE
179
·
--
صاعد
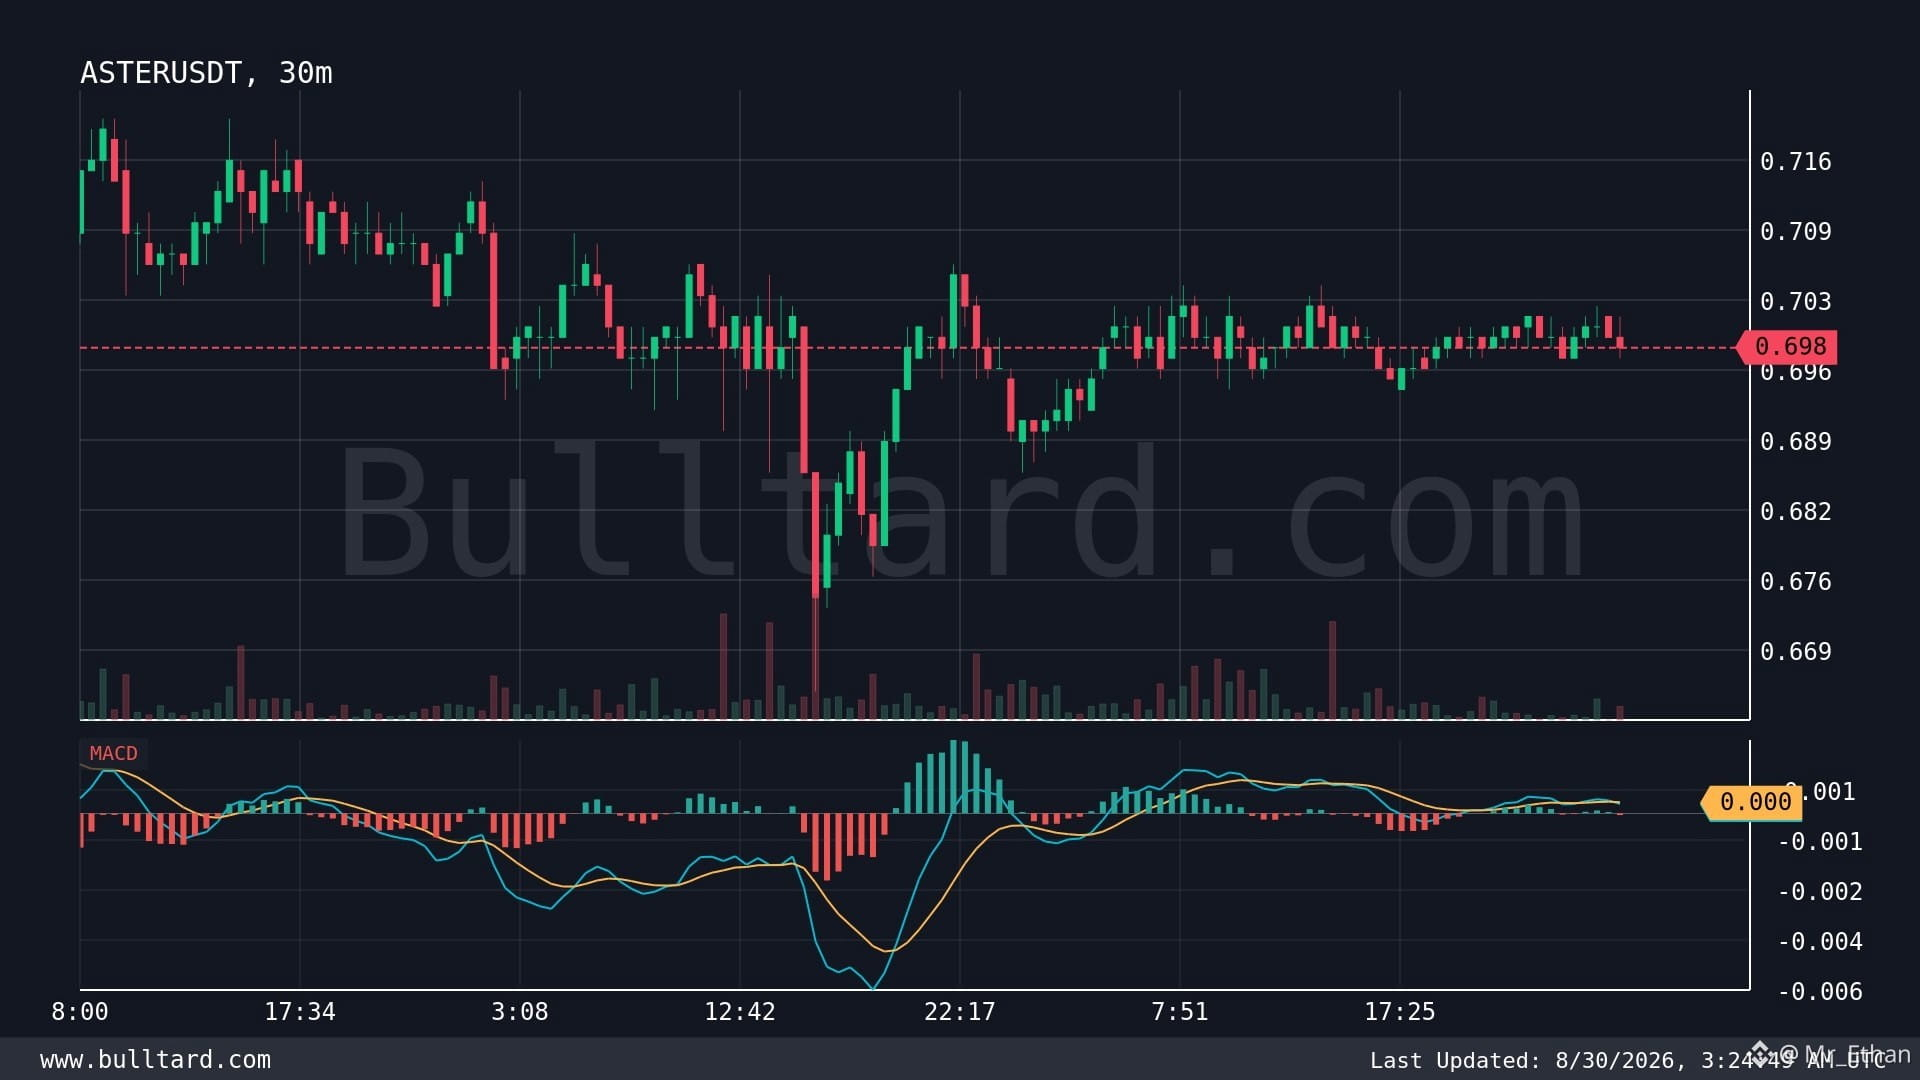
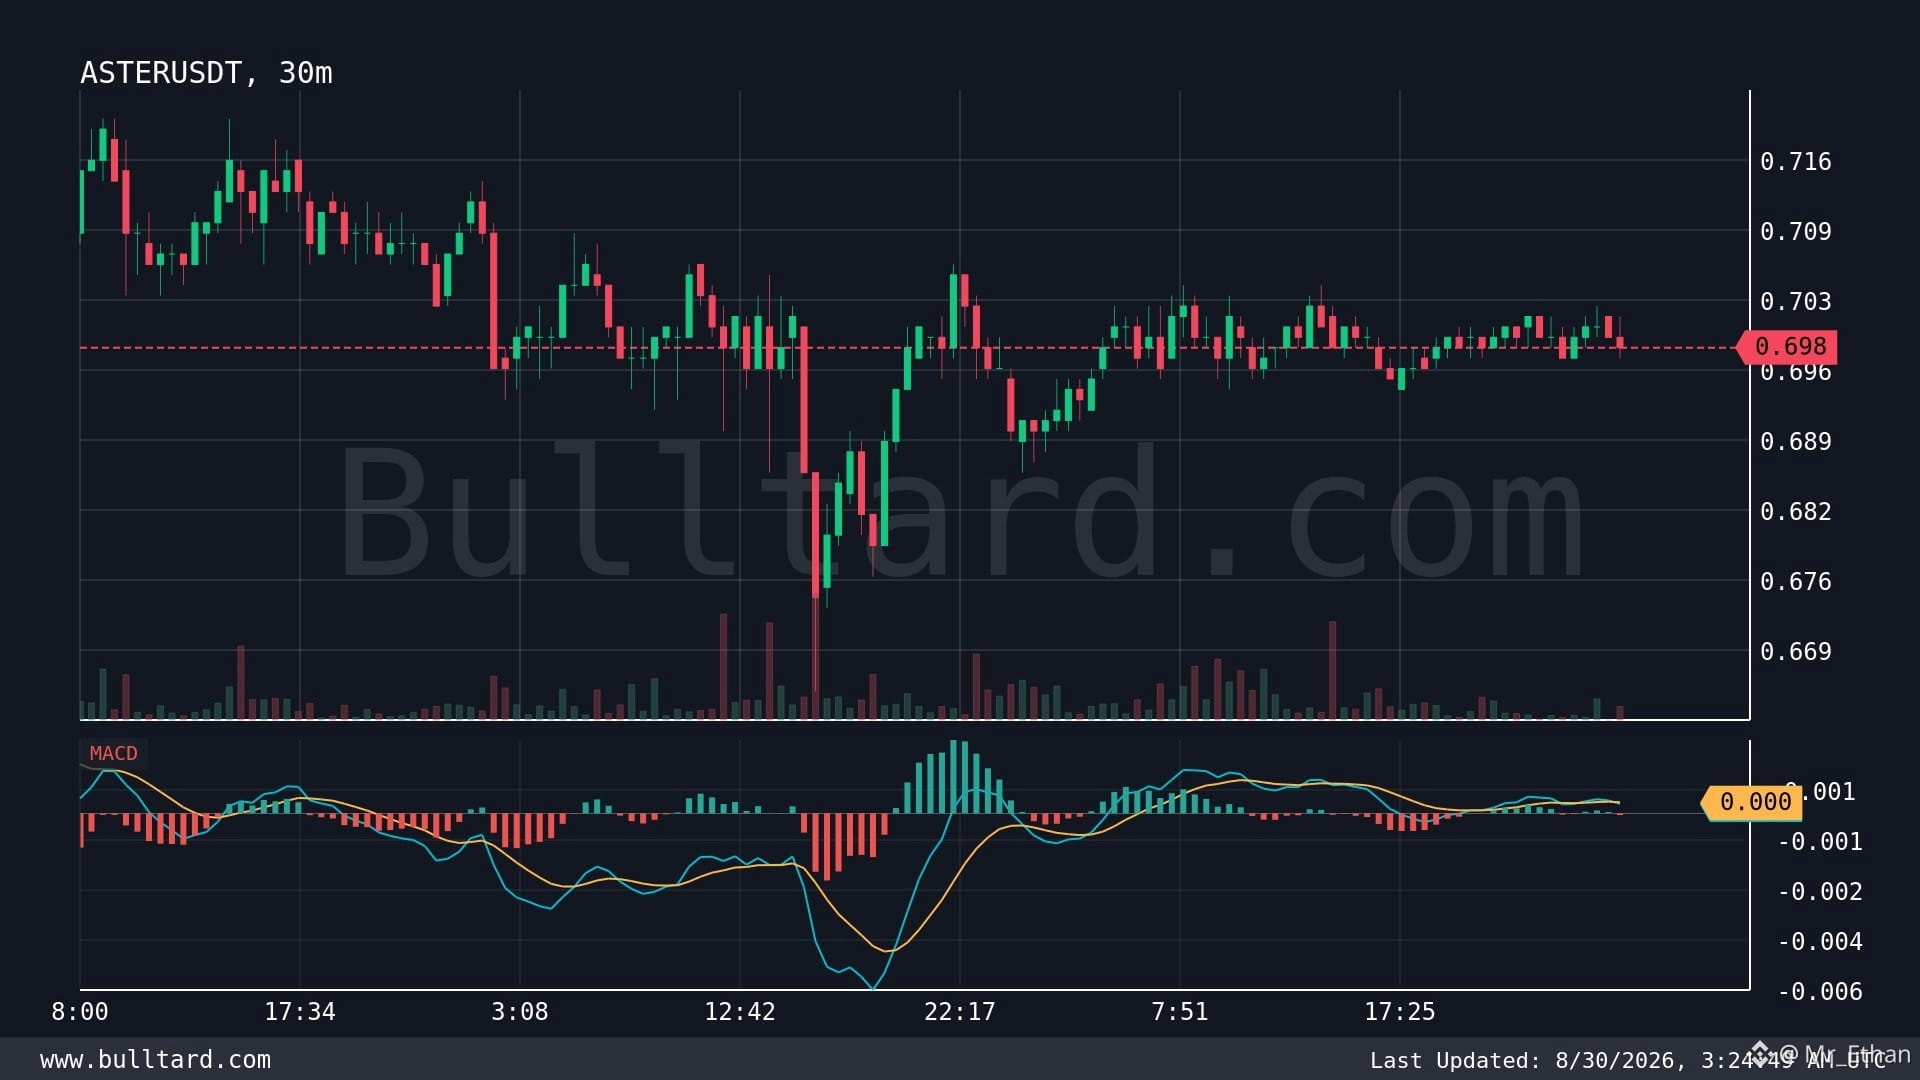
$ASTER /USDT تُظهر تقاطع MACD هابطًا بشكل قوي جدًا على مخطط 30 دقيقة 💀
أنا أتابع هذه الإشارة بعناية لأن إشارات الأجل القصير قد تغيّر بنية السوق بسرعة. عند حوالي 0.698 دولار، تركيزي الأول هو كيف يتفاعل السعر بعد ظهور الزخم الهابط.
لقد تعلمت ألا أندفع وراء شمعة فقط لأن MACD أصبح هابطًا. أفضّل انتظار التأكيد، خصوصًا بالقرب من مناطق الدعم. إذا بقي البائعون مسيطرين، فقد تشهد ASTER مزيدًا من ضغط الهبوط. لكن إذا استعاد المشترون الزخم وبدأ MACD بالتعافي، فقد تفقد هذه الإشارة قوتها بسرعة.
تحتل ASTER مكانًا مثيرًا للاهتمام في سوق العملات الرقمية، لكن مثل معظم الرموز الأحدث، فإن التقلب يُعد خطرًا كبيرًا. السيولة، المعنويات، والتغيّرات المفاجئة في حجم التداول يمكن أن تحرّك السعر بقوة.
بالنسبة لي، الدرس الأساسي بسيط: MACD هو إشارة، وليس ضمانًا. أستخدمه مع حركة السعر وحجم التداول ودعم/مقاومة قبل اتخاذ قرار.
أنا سأبقى حذرًا هنا وأراقب الشموع القليلة القادمة لمدة 30 دقيقة عن كثب.
هل ستنتظر التأكيد أم تتوقع مزيدًا من الهبوط من
$ASTER
{spot}(ASTERUSDT)
$BNB
{spot}(BNBUSDT)
$ASTER /USDT تُظهر تقاطع MACD هابطًا بشكل قوي جدًا على مخطط 30 دقيقة 💀
أنا أتابع هذه الإشارة بعناية لأن إشارات الأجل القصير قد تغيّر بنية السوق بسرعة. عند حوالي 0.698 دولار، تركيزي الأول هو كيف يتفاعل السعر بعد ظهور الزخم الهابط.
لقد تعلمت ألا أندفع وراء شمعة فقط لأن MACD أصبح هابطًا. أفضّل انتظار التأكيد، خصوصًا بالقرب من مناطق الدعم. إذا بقي البائعون مسيطرين، فقد تشهد ASTER مزيدًا من ضغط الهبوط. لكن إذا استعاد المشترون الزخم وبدأ MACD بالتعافي، فقد تفقد هذه الإشارة قوتها بسرعة.
تحتل ASTER مكانًا مثيرًا للاهتمام في سوق العملات الرقمية، لكن مثل معظم الرموز الأحدث، فإن التقلب يُعد خطرًا كبيرًا. السيولة، المعنويات، والتغيّرات المفاجئة في حجم التداول يمكن أن تحرّك السعر بقوة.
بالنسبة لي، الدرس الأساسي بسيط: MACD هو إشارة، وليس ضمانًا. أستخدمه مع حركة السعر وحجم التداول ودعم/مقاومة قبل اتخاذ قرار.
أنا سأبقى حذرًا هنا وأراقب الشموع القليلة القادمة لمدة 30 دقيقة عن كثب.
هل ستنتظر التأكيد أم تتوقع مزيدًا من الهبوط من
$ASTER
$BNB
أنا أتابع هذه الإشارة بعناية لأن إشارات الأجل القصير قد تغيّر بنية السوق بسرعة. عند حوالي 0.698 دولار، تركيزي الأول هو كيف يتفاعل السعر بعد ظهور الزخم الهابط.
لقد تعلمت ألا أندفع وراء شمعة فقط لأن MACD أصبح هابطًا. أفضّل انتظار التأكيد، خصوصًا بالقرب من مناطق الدعم. إذا بقي البائعون مسيطرين، فقد تشهد ASTER مزيدًا من ضغط الهبوط. لكن إذا استعاد المشترون الزخم وبدأ MACD بالتعافي، فقد تفقد هذه الإشارة قوتها بسرعة.
تحتل ASTER مكانًا مثيرًا للاهتمام في سوق العملات الرقمية، لكن مثل معظم الرموز الأحدث، فإن التقلب يُعد خطرًا كبيرًا. السيولة، المعنويات، والتغيّرات المفاجئة في حجم التداول يمكن أن تحرّك السعر بقوة.
بالنسبة لي، الدرس الأساسي بسيط: MACD هو إشارة، وليس ضمانًا. أستخدمه مع حركة السعر وحجم التداول ودعم/مقاومة قبل اتخاذ قرار.
أنا سأبقى حذرًا هنا وأراقب الشموع القليلة القادمة لمدة 30 دقيقة عن كثب.
هل ستنتظر التأكيد أم تتوقع مزيدًا من الهبوط من
$ASTER
$BNB
227
·
--
هابط
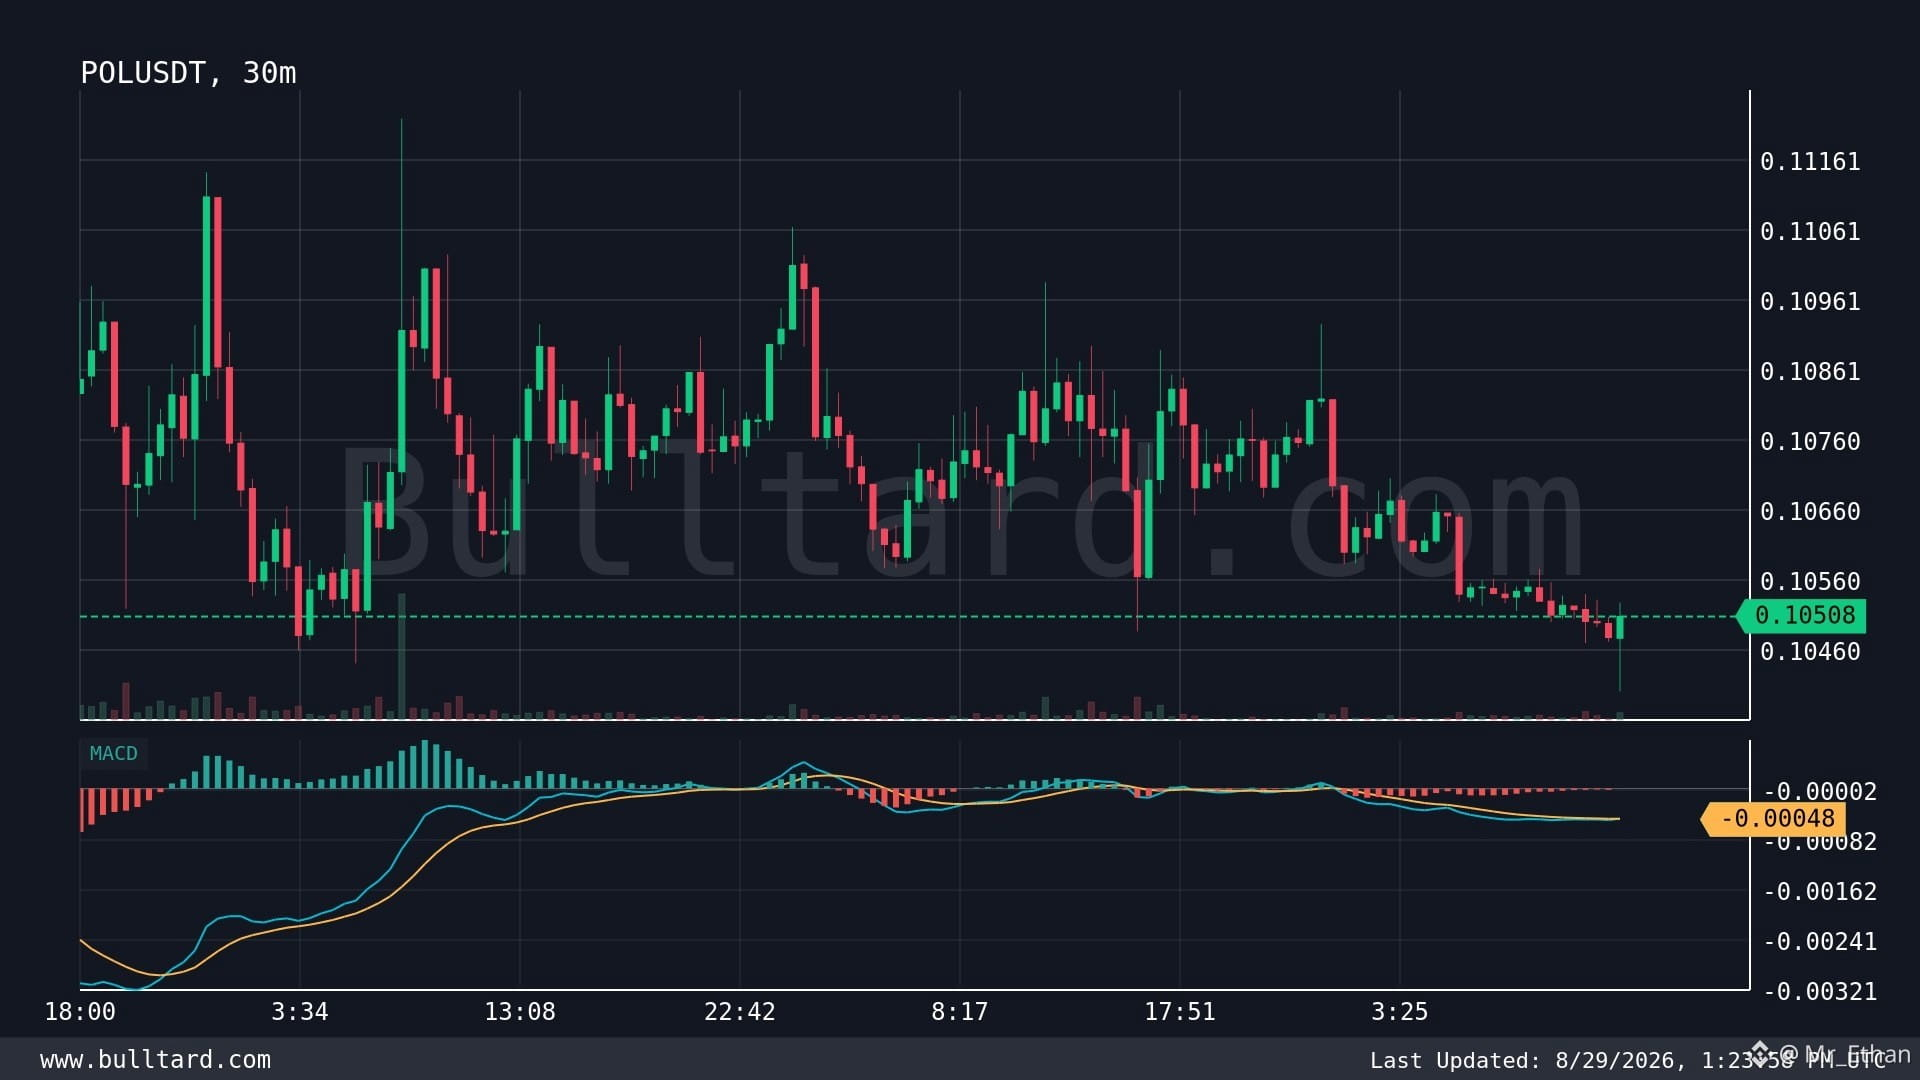
يعرض MACD صعودي تقاطعًا على مخطط 30 دقيقة، وأنا أراقب هذا عن كثب.
لقد تعلمت أن هذه الإشارات قصيرة الأجل يمكن أن تكون مفيدة لاكتشاف تحولات الزخم مبكرًا، لكنني لا أعتبر تقاطعًا واحدًا ضمانًا للصفقة أبدًا. في الوقت الحالي، POL عند حوالي 0.10508$، لذلك أبحث عن استمرار الشراء قبل أن أكون عدوانيًا للغاية.
ما الذي يعجبني في Polygon هو تركيزه على توسيع Ethereum وجعل تطبيقات البلوك تشين أرخص وأسهل للاستخدام. كما أن لدى POL دورًا أوسع داخل النظام البيئي المتطور لـ Polygon، ما يمنح الرمز قصة فائدة أقوى من مجرد المضاربة.
ومع ذلك، ما زلت أضع المخاطر في الاعتبار. إطار 30 دقيقة يمكنه إنتاج العديد من الإشارات الكاذبة، خصوصًا عندما تكون سيولة السوق الإجمالية ضعيفة. كما أن اتجاه البيتكوين يمكنه أن يتغير بسرعة ويؤثر على إعداد الصفقة.
إحدى الدروس التي تعلمتها من تداول هذه التقاطعات: التأكيد أهم من الحماس. أفضل أن أدخل متأخرًا قليلًا مع زخم أقوى بدلًا من مطاردة أول شمعة خضراء.
سأراقب حجم التداول وبنية السعر بعد ذلك.
هل ستأخذ هذا التقاطع الصعودي كدخول مبكر، أم تنتظر التأكيد؟$POL
#USShortTermTreasuryYieldsJump
{spot}(POLUSDT)
يعرض MACD صعودي تقاطعًا على مخطط 30 دقيقة، وأنا أراقب هذا عن كثب.
لقد تعلمت أن هذه الإشارات قصيرة الأجل يمكن أن تكون مفيدة لاكتشاف تحولات الزخم مبكرًا، لكنني لا أعتبر تقاطعًا واحدًا ضمانًا للصفقة أبدًا. في الوقت الحالي، POL عند حوالي 0.10508$، لذلك أبحث عن استمرار الشراء قبل أن أكون عدوانيًا للغاية.
ما الذي يعجبني في Polygon هو تركيزه على توسيع Ethereum وجعل تطبيقات البلوك تشين أرخص وأسهل للاستخدام. كما أن لدى POL دورًا أوسع داخل النظام البيئي المتطور لـ Polygon، ما يمنح الرمز قصة فائدة أقوى من مجرد المضاربة.
ومع ذلك، ما زلت أضع المخاطر في الاعتبار. إطار 30 دقيقة يمكنه إنتاج العديد من الإشارات الكاذبة، خصوصًا عندما تكون سيولة السوق الإجمالية ضعيفة. كما أن اتجاه البيتكوين يمكنه أن يتغير بسرعة ويؤثر على إعداد الصفقة.
إحدى الدروس التي تعلمتها من تداول هذه التقاطعات: التأكيد أهم من الحماس. أفضل أن أدخل متأخرًا قليلًا مع زخم أقوى بدلًا من مطاردة أول شمعة خضراء.
سأراقب حجم التداول وبنية السعر بعد ذلك.
هل ستأخذ هذا التقاطع الصعودي كدخول مبكر، أم تنتظر التأكيد؟$POL
#USShortTermTreasuryYieldsJump
لقد تعلمت أن هذه الإشارات قصيرة الأجل يمكن أن تكون مفيدة لاكتشاف تحولات الزخم مبكرًا، لكنني لا أعتبر تقاطعًا واحدًا ضمانًا للصفقة أبدًا. في الوقت الحالي، POL عند حوالي 0.10508$، لذلك أبحث عن استمرار الشراء قبل أن أكون عدوانيًا للغاية.
ما الذي يعجبني في Polygon هو تركيزه على توسيع Ethereum وجعل تطبيقات البلوك تشين أرخص وأسهل للاستخدام. كما أن لدى POL دورًا أوسع داخل النظام البيئي المتطور لـ Polygon، ما يمنح الرمز قصة فائدة أقوى من مجرد المضاربة.
ومع ذلك، ما زلت أضع المخاطر في الاعتبار. إطار 30 دقيقة يمكنه إنتاج العديد من الإشارات الكاذبة، خصوصًا عندما تكون سيولة السوق الإجمالية ضعيفة. كما أن اتجاه البيتكوين يمكنه أن يتغير بسرعة ويؤثر على إعداد الصفقة.
إحدى الدروس التي تعلمتها من تداول هذه التقاطعات: التأكيد أهم من الحماس. أفضل أن أدخل متأخرًا قليلًا مع زخم أقوى بدلًا من مطاردة أول شمعة خضراء.
سأراقب حجم التداول وبنية السعر بعد ذلك.
هل ستأخذ هذا التقاطع الصعودي كدخول مبكر، أم تنتظر التأكيد؟$POL
#USShortTermTreasuryYieldsJump
144
·
--
بدأت تعود لتلفت انتباهي مرة أخرى. 🔥
أنا أراقب مخطط الـ 30 دقيقة عن كثب لأن مؤشر MACD طبع تقاطعًا صعوديًا للغاية قرب 0.03141. ومن خبرتي، يمكن أن تكون هذه الإشارات مفيدة لاكتشاف تحول في الزخم قصير الأجل، خصوصًا بعد فترة طويلة من الضعف.
الأهم هنا ليس مجرد التقاطع. تُظهر ETH/BTC كيف أداء Ethereum مقارنةً بـ Bitcoin. عندما يبدأ هذا الزوج في الارتفاع، فقد يكون ذلك إشارة إلى أن رأس المال أصبح أكثر ارتياحًا للانتقال باتجاه ETH والسوق الأوسع من العملات البديلة.
أعجبني قوة Ethereum في DeFi والعملات المستقرة (stablecoins) وL2s ونشاط العقود الذكية. لكنني أيضًا حذر. إشارات MACD قد تفشل بسرعة، وقوة BTC يمكن أن تسحب هذا النِّسْب بسهولة إلى الأسفل.
إحدى الدروس التي تعلمتها هي ألا أتداول التقاطع بشكل أعمى أبدًا. أريد تأكيدًا من بنية السعر، والحجم (volume)، والثبات عند مستويات الدعم.
في الوقت الحالي، أنا أراقب 0.03141 عن كثب.
هل تعتقد أن ETH أصبحت أخيرًا جاهزة لتتفوق من جديد على BTC؟$ETH
{spot}(ETHUSDT)
$BTC
{spot}(BTCUSDT)
$SOL
{spot}(SOLUSDT)
بدأت تعود لتلفت انتباهي مرة أخرى. 🔥
أنا أراقب مخطط الـ 30 دقيقة عن كثب لأن مؤشر MACD طبع تقاطعًا صعوديًا للغاية قرب 0.03141. ومن خبرتي، يمكن أن تكون هذه الإشارات مفيدة لاكتشاف تحول في الزخم قصير الأجل، خصوصًا بعد فترة طويلة من الضعف.
الأهم هنا ليس مجرد التقاطع. تُظهر ETH/BTC كيف أداء Ethereum مقارنةً بـ Bitcoin. عندما يبدأ هذا الزوج في الارتفاع، فقد يكون ذلك إشارة إلى أن رأس المال أصبح أكثر ارتياحًا للانتقال باتجاه ETH والسوق الأوسع من العملات البديلة.
أعجبني قوة Ethereum في DeFi والعملات المستقرة (stablecoins) وL2s ونشاط العقود الذكية. لكنني أيضًا حذر. إشارات MACD قد تفشل بسرعة، وقوة BTC يمكن أن تسحب هذا النِّسْب بسهولة إلى الأسفل.
إحدى الدروس التي تعلمتها هي ألا أتداول التقاطع بشكل أعمى أبدًا. أريد تأكيدًا من بنية السعر، والحجم (volume)، والثبات عند مستويات الدعم.
في الوقت الحالي، أنا أراقب 0.03141 عن كثب.
هل تعتقد أن ETH أصبحت أخيرًا جاهزة لتتفوق من جديد على BTC؟$ETH
$BTC
$SOL
أنا أراقب مخطط الـ 30 دقيقة عن كثب لأن مؤشر MACD طبع تقاطعًا صعوديًا للغاية قرب 0.03141. ومن خبرتي، يمكن أن تكون هذه الإشارات مفيدة لاكتشاف تحول في الزخم قصير الأجل، خصوصًا بعد فترة طويلة من الضعف.
الأهم هنا ليس مجرد التقاطع. تُظهر ETH/BTC كيف أداء Ethereum مقارنةً بـ Bitcoin. عندما يبدأ هذا الزوج في الارتفاع، فقد يكون ذلك إشارة إلى أن رأس المال أصبح أكثر ارتياحًا للانتقال باتجاه ETH والسوق الأوسع من العملات البديلة.
أعجبني قوة Ethereum في DeFi والعملات المستقرة (stablecoins) وL2s ونشاط العقود الذكية. لكنني أيضًا حذر. إشارات MACD قد تفشل بسرعة، وقوة BTC يمكن أن تسحب هذا النِّسْب بسهولة إلى الأسفل.
إحدى الدروس التي تعلمتها هي ألا أتداول التقاطع بشكل أعمى أبدًا. أريد تأكيدًا من بنية السعر، والحجم (volume)، والثبات عند مستويات الدعم.
في الوقت الحالي، أنا أراقب 0.03141 عن كثب.
هل تعتقد أن ETH أصبحت أخيرًا جاهزة لتتفوق من جديد على BTC؟$ETH
$BTC
$SOL
127
·
--
: مشاهدة تحوّل زخم الـ4H
أراقب عن كثب بعد أن طبع مؤشر MACD للـ4H تقاطعًا صعوديًا. السعر حول 0.3219$، وبالنسبة لي فهذا أكثر إثارة للاهتمام من مجرد إشارة خضراء بسيطة.
لقد رأيت العديد من تقاطعات MACD تفشل عندما لا تتبعها أحجام تداول، لذلك لا أتعامل مع هذا كاختراق مضمون. أريد أن أرى المشترين يدافعون عن المنطقة الحالية ويبنون قممًا أعلى قبل أن أصبح عدوانيًا أكثر من اللازم.
يمتاز KAITO لأنه يقع ضمن سردية الذكاء الاصطناعي + العملات الرقمية، حيث أصبحت الانتباه والبيانات ونشاط المجتمع موارد قيمة على السلسلة. هذا يمنح المشروع سردية قوية، لكن السردية وحدها لا تكفي. إذ يمكن لعمليات فك الطُلب/الإتاحة، وضغط البيع، وضعف الحجم، وضعف السوق الأوسع أن يفسدوا الإعداد بسرعة.
أكبر درس تعلمته من التداول بهذه الإشارات هو أمر بسيط: الـMACD يخبرني أن الزخم قد يتغير، وليس بالضرورة إلى أين يجب أن يذهب السعر بعد ذلك. أستخدمه كتأكيد إلى جانب البنية وحجم التداول.
أراقب 0.3219$ عن كثب الآن.
هل تعتقد أن KAITO يمكنه تحويل هذا الزخم في الـ4H إلى حركة مستمرة؟$KAITO
{spot}(KAITOUSDT)
$FF
{spot}(FFUSDT)
$AT
{spot}(ATUSDT)
: مشاهدة تحوّل زخم الـ4H
أراقب عن كثب بعد أن طبع مؤشر MACD للـ4H تقاطعًا صعوديًا. السعر حول 0.3219$، وبالنسبة لي فهذا أكثر إثارة للاهتمام من مجرد إشارة خضراء بسيطة.
لقد رأيت العديد من تقاطعات MACD تفشل عندما لا تتبعها أحجام تداول، لذلك لا أتعامل مع هذا كاختراق مضمون. أريد أن أرى المشترين يدافعون عن المنطقة الحالية ويبنون قممًا أعلى قبل أن أصبح عدوانيًا أكثر من اللازم.
يمتاز KAITO لأنه يقع ضمن سردية الذكاء الاصطناعي + العملات الرقمية، حيث أصبحت الانتباه والبيانات ونشاط المجتمع موارد قيمة على السلسلة. هذا يمنح المشروع سردية قوية، لكن السردية وحدها لا تكفي. إذ يمكن لعمليات فك الطُلب/الإتاحة، وضغط البيع، وضعف الحجم، وضعف السوق الأوسع أن يفسدوا الإعداد بسرعة.
أكبر درس تعلمته من التداول بهذه الإشارات هو أمر بسيط: الـMACD يخبرني أن الزخم قد يتغير، وليس بالضرورة إلى أين يجب أن يذهب السعر بعد ذلك. أستخدمه كتأكيد إلى جانب البنية وحجم التداول.
أراقب 0.3219$ عن كثب الآن.
هل تعتقد أن KAITO يمكنه تحويل هذا الزخم في الـ4H إلى حركة مستمرة؟$KAITO
$FF
$AT
أراقب عن كثب بعد أن طبع مؤشر MACD للـ4H تقاطعًا صعوديًا. السعر حول 0.3219$، وبالنسبة لي فهذا أكثر إثارة للاهتمام من مجرد إشارة خضراء بسيطة.
لقد رأيت العديد من تقاطعات MACD تفشل عندما لا تتبعها أحجام تداول، لذلك لا أتعامل مع هذا كاختراق مضمون. أريد أن أرى المشترين يدافعون عن المنطقة الحالية ويبنون قممًا أعلى قبل أن أصبح عدوانيًا أكثر من اللازم.
يمتاز KAITO لأنه يقع ضمن سردية الذكاء الاصطناعي + العملات الرقمية، حيث أصبحت الانتباه والبيانات ونشاط المجتمع موارد قيمة على السلسلة. هذا يمنح المشروع سردية قوية، لكن السردية وحدها لا تكفي. إذ يمكن لعمليات فك الطُلب/الإتاحة، وضغط البيع، وضعف الحجم، وضعف السوق الأوسع أن يفسدوا الإعداد بسرعة.
أكبر درس تعلمته من التداول بهذه الإشارات هو أمر بسيط: الـMACD يخبرني أن الزخم قد يتغير، وليس بالضرورة إلى أين يجب أن يذهب السعر بعد ذلك. أستخدمه كتأكيد إلى جانب البنية وحجم التداول.
أراقب 0.3219$ عن كثب الآن.
هل تعتقد أن KAITO يمكنه تحويل هذا الزخم في الـ4H إلى حركة مستمرة؟$KAITO
$FF
$AT
1
714
·
--
إنها تعطيني إشارة هبوطية على مخطط الـ 30 دقيقة.
لقد حدث تقاطع هبوطي في مؤشر MACD، والسعر حول 164.77 دولار. من تجربتي، لا أعتبر مجرد تقاطع واحد مضمونًا لحدوث هبوط حاد. أتعامل معه كتحذير بأن الزخم بدأ يفقد قوته، خصوصًا بعد حركة قوية.
الذي أراقبه الآن هو كيفية استجابة السعر قرب منطقة الدعم الأخيرة. إذا ظل البائعون مسيطرين وانكسر الدعم، فقد تتراكم ضغوط الهبوط بسرعة. لكن إذا استعاد المشترون الزخم وبدأ MACD بالانعكاس للأعلى، فقد يفشل هذا الإعداد الهبوطي.
إحدى نقاط القوة هنا أن MACD يمكن أن يساعدني على رصد تغيّرات الزخم قبل أن تصبح الحركة واضحة. أما نقطة الضعف فهي أنه على مخططات 30 دقيقة تحدث إشارات كاذبة كثيرًا خلال الأسواق المتذبذبة.
أكبر درس تعلمته من تداول هذه الإعدادات بسيط: أفضل الانتظار حتى تأتي تأكيدات بدلًا من المطاردة وراء أول شمعة بعد حدوث التقاطع.
أنا أراقب الحجم، والدعم، وأشمّة MACD القادمة عن كثب.
هل ستتداول الزخم الهبوطي أم ستنتظر التأكيد؟$SKHYB
{spot}(SKHYBUSDT)
{future}(SKHYUSDT)
إنها تعطيني إشارة هبوطية على مخطط الـ 30 دقيقة.
لقد حدث تقاطع هبوطي في مؤشر MACD، والسعر حول 164.77 دولار. من تجربتي، لا أعتبر مجرد تقاطع واحد مضمونًا لحدوث هبوط حاد. أتعامل معه كتحذير بأن الزخم بدأ يفقد قوته، خصوصًا بعد حركة قوية.
الذي أراقبه الآن هو كيفية استجابة السعر قرب منطقة الدعم الأخيرة. إذا ظل البائعون مسيطرين وانكسر الدعم، فقد تتراكم ضغوط الهبوط بسرعة. لكن إذا استعاد المشترون الزخم وبدأ MACD بالانعكاس للأعلى، فقد يفشل هذا الإعداد الهبوطي.
إحدى نقاط القوة هنا أن MACD يمكن أن يساعدني على رصد تغيّرات الزخم قبل أن تصبح الحركة واضحة. أما نقطة الضعف فهي أنه على مخططات 30 دقيقة تحدث إشارات كاذبة كثيرًا خلال الأسواق المتذبذبة.
أكبر درس تعلمته من تداول هذه الإعدادات بسيط: أفضل الانتظار حتى تأتي تأكيدات بدلًا من المطاردة وراء أول شمعة بعد حدوث التقاطع.
أنا أراقب الحجم، والدعم، وأشمّة MACD القادمة عن كثب.
هل ستتداول الزخم الهبوطي أم ستنتظر التأكيد؟$SKHYB
لقد حدث تقاطع هبوطي في مؤشر MACD، والسعر حول 164.77 دولار. من تجربتي، لا أعتبر مجرد تقاطع واحد مضمونًا لحدوث هبوط حاد. أتعامل معه كتحذير بأن الزخم بدأ يفقد قوته، خصوصًا بعد حركة قوية.
الذي أراقبه الآن هو كيفية استجابة السعر قرب منطقة الدعم الأخيرة. إذا ظل البائعون مسيطرين وانكسر الدعم، فقد تتراكم ضغوط الهبوط بسرعة. لكن إذا استعاد المشترون الزخم وبدأ MACD بالانعكاس للأعلى، فقد يفشل هذا الإعداد الهبوطي.
إحدى نقاط القوة هنا أن MACD يمكن أن يساعدني على رصد تغيّرات الزخم قبل أن تصبح الحركة واضحة. أما نقطة الضعف فهي أنه على مخططات 30 دقيقة تحدث إشارات كاذبة كثيرًا خلال الأسواق المتذبذبة.
أكبر درس تعلمته من تداول هذه الإعدادات بسيط: أفضل الانتظار حتى تأتي تأكيدات بدلًا من المطاردة وراء أول شمعة بعد حدوث التقاطع.
أنا أراقب الحجم، والدعم، وأشمّة MACD القادمة عن كثب.
هل ستتداول الزخم الهبوطي أم ستنتظر التأكيد؟$SKHYB
1
139
·
--
صاعد
عندما تُحاصَر الصفقات القصيرة
أنا أراقب... بعد أن رأيت تصفية صفقات قصيرة بقيمة $1.8329K قرب $0.05957. بالنسبة لي، هذه ليست مجرد مسألة حجم التصفية؛ بل الأهم هو ردّ الفعل عند هذا السعر.
لقد رأيت هذا النمط كثيرًا في الأصول الرقمية الأصغر. عندما تتراكم الصفقات القصيرة بشكل عدواني جدًا، فإن أي تحرّك صعودي بسيط قد يُجبر المراكز على الإغلاق، ما يخلق ضغط شراء إضافي. وهذا قد يجعل الرسم البياني يتحرك بسرعة أكبر مما يتوقعه المتداولون.
ما يعجبني هنا هو الانتباه الذي يمكن أن يجذبه ذلك عندما يزيد التقلب. لكنني أيضًا حذر هنا. قد تكون الرموز الأصغر سيولتها أرقّ، والذيول فيها حادة، والانعكاسات سريعة. وحدث التصفية وحده لا يثبت أن الاتجاه قد تغيّر.
علّمتني تجربتي شيئًا واحدًا: لا ألاحق شمعة لمجرد ظهور تصفيات. أنا أنتظر الحجم وبنية الحركة والتأكيد قبل اتخاذ مركز.
في الوقت الحالي، $0.05957 هو مستوى أراقبه عن كثب. إذا بقي المشترون فوقه، فقد تظل الزخم مثيرًا للاهتمام. وإذا فقده السعر بسرعة، فقد تتحول التصفية ببساطة إلى ذروة مؤقتة.
كيف تقرأ أنت الوضع هنا؟$TUT
{spot}(TUTUSDT)
$TRB
{spot}(TRBUSDT)
$WLD
{spot}(WLDUSDT)
عندما تُحاصَر الصفقات القصيرة
أنا أراقب... بعد أن رأيت تصفية صفقات قصيرة بقيمة $1.8329K قرب $0.05957. بالنسبة لي، هذه ليست مجرد مسألة حجم التصفية؛ بل الأهم هو ردّ الفعل عند هذا السعر.
لقد رأيت هذا النمط كثيرًا في الأصول الرقمية الأصغر. عندما تتراكم الصفقات القصيرة بشكل عدواني جدًا، فإن أي تحرّك صعودي بسيط قد يُجبر المراكز على الإغلاق، ما يخلق ضغط شراء إضافي. وهذا قد يجعل الرسم البياني يتحرك بسرعة أكبر مما يتوقعه المتداولون.
ما يعجبني هنا هو الانتباه الذي يمكن أن يجذبه ذلك عندما يزيد التقلب. لكنني أيضًا حذر هنا. قد تكون الرموز الأصغر سيولتها أرقّ، والذيول فيها حادة، والانعكاسات سريعة. وحدث التصفية وحده لا يثبت أن الاتجاه قد تغيّر.
علّمتني تجربتي شيئًا واحدًا: لا ألاحق شمعة لمجرد ظهور تصفيات. أنا أنتظر الحجم وبنية الحركة والتأكيد قبل اتخاذ مركز.
في الوقت الحالي، $0.05957 هو مستوى أراقبه عن كثب. إذا بقي المشترون فوقه، فقد تظل الزخم مثيرًا للاهتمام. وإذا فقده السعر بسرعة، فقد تتحول التصفية ببساطة إلى ذروة مؤقتة.
كيف تقرأ أنت الوضع هنا؟$TUT
$TRB
$WLD
أنا أراقب... بعد أن رأيت تصفية صفقات قصيرة بقيمة $1.8329K قرب $0.05957. بالنسبة لي، هذه ليست مجرد مسألة حجم التصفية؛ بل الأهم هو ردّ الفعل عند هذا السعر.
لقد رأيت هذا النمط كثيرًا في الأصول الرقمية الأصغر. عندما تتراكم الصفقات القصيرة بشكل عدواني جدًا، فإن أي تحرّك صعودي بسيط قد يُجبر المراكز على الإغلاق، ما يخلق ضغط شراء إضافي. وهذا قد يجعل الرسم البياني يتحرك بسرعة أكبر مما يتوقعه المتداولون.
ما يعجبني هنا هو الانتباه الذي يمكن أن يجذبه ذلك عندما يزيد التقلب. لكنني أيضًا حذر هنا. قد تكون الرموز الأصغر سيولتها أرقّ، والذيول فيها حادة، والانعكاسات سريعة. وحدث التصفية وحده لا يثبت أن الاتجاه قد تغيّر.
علّمتني تجربتي شيئًا واحدًا: لا ألاحق شمعة لمجرد ظهور تصفيات. أنا أنتظر الحجم وبنية الحركة والتأكيد قبل اتخاذ مركز.
في الوقت الحالي، $0.05957 هو مستوى أراقبه عن كثب. إذا بقي المشترون فوقه، فقد تظل الزخم مثيرًا للاهتمام. وإذا فقده السعر بسرعة، فقد تتحول التصفية ببساطة إلى ذروة مؤقتة.
كيف تقرأ أنت الوضع هنا؟$TUT
$TRB
$WLD
265
·
--
#dusk @Dusk_Foundation $DUSK #dusk @Dusk_Foundation
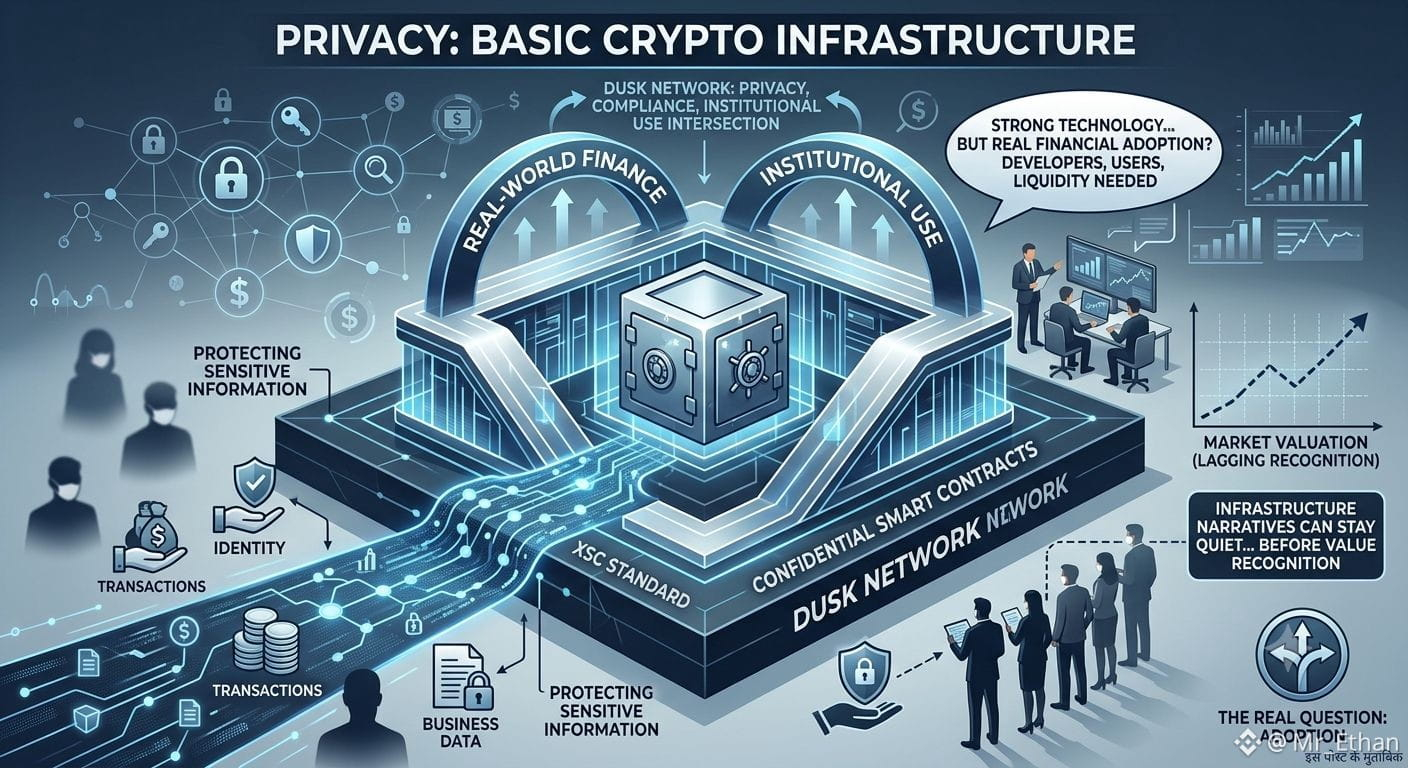
الخصوصية في العملات المشفرة بدأت تبدو أقل كأنها رفاهية وأكثر كبنية تحتية أساسية.
لقد شاهدت العديد من مشاريع الخصوصية تحظى باهتمام خلال دورات الضجيج، لكن ما يميز شبكة Dusk بالنسبة لي أنها تركز على التطبيقات المالية، وليس فقط على المعاملات الخاصة.
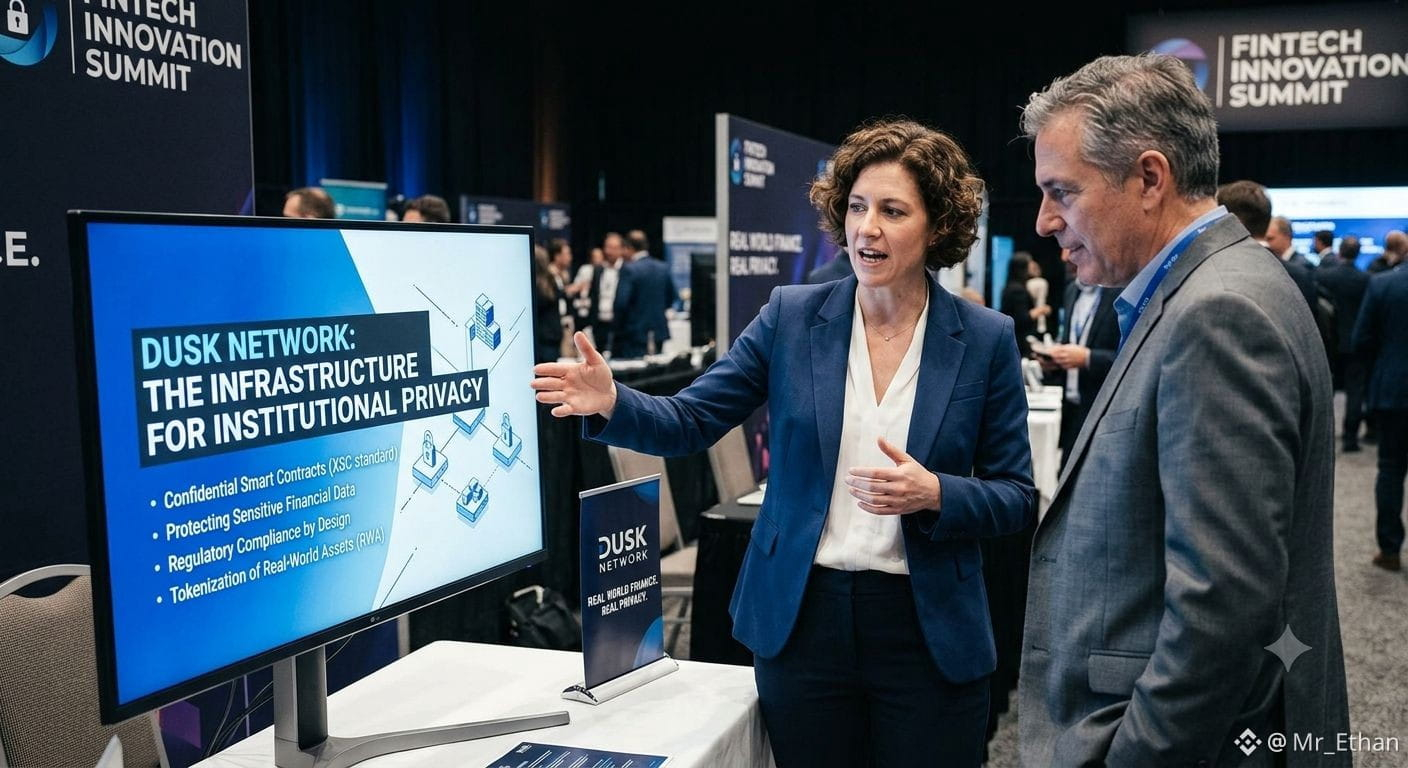
Dusk هي شبكة طبقة أولى (Layer-1) مبنية حول العقود الذكية السرّية ومعيار عقد الأمان السرّي (XSC). وبعبارات بسيطة، تهدف إلى تمكين المؤسسات المالية من استخدام البلوك تشين مع الحفاظ على حماية المعلومات الحساسة.
هذه فكرة قوية. التمويل في العالم الحقيقي يحتاج إلى الخصوصية حول الهويات والمعاملات وبيانات الأعمال. تحاول Dusk معالجة ذلك دون التخلي عن مزايا بنية بلوك تشين قابلة للبرمجة.
لكنني لست متحمسًا دون تروٍّ. أكبر سؤال هو مسألة التبني. فالشبكات الأخرى التي تركز على الخصوصية والامتثال تتحسن أيضًا، والتكنولوجيا القوية لا تعني الكثير دون المطورين والمستخدمين والسيولة والنشاط التجاري الحقيقي.
ومن الدروس التي تعلمتها من عالم العملات المشفرة أن روايات البنية التحتية قد تظل هادئة لفترة طويلة قبل أن يتعرف السوق على قيمتها.
بالنسبة لي، Dusk مثيرة للاهتمام لأنها تقع عند تقاطع الخصوصية والامتثال واستخدام البلوك تشين على مستوى المؤسسات.
السؤال الحقيقي هو: هل يمكن لـ Dusk تحويل التكنولوجيا القوية إلى تبنٍ مالي حقيقي؟
{spot}(DUSKUSDT)
$BMT
{spot}(BMTUSDT)
$PORTAL
{spot}(PORTALUSDT)
#dusk @Dusk $DUSK #dusk @Dusk
الخصوصية في العملات المشفرة بدأت تبدو أقل كأنها رفاهية وأكثر كبنية تحتية أساسية.
لقد شاهدت العديد من مشاريع الخصوصية تحظى باهتمام خلال دورات الضجيج، لكن ما يميز شبكة Dusk بالنسبة لي أنها تركز على التطبيقات المالية، وليس فقط على المعاملات الخاصة.
Dusk هي شبكة طبقة أولى (Layer-1) مبنية حول العقود الذكية السرّية ومعيار عقد الأمان السرّي (XSC). وبعبارات بسيطة، تهدف إلى تمكين المؤسسات المالية من استخدام البلوك تشين مع الحفاظ على حماية المعلومات الحساسة.
هذه فكرة قوية. التمويل في العالم الحقيقي يحتاج إلى الخصوصية حول الهويات والمعاملات وبيانات الأعمال. تحاول Dusk معالجة ذلك دون التخلي عن مزايا بنية بلوك تشين قابلة للبرمجة.
لكنني لست متحمسًا دون تروٍّ. أكبر سؤال هو مسألة التبني. فالشبكات الأخرى التي تركز على الخصوصية والامتثال تتحسن أيضًا، والتكنولوجيا القوية لا تعني الكثير دون المطورين والمستخدمين والسيولة والنشاط التجاري الحقيقي.
ومن الدروس التي تعلمتها من عالم العملات المشفرة أن روايات البنية التحتية قد تظل هادئة لفترة طويلة قبل أن يتعرف السوق على قيمتها.
بالنسبة لي، Dusk مثيرة للاهتمام لأنها تقع عند تقاطع الخصوصية والامتثال واستخدام البلوك تشين على مستوى المؤسسات.
السؤال الحقيقي هو: هل يمكن لـ Dusk تحويل التكنولوجيا القوية إلى تبنٍ مالي حقيقي؟
$BMT
$PORTAL
الخصوصية في العملات المشفرة بدأت تبدو أقل كأنها رفاهية وأكثر كبنية تحتية أساسية.
لقد شاهدت العديد من مشاريع الخصوصية تحظى باهتمام خلال دورات الضجيج، لكن ما يميز شبكة Dusk بالنسبة لي أنها تركز على التطبيقات المالية، وليس فقط على المعاملات الخاصة.
Dusk هي شبكة طبقة أولى (Layer-1) مبنية حول العقود الذكية السرّية ومعيار عقد الأمان السرّي (XSC). وبعبارات بسيطة، تهدف إلى تمكين المؤسسات المالية من استخدام البلوك تشين مع الحفاظ على حماية المعلومات الحساسة.
هذه فكرة قوية. التمويل في العالم الحقيقي يحتاج إلى الخصوصية حول الهويات والمعاملات وبيانات الأعمال. تحاول Dusk معالجة ذلك دون التخلي عن مزايا بنية بلوك تشين قابلة للبرمجة.
لكنني لست متحمسًا دون تروٍّ. أكبر سؤال هو مسألة التبني. فالشبكات الأخرى التي تركز على الخصوصية والامتثال تتحسن أيضًا، والتكنولوجيا القوية لا تعني الكثير دون المطورين والمستخدمين والسيولة والنشاط التجاري الحقيقي.
ومن الدروس التي تعلمتها من عالم العملات المشفرة أن روايات البنية التحتية قد تظل هادئة لفترة طويلة قبل أن يتعرف السوق على قيمتها.
بالنسبة لي، Dusk مثيرة للاهتمام لأنها تقع عند تقاطع الخصوصية والامتثال واستخدام البلوك تشين على مستوى المؤسسات.
السؤال الحقيقي هو: هل يمكن لـ Dusk تحويل التكنولوجيا القوية إلى تبنٍ مالي حقيقي؟
$BMT
$PORTAL
4
3
129
·
--
لفت انتباهي لأنه غالبًا ما تكون بيانات التصفية أكثر إفادة من مجرد حركة سعر بسيطة.
لقد تعلمت أنه عندما يتم تصفية المراكز القصيرة، فقد يؤدي ذلك إلى ضغط شراء سريع، لكنني لا أعتبر ذلك إشارة تلقائية للمطاردة. بالنسبة لي، السؤال الحقيقي هو ما إذا كان بإمكان LAB الحفاظ على الحركة بعد زوال المراكز القسرية.
ما يعجبني هو الفرصة التي تخلقها التقلبات. يمكن للزخم القوي أن يجذب المتداولين والسيولة والاهتمام الجديد بسرعة كبيرة. لكن الضعف واضح أيضًا: يمكن أن تتحرك العملات الأصغر بشكل حاد في كلا الاتجاهين، ويمكن أن تؤدي السيولة الرقيقة إلى تحويل إعداد جيد إلى دخول سيئ.
أنا أراقب الدعم عن كثب وأبحث عن تأكيد من خلال الحجم وبنية السعر. إذا حافظت LAB على القمم/القيعان الأعلى بعد هذه الحركة، فسأأخذ ذلك بجدية أكبر من مجرد اندفاعة مفاجئة.
أكبر درس تعلمته من عالم العملات الرقمية بسيط: التصفية معلومات، وليست تأكيدًا. أفضل أن أفوت جزءًا من الحركة بدلًا من الدخول بشكل أعمى بعد أي ضغطات.
سأبقي LAB ضمن قائمة المراقبة لدي وأنتظر أن يُظهر السوق ما لديه.
هل ستتداول الزخم هنا، أم ستنتظر إعدادًا أنظف؟
$LAB
{future}(LABUSDT)
$MMT
{spot}(MMTUSDT)
$RE
{spot}(REUSDT)
لفت انتباهي لأنه غالبًا ما تكون بيانات التصفية أكثر إفادة من مجرد حركة سعر بسيطة.
لقد تعلمت أنه عندما يتم تصفية المراكز القصيرة، فقد يؤدي ذلك إلى ضغط شراء سريع، لكنني لا أعتبر ذلك إشارة تلقائية للمطاردة. بالنسبة لي، السؤال الحقيقي هو ما إذا كان بإمكان LAB الحفاظ على الحركة بعد زوال المراكز القسرية.
ما يعجبني هو الفرصة التي تخلقها التقلبات. يمكن للزخم القوي أن يجذب المتداولين والسيولة والاهتمام الجديد بسرعة كبيرة. لكن الضعف واضح أيضًا: يمكن أن تتحرك العملات الأصغر بشكل حاد في كلا الاتجاهين، ويمكن أن تؤدي السيولة الرقيقة إلى تحويل إعداد جيد إلى دخول سيئ.
أنا أراقب الدعم عن كثب وأبحث عن تأكيد من خلال الحجم وبنية السعر. إذا حافظت LAB على القمم/القيعان الأعلى بعد هذه الحركة، فسأأخذ ذلك بجدية أكبر من مجرد اندفاعة مفاجئة.
أكبر درس تعلمته من عالم العملات الرقمية بسيط: التصفية معلومات، وليست تأكيدًا. أفضل أن أفوت جزءًا من الحركة بدلًا من الدخول بشكل أعمى بعد أي ضغطات.
سأبقي LAB ضمن قائمة المراقبة لدي وأنتظر أن يُظهر السوق ما لديه.
هل ستتداول الزخم هنا، أم ستنتظر إعدادًا أنظف؟
$LAB
$MMT
$RE
لقد تعلمت أنه عندما يتم تصفية المراكز القصيرة، فقد يؤدي ذلك إلى ضغط شراء سريع، لكنني لا أعتبر ذلك إشارة تلقائية للمطاردة. بالنسبة لي، السؤال الحقيقي هو ما إذا كان بإمكان LAB الحفاظ على الحركة بعد زوال المراكز القسرية.
ما يعجبني هو الفرصة التي تخلقها التقلبات. يمكن للزخم القوي أن يجذب المتداولين والسيولة والاهتمام الجديد بسرعة كبيرة. لكن الضعف واضح أيضًا: يمكن أن تتحرك العملات الأصغر بشكل حاد في كلا الاتجاهين، ويمكن أن تؤدي السيولة الرقيقة إلى تحويل إعداد جيد إلى دخول سيئ.
أنا أراقب الدعم عن كثب وأبحث عن تأكيد من خلال الحجم وبنية السعر. إذا حافظت LAB على القمم/القيعان الأعلى بعد هذه الحركة، فسأأخذ ذلك بجدية أكبر من مجرد اندفاعة مفاجئة.
أكبر درس تعلمته من عالم العملات الرقمية بسيط: التصفية معلومات، وليست تأكيدًا. أفضل أن أفوت جزءًا من الحركة بدلًا من الدخول بشكل أعمى بعد أي ضغطات.
سأبقي LAB ضمن قائمة المراقبة لدي وأنتظر أن يُظهر السوق ما لديه.
هل ستتداول الزخم هنا، أم ستنتظر إعدادًا أنظف؟
$LAB
$MMT
$RE
1
476
·
--
صاعد
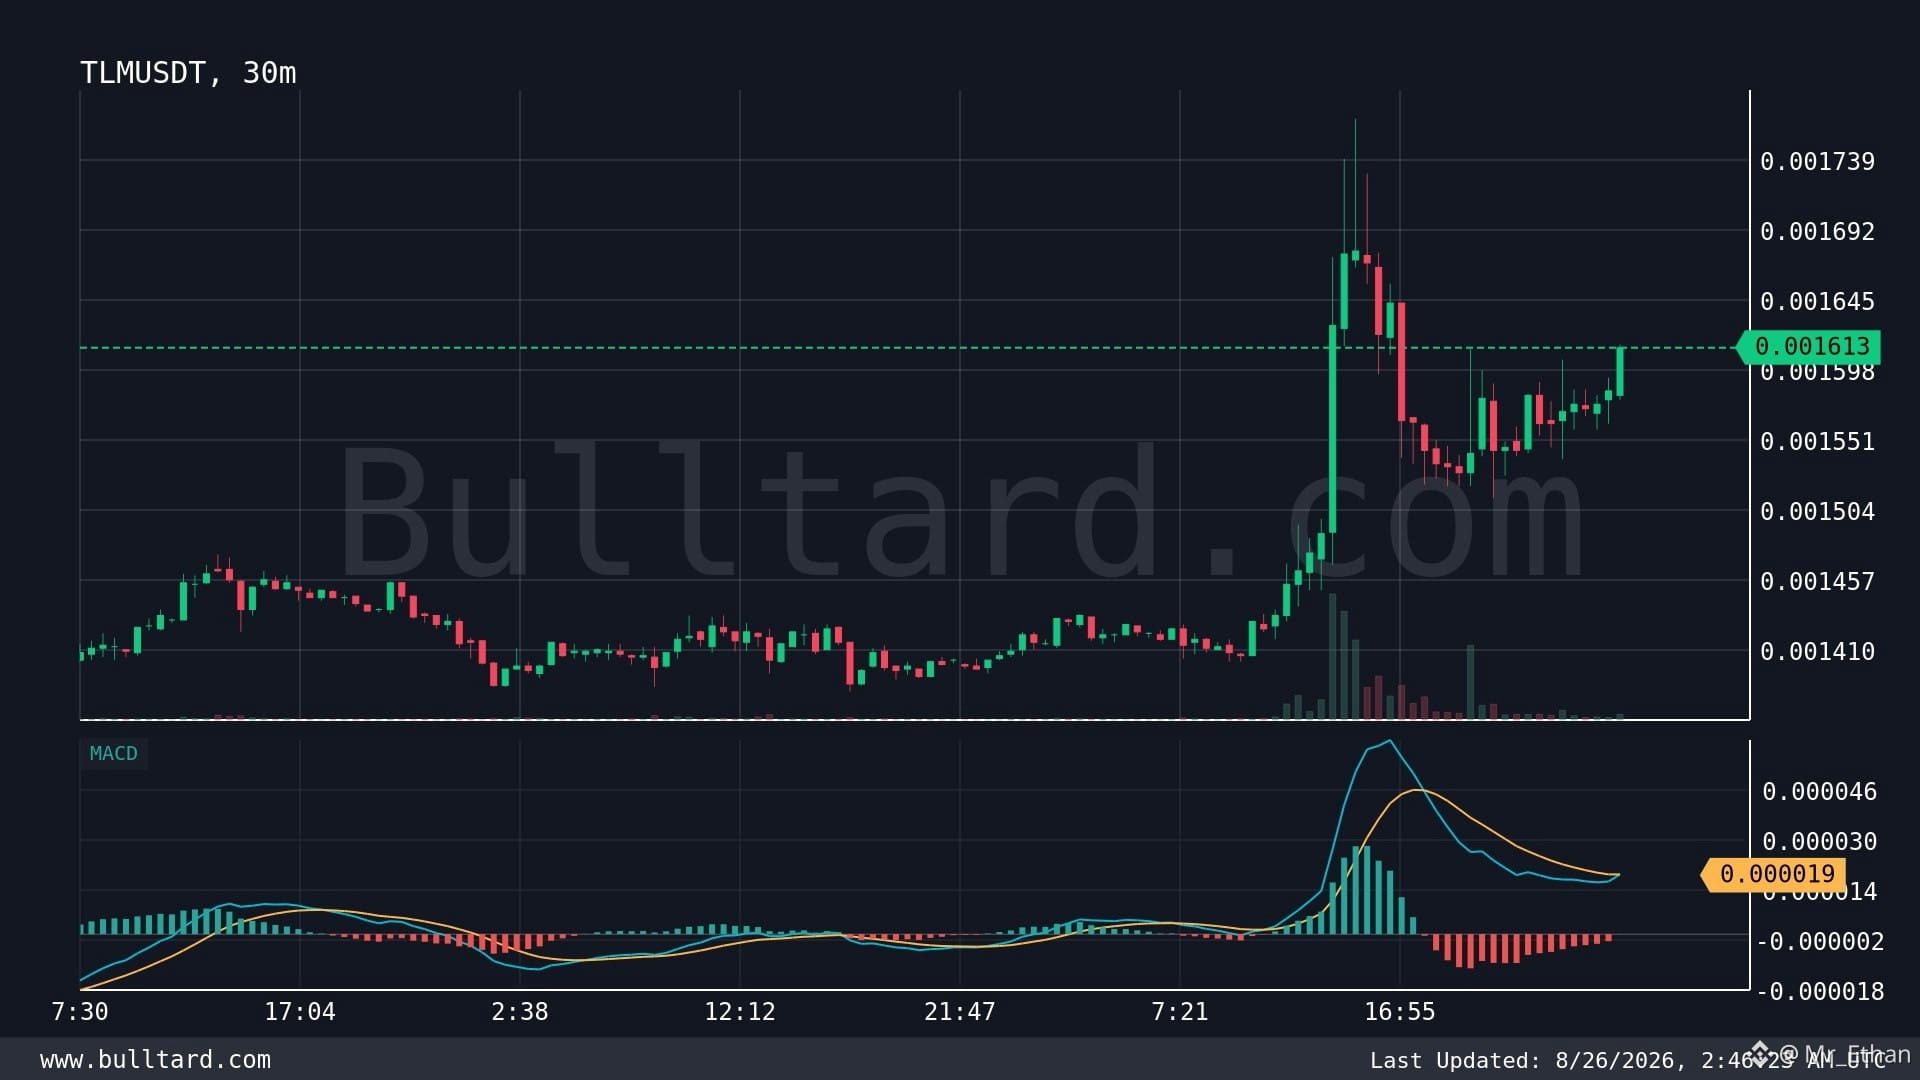
يُظهر تحوّلاً بسيطًا في الزخم، وأنا أراقبه عن كثب.
قام مؤشر 30m MACD للتو بطباعة تقاطع صعودي عند حوالي $0.001613. من تجربتي، لا أتعامل مع التقاطع وحده كإشارة شراء. أريد أن أرى استمرارًا في حركة السعر، وتحسّنًا في أحجام التداول، وأن تبقى الشموع القادمة فوق منطقة الاختراق.
يُعدّ TLM دائمًا رمزًا مثيرًا للاهتمام في مجال ألعاب Web3، لأن Alien Worlds تركز على الاقتصادات الافتراضية ونشاط اللاعبين وملكية الأصول على السلسلة. وهذا يمنحه منفعة أكبر من مجرد توكن مدفوع بالمضاربة فقط. ومع ذلك، يمكن أن تكون توكنات الألعاب شديدة التقلب، وقد يختفي السيولة بسرعة عندما تضعف معنويات السوق.
بالنسبة لي، تتمثل نقطة القوة الأساسية هنا في الزخم إلى جانب منفعة النظام البيئي. أما نقطة الضعف فهي أن إشارات MACD يمكن أن تتحول بسهولة إلى إشارات كاذبة خلال الأسواق الجانبية.
لقد تعلمت أن أفضل الصفقات عادةً تأتي من التأكيد، وليس من التوقع المبكر. إذا حافظ TLM على مستوى أعلى من $0.00160 ودخل المشترون بقوة، فسيصبح اهتمامي بالاتجاه الصعودي أكبر.
لدي فضول: هل ترى هذا التقاطع في MACD بدايةً لحركة أقوى لـ TLM، أم مجرد ارتداد آخر قصير الأجل؟
$BMT
{spot}(BMTUSDT)
$BTR
{future}(BTRUSDT)
$TLM
{spot}(TLMUSDT)
يُظهر تحوّلاً بسيطًا في الزخم، وأنا أراقبه عن كثب.
قام مؤشر 30m MACD للتو بطباعة تقاطع صعودي عند حوالي $0.001613. من تجربتي، لا أتعامل مع التقاطع وحده كإشارة شراء. أريد أن أرى استمرارًا في حركة السعر، وتحسّنًا في أحجام التداول، وأن تبقى الشموع القادمة فوق منطقة الاختراق.
يُعدّ TLM دائمًا رمزًا مثيرًا للاهتمام في مجال ألعاب Web3، لأن Alien Worlds تركز على الاقتصادات الافتراضية ونشاط اللاعبين وملكية الأصول على السلسلة. وهذا يمنحه منفعة أكبر من مجرد توكن مدفوع بالمضاربة فقط. ومع ذلك، يمكن أن تكون توكنات الألعاب شديدة التقلب، وقد يختفي السيولة بسرعة عندما تضعف معنويات السوق.
بالنسبة لي، تتمثل نقطة القوة الأساسية هنا في الزخم إلى جانب منفعة النظام البيئي. أما نقطة الضعف فهي أن إشارات MACD يمكن أن تتحول بسهولة إلى إشارات كاذبة خلال الأسواق الجانبية.
لقد تعلمت أن أفضل الصفقات عادةً تأتي من التأكيد، وليس من التوقع المبكر. إذا حافظ TLM على مستوى أعلى من $0.00160 ودخل المشترون بقوة، فسيصبح اهتمامي بالاتجاه الصعودي أكبر.
لدي فضول: هل ترى هذا التقاطع في MACD بدايةً لحركة أقوى لـ TLM، أم مجرد ارتداد آخر قصير الأجل؟
$BMT
$BTR
$TLM
قام مؤشر 30m MACD للتو بطباعة تقاطع صعودي عند حوالي $0.001613. من تجربتي، لا أتعامل مع التقاطع وحده كإشارة شراء. أريد أن أرى استمرارًا في حركة السعر، وتحسّنًا في أحجام التداول، وأن تبقى الشموع القادمة فوق منطقة الاختراق.
يُعدّ TLM دائمًا رمزًا مثيرًا للاهتمام في مجال ألعاب Web3، لأن Alien Worlds تركز على الاقتصادات الافتراضية ونشاط اللاعبين وملكية الأصول على السلسلة. وهذا يمنحه منفعة أكبر من مجرد توكن مدفوع بالمضاربة فقط. ومع ذلك، يمكن أن تكون توكنات الألعاب شديدة التقلب، وقد يختفي السيولة بسرعة عندما تضعف معنويات السوق.
بالنسبة لي، تتمثل نقطة القوة الأساسية هنا في الزخم إلى جانب منفعة النظام البيئي. أما نقطة الضعف فهي أن إشارات MACD يمكن أن تتحول بسهولة إلى إشارات كاذبة خلال الأسواق الجانبية.
لقد تعلمت أن أفضل الصفقات عادةً تأتي من التأكيد، وليس من التوقع المبكر. إذا حافظ TLM على مستوى أعلى من $0.00160 ودخل المشترون بقوة، فسيصبح اهتمامي بالاتجاه الصعودي أكبر.
لدي فضول: هل ترى هذا التقاطع في MACD بدايةً لحركة أقوى لـ TLM، أم مجرد ارتداد آخر قصير الأجل؟
$BMT
$BTR
$TLM
303
·
--
هابط
يُعدّ الغروب (Dusk) أحد تلك المشاريع التي أواصل متابعتها لأن الخصوصية أصبحت ببطء جزءًا أكبر من محادثات البلوكشين.
لقد رأيت العديد من روايات الخصوصية تأتي وتذهب، لكن شبكة Dusk تبدو أكثر تركيزًا على مشكلة حقيقية: إدخال المعاملات السرّية والعقود الذكية إلى الأسواق المالية. يتم بناء الطبقة الأولى الخاصة بها حول معيار عقد الأمان السرّي (XSC)، ما يمنح التطبيقات طريقة للعمل مع البيانات الحساسة دون كشف كل شيء علنًا.
ما يعجبني أكثر هو الجانب المالي. تحتاج المؤسسات إلى الخصوصية والامتثال وإمكانية الوصول المتحكم بالبيانات. تحاول Dusk دمج هذه الاحتياجات مع بنية تحتية لسلسلة الكتل.
لكنني لا أتجاهل المخاطر. ما زالت مسألة التبنّي هي أكبر سؤال. تعني التكنولوجيا القوية القليل إن لم يقم المطورون والمؤسسات والمستخدمون بالفعل بالبناء عليها. كما تُعد المنافسة من سلاسل أخرى تركز على الخصوصية تحديًا إضافيًا.
أكبر درس تعلمته من عالم العملات المشفرة بسيط: لا أستثمر فقط لأن الرواية تبدو جيدة. أتابع الاستخدام والسيولة والتطوير وسلوك السوق.
بالنسبة لي، تعتبر DUSK مثيرة للاهتمام لأن الخصوصية قد تصبح بنية تحتية، لا مجرد رواية للتداول.
هل تعتقد أن بنية تحتية بلوكشين سرّية ستصبح ضرورية للموجة التالية من تبنّي القطاع المالي؟
$TAC $PROM $DUSK
#dusk @Dusk_Foundation
{future}(TUTUSDT)
{future}(PROMUSDT)
{future}(TACUSDT)
يُعدّ الغروب (Dusk) أحد تلك المشاريع التي أواصل متابعتها لأن الخصوصية أصبحت ببطء جزءًا أكبر من محادثات البلوكشين.
لقد رأيت العديد من روايات الخصوصية تأتي وتذهب، لكن شبكة Dusk تبدو أكثر تركيزًا على مشكلة حقيقية: إدخال المعاملات السرّية والعقود الذكية إلى الأسواق المالية. يتم بناء الطبقة الأولى الخاصة بها حول معيار عقد الأمان السرّي (XSC)، ما يمنح التطبيقات طريقة للعمل مع البيانات الحساسة دون كشف كل شيء علنًا.
ما يعجبني أكثر هو الجانب المالي. تحتاج المؤسسات إلى الخصوصية والامتثال وإمكانية الوصول المتحكم بالبيانات. تحاول Dusk دمج هذه الاحتياجات مع بنية تحتية لسلسلة الكتل.
لكنني لا أتجاهل المخاطر. ما زالت مسألة التبنّي هي أكبر سؤال. تعني التكنولوجيا القوية القليل إن لم يقم المطورون والمؤسسات والمستخدمون بالفعل بالبناء عليها. كما تُعد المنافسة من سلاسل أخرى تركز على الخصوصية تحديًا إضافيًا.
أكبر درس تعلمته من عالم العملات المشفرة بسيط: لا أستثمر فقط لأن الرواية تبدو جيدة. أتابع الاستخدام والسيولة والتطوير وسلوك السوق.
بالنسبة لي، تعتبر DUSK مثيرة للاهتمام لأن الخصوصية قد تصبح بنية تحتية، لا مجرد رواية للتداول.
هل تعتقد أن بنية تحتية بلوكشين سرّية ستصبح ضرورية للموجة التالية من تبنّي القطاع المالي؟
$TAC $PROM $DUSK
#dusk @Dusk
لقد رأيت العديد من روايات الخصوصية تأتي وتذهب، لكن شبكة Dusk تبدو أكثر تركيزًا على مشكلة حقيقية: إدخال المعاملات السرّية والعقود الذكية إلى الأسواق المالية. يتم بناء الطبقة الأولى الخاصة بها حول معيار عقد الأمان السرّي (XSC)، ما يمنح التطبيقات طريقة للعمل مع البيانات الحساسة دون كشف كل شيء علنًا.
ما يعجبني أكثر هو الجانب المالي. تحتاج المؤسسات إلى الخصوصية والامتثال وإمكانية الوصول المتحكم بالبيانات. تحاول Dusk دمج هذه الاحتياجات مع بنية تحتية لسلسلة الكتل.
لكنني لا أتجاهل المخاطر. ما زالت مسألة التبنّي هي أكبر سؤال. تعني التكنولوجيا القوية القليل إن لم يقم المطورون والمؤسسات والمستخدمون بالفعل بالبناء عليها. كما تُعد المنافسة من سلاسل أخرى تركز على الخصوصية تحديًا إضافيًا.
أكبر درس تعلمته من عالم العملات المشفرة بسيط: لا أستثمر فقط لأن الرواية تبدو جيدة. أتابع الاستخدام والسيولة والتطوير وسلوك السوق.
بالنسبة لي، تعتبر DUSK مثيرة للاهتمام لأن الخصوصية قد تصبح بنية تحتية، لا مجرد رواية للتداول.
هل تعتقد أن بنية تحتية بلوكشين سرّية ستصبح ضرورية للموجة التالية من تبنّي القطاع المالي؟
$TAC $PROM $DUSK
#dusk @Dusk
✅ $TAC
100%
👆 $PROM
0%
💚 $LAB
0%
2 الأصوات • تمّ إغلاق التصويت
132
·
--
صاعد
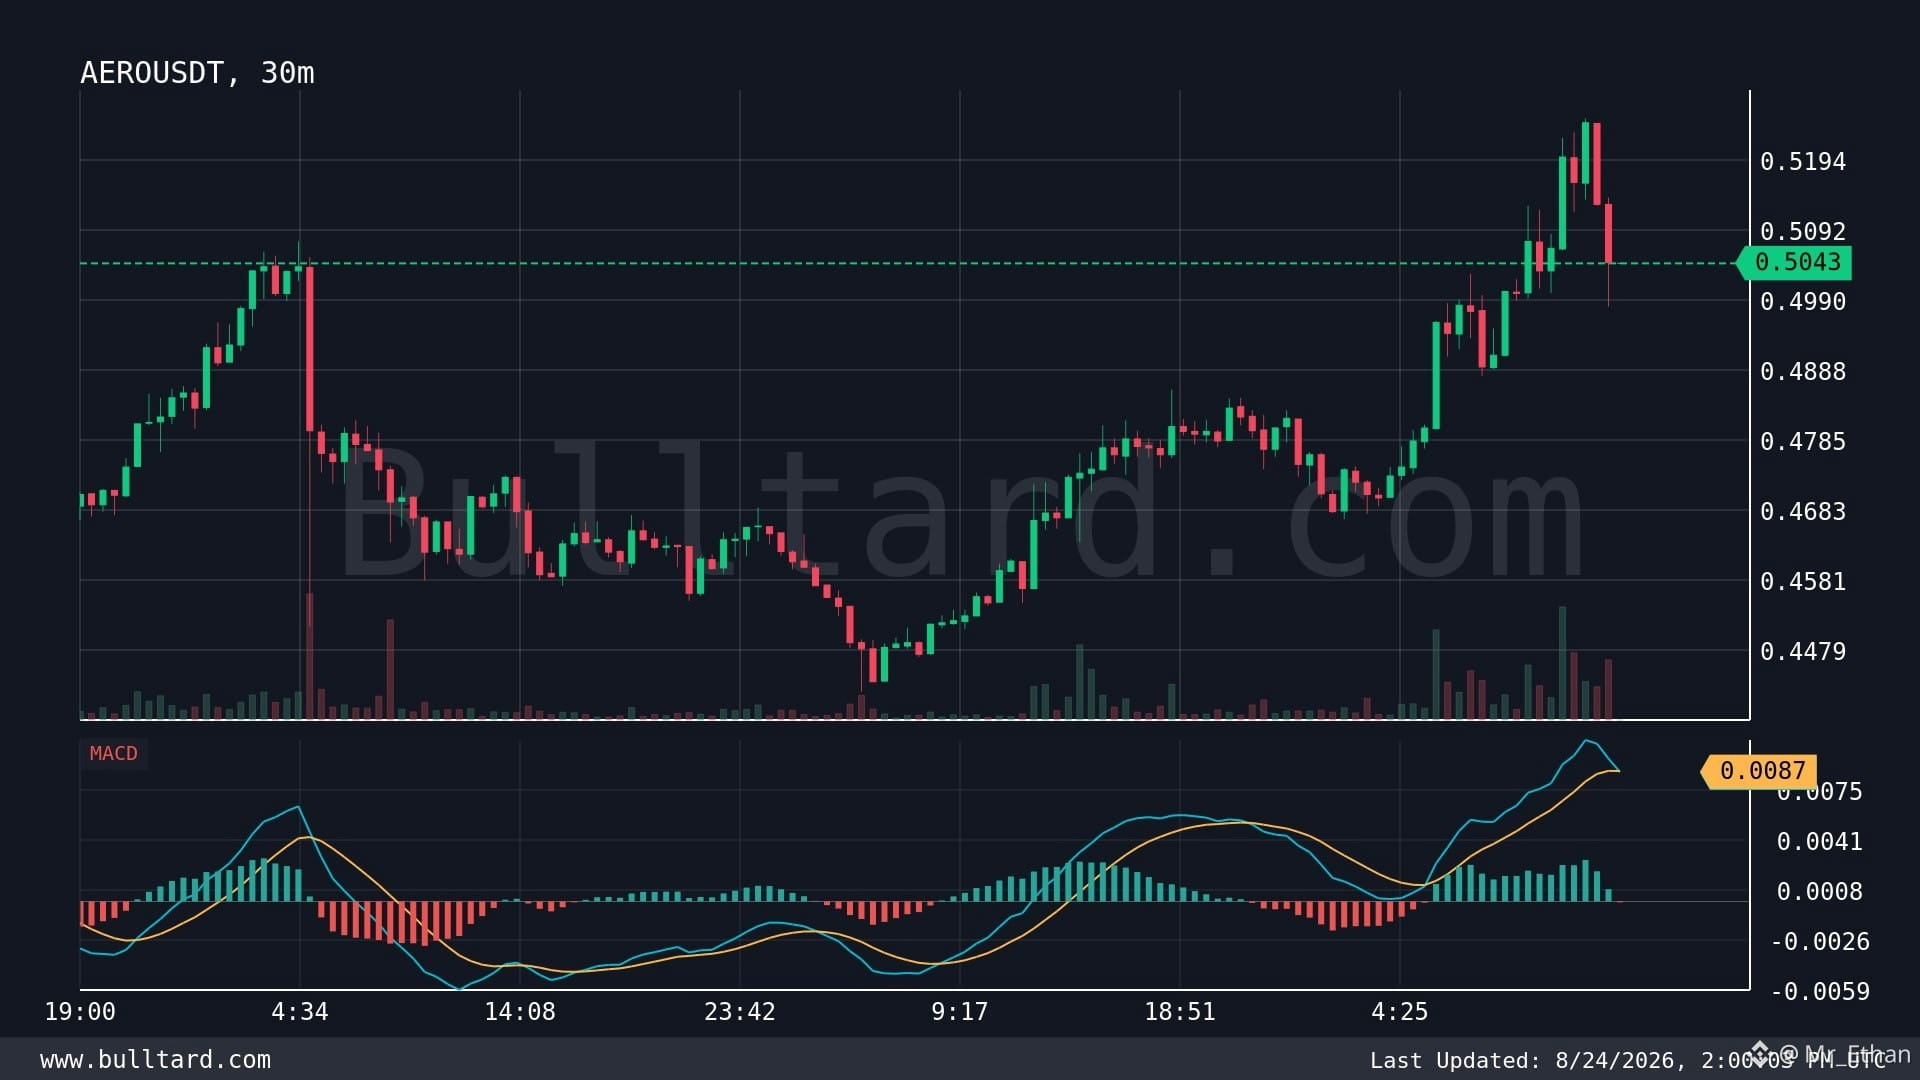
يُظهر لي لماذا لا تزال المشاريع القوية بحاجة إلى إدخالات مدروسة.
لقد كنت أتابع Aerodrome عن كثب، وأعجبني ما يقدمه إلى نظام Base البيئي. ليس مجرد توكن آخر. بُني Aerodrome حول التداول والسيولة، ويساعد المستخدمين على المبادلة بين الأصول بينما يحصل مزودو السيولة على حوافز.
ما يعجبني أكثر هو ارتباطه بـ Base والطلب المتزايد على السيولة داخل السلسلة. مقارنةً بالعديد من توكنات DEX الأصغر، <f-1/> لديه دور أوضح داخل نظام بيئي نشط. وهذا يمنحه قصة أساسيات أقوى برأيي.
لكنني لا أتجاهل المخاطر. المنافسة في DeFi شديدة، ويمكن أن تؤدي الانبعاثات المأمونية إلى ضغط بيع، و<f-2/> ما يزال بإمكانه التحرك بقوة مع معنويات السوق الأوسع. عندما تجف السيولة، حتى الإعدادات الجيدة قد تفشل بسرعة.
لقد تعلمت من التداول عبر هذه الدورات أن الأساسيات مهمة، لكن التوقيت مهم أيضًا. يمكن لمشروع قوي تم شراؤه في اللحظة الخطأ أن يضر المحفظة مع ذلك.
أنا أراقب الزخم والسيولة ونشاط المستخدمين بدل المطاردة وراء كل شمعة خضراء.
هل ستحتفظ بنمو النظام البيئي، أم تنتظر دخولًا أفضل؟
$AERO #aero @aero
{spot}(AEROUSDT)
$TUT
{spot}(TUTUSDT)
$TURTLE
{spot}(TURTLEUSDT)
يُظهر لي لماذا لا تزال المشاريع القوية بحاجة إلى إدخالات مدروسة.
لقد كنت أتابع Aerodrome عن كثب، وأعجبني ما يقدمه إلى نظام Base البيئي. ليس مجرد توكن آخر. بُني Aerodrome حول التداول والسيولة، ويساعد المستخدمين على المبادلة بين الأصول بينما يحصل مزودو السيولة على حوافز.
ما يعجبني أكثر هو ارتباطه بـ Base والطلب المتزايد على السيولة داخل السلسلة. مقارنةً بالعديد من توكنات DEX الأصغر، <f-1/> لديه دور أوضح داخل نظام بيئي نشط. وهذا يمنحه قصة أساسيات أقوى برأيي.
لكنني لا أتجاهل المخاطر. المنافسة في DeFi شديدة، ويمكن أن تؤدي الانبعاثات المأمونية إلى ضغط بيع، و<f-2/> ما يزال بإمكانه التحرك بقوة مع معنويات السوق الأوسع. عندما تجف السيولة، حتى الإعدادات الجيدة قد تفشل بسرعة.
لقد تعلمت من التداول عبر هذه الدورات أن الأساسيات مهمة، لكن التوقيت مهم أيضًا. يمكن لمشروع قوي تم شراؤه في اللحظة الخطأ أن يضر المحفظة مع ذلك.
أنا أراقب الزخم والسيولة ونشاط المستخدمين بدل المطاردة وراء كل شمعة خضراء.
هل ستحتفظ بنمو النظام البيئي، أم تنتظر دخولًا أفضل؟
$AERO #aero @Aero
$TUT
$TURTLE
لقد كنت أتابع Aerodrome عن كثب، وأعجبني ما يقدمه إلى نظام Base البيئي. ليس مجرد توكن آخر. بُني Aerodrome حول التداول والسيولة، ويساعد المستخدمين على المبادلة بين الأصول بينما يحصل مزودو السيولة على حوافز.
ما يعجبني أكثر هو ارتباطه بـ Base والطلب المتزايد على السيولة داخل السلسلة. مقارنةً بالعديد من توكنات DEX الأصغر، <f-1/> لديه دور أوضح داخل نظام بيئي نشط. وهذا يمنحه قصة أساسيات أقوى برأيي.
لكنني لا أتجاهل المخاطر. المنافسة في DeFi شديدة، ويمكن أن تؤدي الانبعاثات المأمونية إلى ضغط بيع، و<f-2/> ما يزال بإمكانه التحرك بقوة مع معنويات السوق الأوسع. عندما تجف السيولة، حتى الإعدادات الجيدة قد تفشل بسرعة.
لقد تعلمت من التداول عبر هذه الدورات أن الأساسيات مهمة، لكن التوقيت مهم أيضًا. يمكن لمشروع قوي تم شراؤه في اللحظة الخطأ أن يضر المحفظة مع ذلك.
أنا أراقب الزخم والسيولة ونشاط المستخدمين بدل المطاردة وراء كل شمعة خضراء.
هل ستحتفظ بنمو النظام البيئي، أم تنتظر دخولًا أفضل؟
$AERO #aero @Aero
$TUT
$TURTLE
292
·
--
هابط
يظهر تقاطع هابط للـ MACD على مخطط الـ 30 دقيقة، وأنا أراقبه.
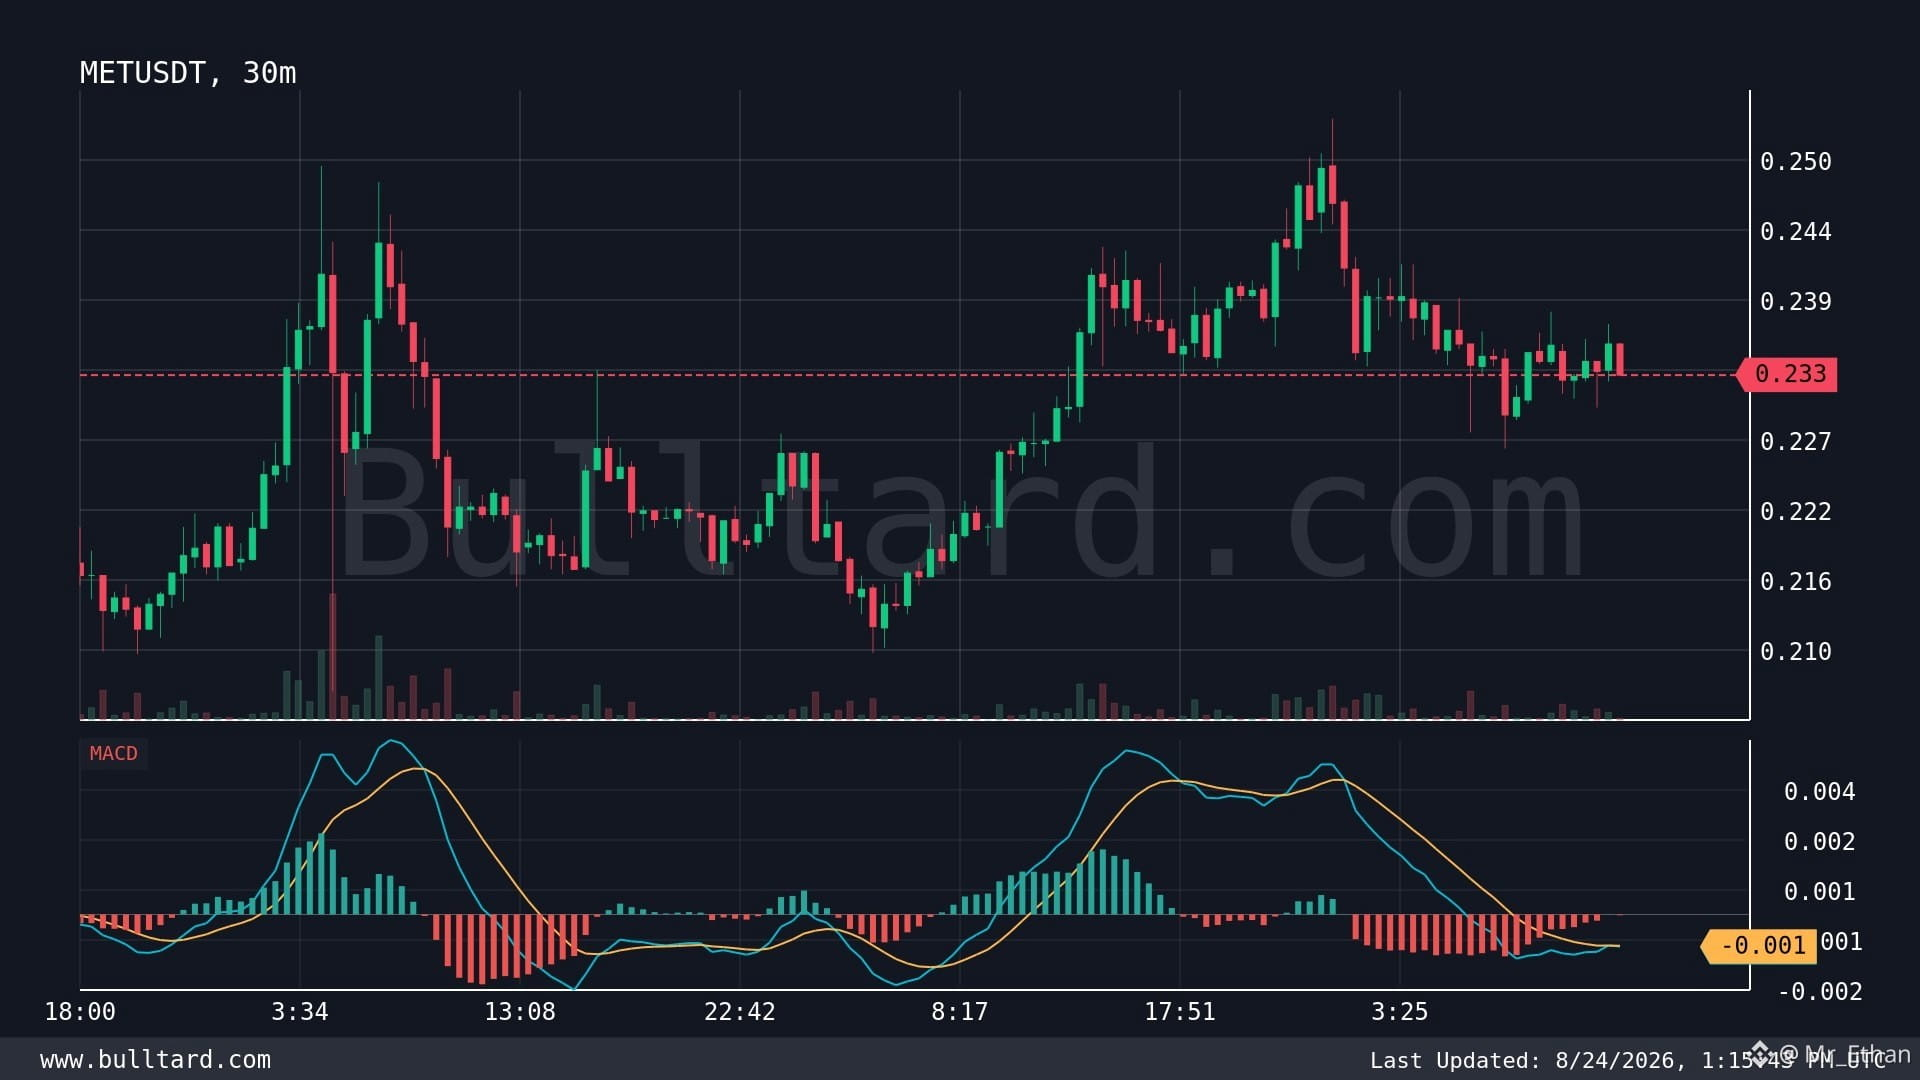
لقد تعلمت أن هذه الإشارات مفيدة، لكنها تعمل بشكل أفضل عندما أنظر أيضًا إلى الصورة الأكبر. عند حوالي 0.2325 دولار، يُظهر سهم MET ضعفًا على المدى القصير الآن، ما قد يعني أن البائعين يكتسبون السيطرة.
ما يعجبني في MET هو دوره في مجال البنية التحتية الواسعة ضمن Web3، وإمكانية وجود استخدام حقيقي إذا زاد التبنّي. لكن هذه القوة لا تلغي المخاطر. سيولة العملات المشفرة يمكن أن تتغير بسرعة، وقد يفشل التقاطع الهابط إذا تراجع البائعون وبدأ المشترون بالعودة بحجم تداول قوي.
الدرس الرئيسي الذي تعلمته من تداول هذه الإعدادات بسيط: لا أتعامل أبدًا مع مؤشر واحد على أنه اتجاه مضمون. أراقب بنية السعر، وحجم التداول، ومستويات الدعم، وكيف يتصرف BTC قبل اتخاذ قرار.
في الوقت الحالي، أنا حذر أكثر من كوني ألاحق الحركة. إذا استعاد المشترون الزخم، فقد تفقد الإشارة قوتها بسرعة.
هل ستنتظر تأكيدًا على $MET، أم أنك ستعتبر هذا التقاطع الهابط تحذيرًا مبكرًا؟
$SUPER
{spot}(SUPERUSDT)
$UAI
{future}(UAIUSDT)
$MET
{spot}(METUSDT)
يظهر تقاطع هابط للـ MACD على مخطط الـ 30 دقيقة، وأنا أراقبه.
لقد تعلمت أن هذه الإشارات مفيدة، لكنها تعمل بشكل أفضل عندما أنظر أيضًا إلى الصورة الأكبر. عند حوالي 0.2325 دولار، يُظهر سهم MET ضعفًا على المدى القصير الآن، ما قد يعني أن البائعين يكتسبون السيطرة.
ما يعجبني في MET هو دوره في مجال البنية التحتية الواسعة ضمن Web3، وإمكانية وجود استخدام حقيقي إذا زاد التبنّي. لكن هذه القوة لا تلغي المخاطر. سيولة العملات المشفرة يمكن أن تتغير بسرعة، وقد يفشل التقاطع الهابط إذا تراجع البائعون وبدأ المشترون بالعودة بحجم تداول قوي.
الدرس الرئيسي الذي تعلمته من تداول هذه الإعدادات بسيط: لا أتعامل أبدًا مع مؤشر واحد على أنه اتجاه مضمون. أراقب بنية السعر، وحجم التداول، ومستويات الدعم، وكيف يتصرف BTC قبل اتخاذ قرار.
في الوقت الحالي، أنا حذر أكثر من كوني ألاحق الحركة. إذا استعاد المشترون الزخم، فقد تفقد الإشارة قوتها بسرعة.
هل ستنتظر تأكيدًا على $MET ، أم أنك ستعتبر هذا التقاطع الهابط تحذيرًا مبكرًا؟
$SUPER
$UAI
$MET
لقد تعلمت أن هذه الإشارات مفيدة، لكنها تعمل بشكل أفضل عندما أنظر أيضًا إلى الصورة الأكبر. عند حوالي 0.2325 دولار، يُظهر سهم MET ضعفًا على المدى القصير الآن، ما قد يعني أن البائعين يكتسبون السيطرة.
ما يعجبني في MET هو دوره في مجال البنية التحتية الواسعة ضمن Web3، وإمكانية وجود استخدام حقيقي إذا زاد التبنّي. لكن هذه القوة لا تلغي المخاطر. سيولة العملات المشفرة يمكن أن تتغير بسرعة، وقد يفشل التقاطع الهابط إذا تراجع البائعون وبدأ المشترون بالعودة بحجم تداول قوي.
الدرس الرئيسي الذي تعلمته من تداول هذه الإعدادات بسيط: لا أتعامل أبدًا مع مؤشر واحد على أنه اتجاه مضمون. أراقب بنية السعر، وحجم التداول، ومستويات الدعم، وكيف يتصرف BTC قبل اتخاذ قرار.
في الوقت الحالي، أنا حذر أكثر من كوني ألاحق الحركة. إذا استعاد المشترون الزخم، فقد تفقد الإشارة قوتها بسرعة.
هل ستنتظر تأكيدًا على $MET ، أم أنك ستعتبر هذا التقاطع الهابط تحذيرًا مبكرًا؟
$SUPER
$UAI
$MET
1
2
270
·
--
صاعد
تداول $DUSK 82.7 USDT خلال 30 يوم
$DUSK #dusk @Dusk_Foundation
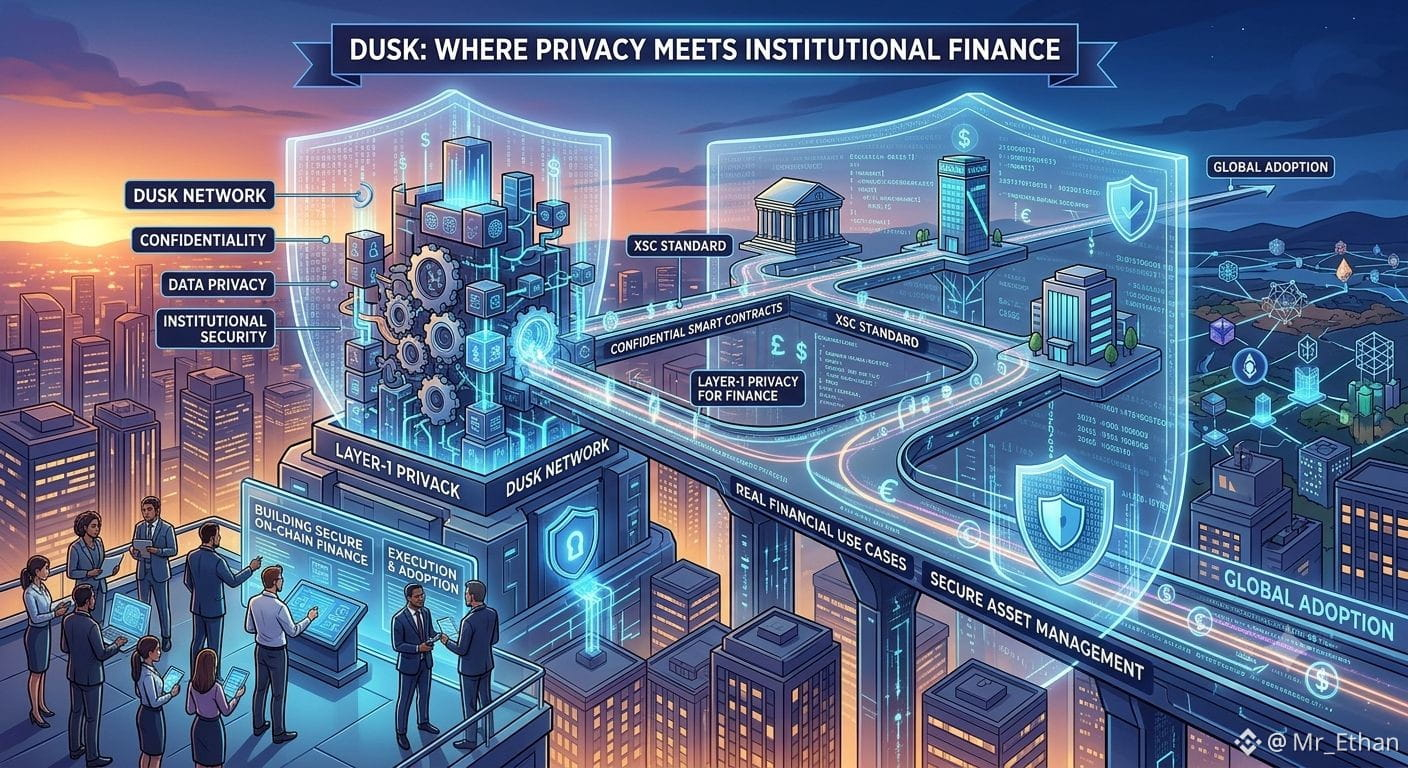
الغسق واحد من تلك المشاريع التي أعتقد أنها تستحق اهتمامًا أكبر عندما يبدأ السوق في الحديث بشكل جاد عن الخصوصية وحالات الاستخدام المالية الواقعية.
لقد شاهدتُ سرديات العملات المشفرة تتحرك من مجرد المضاربة نحو بنية تحتية يمكنها فعلًا حل المشكلات. هنا تصبح شبكة Dusk مثيرة للاهتمام. إنها طبقة أولى (Layer-1) مبنية حول الخصوصية للتطبيقات المالية، مع عقود ذكية سرّية ومعيار عقد الأمان السرّي (XSC).
ما يعجبني هو التركيز. لا تحاول Dusk أن تكون كل شيء في آنٍ واحد. إنها تستهدف مشكلة حقيقية: تحتاج المؤسسات المالية إلى فوائد البلوك تشين دون تعريض بيانات المعاملات والأعمال الحساسة.
القوة واضحة من حيث الاستخدام العملي، لكنني واقعي أيضًا تجاه المخاطر. أكبر سؤال هو مسألة التبنّي. التكنولوجيا القوية وحدها لا تضمن المستخدمين أو السيولة أو نشاط المطورين. كما أن المنافسة في مجال الخصوصية وبنية البلوك تشين على مستوى المؤسسات تعد أمرًا جديًا.
إحدى الدروس التي تعلمتها من عالم العملات المشفرة هي أن السرديات قد تخلق اهتمامًا، لكن التبنّي هو الذي يصنع قيمة مستدامة. أتابع DUSK أكثر بهدف التنفيذ لا بهدف الضجيج.
إذا أصبحت الخصوصية متطلبًا رئيسيًا لتمويل البلوك تشين، فهل يمكن أن تصبح Dusk إحدى الشبكات التي تستفيد؟$PROM $TUT
{future}(TUTUSDT)
{future}(PROMUSDT)
$DUSK #dusk @Dusk
الغسق واحد من تلك المشاريع التي أعتقد أنها تستحق اهتمامًا أكبر عندما يبدأ السوق في الحديث بشكل جاد عن الخصوصية وحالات الاستخدام المالية الواقعية.
لقد شاهدتُ سرديات العملات المشفرة تتحرك من مجرد المضاربة نحو بنية تحتية يمكنها فعلًا حل المشكلات. هنا تصبح شبكة Dusk مثيرة للاهتمام. إنها طبقة أولى (Layer-1) مبنية حول الخصوصية للتطبيقات المالية، مع عقود ذكية سرّية ومعيار عقد الأمان السرّي (XSC).
ما يعجبني هو التركيز. لا تحاول Dusk أن تكون كل شيء في آنٍ واحد. إنها تستهدف مشكلة حقيقية: تحتاج المؤسسات المالية إلى فوائد البلوك تشين دون تعريض بيانات المعاملات والأعمال الحساسة.
القوة واضحة من حيث الاستخدام العملي، لكنني واقعي أيضًا تجاه المخاطر. أكبر سؤال هو مسألة التبنّي. التكنولوجيا القوية وحدها لا تضمن المستخدمين أو السيولة أو نشاط المطورين. كما أن المنافسة في مجال الخصوصية وبنية البلوك تشين على مستوى المؤسسات تعد أمرًا جديًا.
إحدى الدروس التي تعلمتها من عالم العملات المشفرة هي أن السرديات قد تخلق اهتمامًا، لكن التبنّي هو الذي يصنع قيمة مستدامة. أتابع DUSK أكثر بهدف التنفيذ لا بهدف الضجيج.
إذا أصبحت الخصوصية متطلبًا رئيسيًا لتمويل البلوك تشين، فهل يمكن أن تصبح Dusk إحدى الشبكات التي تستفيد؟$PROM $TUT
الغسق واحد من تلك المشاريع التي أعتقد أنها تستحق اهتمامًا أكبر عندما يبدأ السوق في الحديث بشكل جاد عن الخصوصية وحالات الاستخدام المالية الواقعية.
لقد شاهدتُ سرديات العملات المشفرة تتحرك من مجرد المضاربة نحو بنية تحتية يمكنها فعلًا حل المشكلات. هنا تصبح شبكة Dusk مثيرة للاهتمام. إنها طبقة أولى (Layer-1) مبنية حول الخصوصية للتطبيقات المالية، مع عقود ذكية سرّية ومعيار عقد الأمان السرّي (XSC).
ما يعجبني هو التركيز. لا تحاول Dusk أن تكون كل شيء في آنٍ واحد. إنها تستهدف مشكلة حقيقية: تحتاج المؤسسات المالية إلى فوائد البلوك تشين دون تعريض بيانات المعاملات والأعمال الحساسة.
القوة واضحة من حيث الاستخدام العملي، لكنني واقعي أيضًا تجاه المخاطر. أكبر سؤال هو مسألة التبنّي. التكنولوجيا القوية وحدها لا تضمن المستخدمين أو السيولة أو نشاط المطورين. كما أن المنافسة في مجال الخصوصية وبنية البلوك تشين على مستوى المؤسسات تعد أمرًا جديًا.
إحدى الدروس التي تعلمتها من عالم العملات المشفرة هي أن السرديات قد تخلق اهتمامًا، لكن التبنّي هو الذي يصنع قيمة مستدامة. أتابع DUSK أكثر بهدف التنفيذ لا بهدف الضجيج.
إذا أصبحت الخصوصية متطلبًا رئيسيًا لتمويل البلوك تشين، فهل يمكن أن تصبح Dusk إحدى الشبكات التي تستفيد؟$PROM $TUT
2
1
110
سجّل الدخول لاستكشاف المزيد من المُحتوى
انضم إلى مُستخدمي العملات الرقمية حول العالم على Binance Square
⚡️ احصل على أحدث المعلومات المفيدة عن العملات الرقمية.
💬 موثوقة من قبل أكبر منصّة لتداول العملات الرقمية في العالم.
👍 اكتشف الرؤى الحقيقية من صنّاع المُحتوى الموثوقين.
البريد الإلكتروني / رقم الهاتف
المواضيع الرائجة
BinanceLaunchesBinanceIntelligence
7,836 مشاهدات
128 يقومون بالنقاش
#BinanceLaunchesBinanceIntelligence
#binancelaunchesbinanceintelligence
🤖 BINANCE تُطلق ذكاءً اصطناعيًا جديدًا: هل يعني هذا «الاهتمام بالجديد وإهمال القديم» يا جماعة؟ 🤔
أطلقت Binance للتو ثلاث أدوات ذكاء اصطناعي «رهيبة»: Agent OS للمطورين، وBinance AI مجانًا للجميع، وAI Pro للمتداولين المحترفين لأتمتة التداول من دون كتابة أي أكواد. يبدو الأمر كأنه من فيلم خيال علمي، إذ يضع تقنيات صناديق الاستثمار التي تكلف ملايين الدولارات بين أيديكم!
لكن لحظة... سيد Richard Teng، لماذا تبدو الأدوات الجديدة براقة بينما الأدوات القديمة «مجمّدة»؟ في قسم الأخبار، ما عدا قسم «الأعلى»، لا تزال الفلاتر الأخرى عالقة منذ 28/9/2026! هل هذا مثال على «الاهتمام بالجديد وإهمال القديم»؟ هل انشغلتم بملاحقة صيحة الذكاء الاصطناعي وأهملتم مصدر رزقنا القديم؟ 😂 مصدر رزقنا القديم؟ 😂
🧠 ماذا يفعل المتداول؟
استفد من الذكاء الاصطناعي الجديد لتحليل فرص التداول، لكن تذكّر أن تتحقق من الأخبار يدويًا كي لا تقرأ معلومات قديمة!
⚠️ هذه ليست نصيحة مالية!
#BinanceLaunchesBinanceIntelligence
#BinanceSquare
SHAABAN ATYA
·0 إعجاب
·189 مشاهدات
EvernorthXRPTreasuryCompletesSPACMerger
12,768 مشاهدات
111 يقومون بالنقاش
ADAGains10%Above$0.27
22,992 مشاهدات
195 يقومون بالنقاش