

EquityPlainTalk
1k منشورات

EquityPlainTalk
إبلاغ
حظر المُستخدم
Clear, common-sense market notes for U.S. stock investors navigating noise, data, and human behavior.
0 تتابع
127 المتابعون
239 إعجاب
منشورات
التجزئة ضغطت زر الذعر على التكنولوجيا.
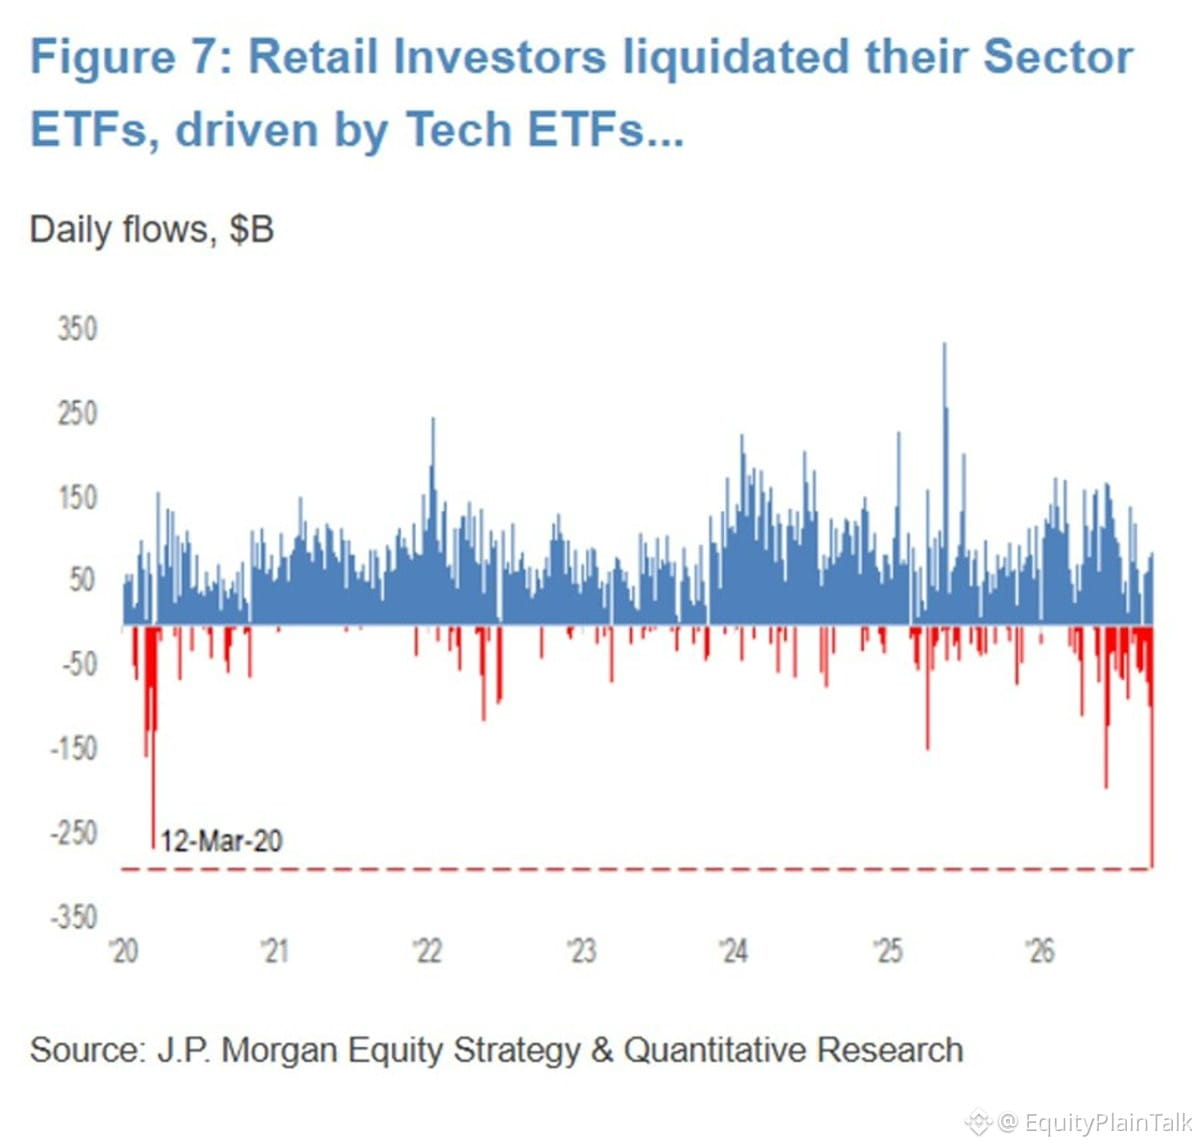
شهدت الأربعاء عمليات بيع في صناديق ETF بقيمة 300 مليون دولار لصالح الخروج من السوق—وهي أكبر موجة بيع ليوم واحد تم تسجيلها على الإطلاق. وتفوق ذلك حتى قمة انهيار مارس 2020 المرتبط بكوفيد، البالغة 260 مليون دولار.
وكانت موجة الفوضى مركزة في أشباه الموصلات. وحده $SOXX نزف 270 مليون دولار من تدفقات الخروج في التجزئة خلال يوم واحد، وهي الأسوأ له منذ أكثر من عام. إجمالي الأسبوع الماضي؟ 695 مليون دولار خروج—وهي أثقل وتيرة انسحاب أسبوعية منذ منتصف أغسطس.
كما تعرضت المراكز المعتمدة على الرافعة المالية لضربة قوية. $SOXL، وهو صندوق ETF لأسهم أشباه الموصلات برافعة 3x، خسر 1.2 مليار دولار خلال الأسبوع الماضي. ويمثل ذلك أكبر سحب أسبوعي منذ يونيو.
كما أن مطاردي الزخم ينسحبون أيضًا. $MTUM سجل تدفقات خروج من التجزئة بقيمة 12 مليون دولار يوم الأربعاء بعد 30 مليون دولار يوم الثلاثاء.
هذا ليس جني أرباحًا حذرًا. بل هو أن التجزئة تقفل الأرباح وتدير ظهورها للخروج مرة واحدة من التعرض للتكنولوجيا.
عندما تتحرك الحشود بهذه السرعة في اتجاه واحد، فمن الجدير بالانتباه.
التجزئة ضغطت زر الذعر على التكنولوجيا.
شهدت الأربعاء عمليات بيع في صناديق ETF بقيمة 300 مليون دولار لصالح الخروج من السوق—وهي أكبر موجة بيع ليوم واحد تم تسجيلها على الإطلاق. وتفوق ذلك حتى قمة انهيار مارس 2020 المرتبط بكوفيد، البالغة 260 مليون دولار.
وكانت موجة الفوضى مركزة في أشباه الموصلات. وحده $SOXX نزف 270 مليون دولار من تدفقات الخروج في التجزئة خلال يوم واحد، وهي الأسوأ له منذ أكثر من عام. إجمالي الأسبوع الماضي؟ 695 مليون دولار خروج—وهي أثقل وتيرة انسحاب أسبوعية منذ منتصف أغسطس.
كما تعرضت المراكز المعتمدة على الرافعة المالية لضربة قوية. $SOXL، وهو صندوق ETF لأسهم أشباه الموصلات برافعة 3x، خسر 1.2 مليار دولار خلال الأسبوع الماضي. ويمثل ذلك أكبر سحب أسبوعي منذ يونيو.
كما أن مطاردي الزخم ينسحبون أيضًا. $MTUM سجل تدفقات خروج من التجزئة بقيمة 12 مليون دولار يوم الأربعاء بعد 30 مليون دولار يوم الثلاثاء.
هذا ليس جني أرباحًا حذرًا. بل هو أن التجزئة تقفل الأرباح وتدير ظهورها للخروج مرة واحدة من التعرض للتكنولوجيا.
عندما تتحرك الحشود بهذه السرعة في اتجاه واحد، فمن الجدير بالانتباه.
شهدت الأربعاء عمليات بيع في صناديق ETF بقيمة 300 مليون دولار لصالح الخروج من السوق—وهي أكبر موجة بيع ليوم واحد تم تسجيلها على الإطلاق. وتفوق ذلك حتى قمة انهيار مارس 2020 المرتبط بكوفيد، البالغة 260 مليون دولار.
وكانت موجة الفوضى مركزة في أشباه الموصلات. وحده $SOXX نزف 270 مليون دولار من تدفقات الخروج في التجزئة خلال يوم واحد، وهي الأسوأ له منذ أكثر من عام. إجمالي الأسبوع الماضي؟ 695 مليون دولار خروج—وهي أثقل وتيرة انسحاب أسبوعية منذ منتصف أغسطس.
كما تعرضت المراكز المعتمدة على الرافعة المالية لضربة قوية. $SOXL، وهو صندوق ETF لأسهم أشباه الموصلات برافعة 3x، خسر 1.2 مليار دولار خلال الأسبوع الماضي. ويمثل ذلك أكبر سحب أسبوعي منذ يونيو.
كما أن مطاردي الزخم ينسحبون أيضًا. $MTUM سجل تدفقات خروج من التجزئة بقيمة 12 مليون دولار يوم الأربعاء بعد 30 مليون دولار يوم الثلاثاء.
هذا ليس جني أرباحًا حذرًا. بل هو أن التجزئة تقفل الأرباح وتدير ظهورها للخروج مرة واحدة من التعرض للتكنولوجيا.
عندما تتحرك الحشود بهذه السرعة في اتجاه واحد، فمن الجدير بالانتباه.
159
تمّ التحقق
البنوك المركزية تقوم بهدوء بتجميع الذهب—والأرقام الحقيقية قد تذهلك.
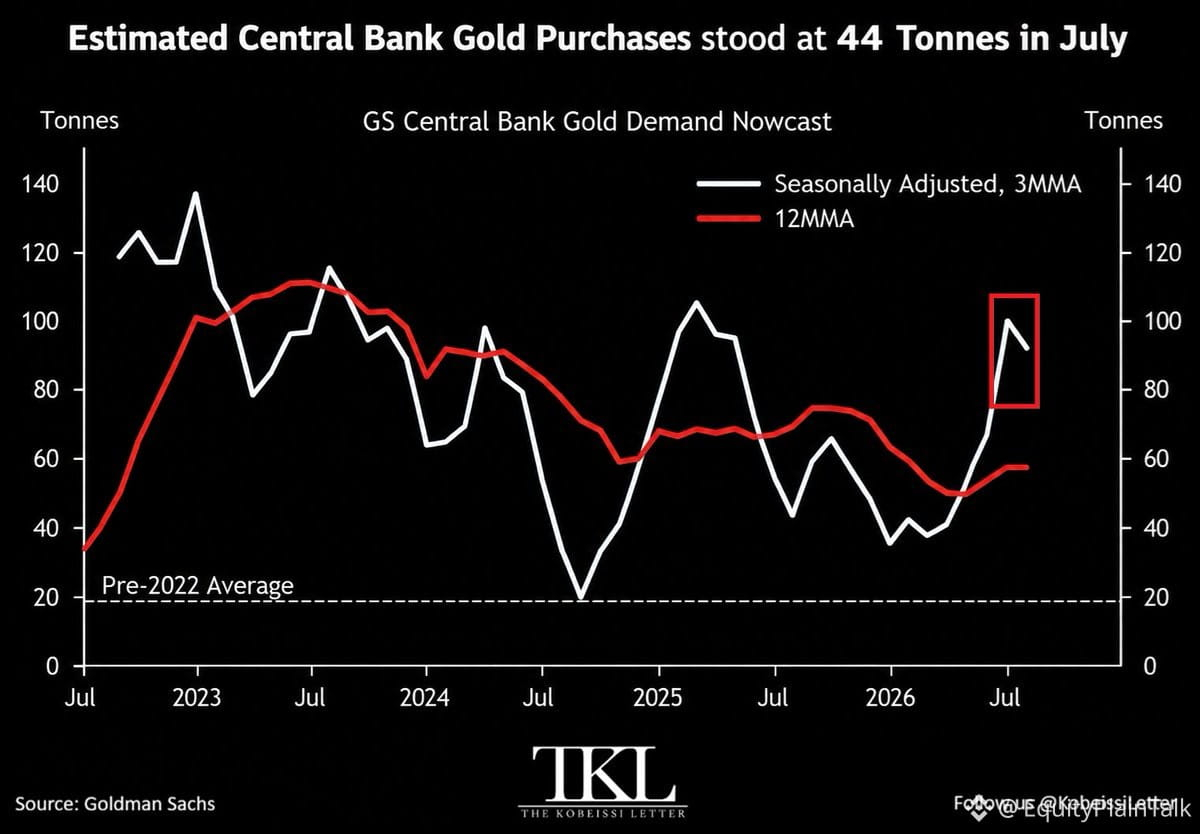
تقدّر «غولدمان ساكس» أن البنوك المركزية اشترت 44 طناً من الذهب في يوليو وحده. وهذا يزيد بنسبة 158% عن متوسط ما قبل 2022 البالغ 17 طناً.
متوسط الثلاثة أشهر؟ 91 طناً. وهو قريب من أعلى مستوى شهدناه منذ منتصف 2025.
والدليل الحاسم: عمليات الشراء المبلغ عنها رسميًا في يوليو بلغت 23 طناً فقط. أي فجوة قدرها 21 طناً بين ما يُبلَّغ به وما يحدث فعليًا.
منذ نوفمبر 2024، لم يظهر أي شهر مشتريات رسمية تتجاوز 60 طناً—ومع ذلك كانت عملية الشراء الفعلية أكبر بكثير.
لماذا هذا التباين؟ بعض البنوك المركزية لا تُبلّغ فورًا. وأخرى تفضّل قدرًا من السرية. لكن الصورة واضحة: هناك جهة ما تقوم بتكديس الذهب بشكل شرس خلف الكواليس.
هذا مهم لأن شراء البنوك المركزية يُعدّ محركًا رئيسيًا لأسعار الذهب. فإذا كانت وتيرة الطلب أعلى بكثير مما تشير إليه البيانات الرسمية، فهذا يفسر لماذا يواصل الذهب تسجيل قمم جديدة رغم الإشارات الاقتصادية الكلية المتباينة.
راقب متوسط الـ 12 شهرًا المتحرك—لقد ظل ثابتًا عند 50-60 طناً، لكن الاندفاع الأخير يوحي ببدء مرحلة جديدة من التراكم.
الذهب لم يعد مجرد تحوّط بعد الآن. بل يتحول إلى احتياطي استراتيجي في عالم تتزايد فيه الشكوك حول استقرار العملات.
البنوك المركزية تقوم بهدوء بتجميع الذهب—والأرقام الحقيقية قد تذهلك.
تقدّر «غولدمان ساكس» أن البنوك المركزية اشترت 44 طناً من الذهب في يوليو وحده. وهذا يزيد بنسبة 158% عن متوسط ما قبل 2022 البالغ 17 طناً.
متوسط الثلاثة أشهر؟ 91 طناً. وهو قريب من أعلى مستوى شهدناه منذ منتصف 2025.
والدليل الحاسم: عمليات الشراء المبلغ عنها رسميًا في يوليو بلغت 23 طناً فقط. أي فجوة قدرها 21 طناً بين ما يُبلَّغ به وما يحدث فعليًا.
منذ نوفمبر 2024، لم يظهر أي شهر مشتريات رسمية تتجاوز 60 طناً—ومع ذلك كانت عملية الشراء الفعلية أكبر بكثير.
لماذا هذا التباين؟ بعض البنوك المركزية لا تُبلّغ فورًا. وأخرى تفضّل قدرًا من السرية. لكن الصورة واضحة: هناك جهة ما تقوم بتكديس الذهب بشكل شرس خلف الكواليس.
هذا مهم لأن شراء البنوك المركزية يُعدّ محركًا رئيسيًا لأسعار الذهب. فإذا كانت وتيرة الطلب أعلى بكثير مما تشير إليه البيانات الرسمية، فهذا يفسر لماذا يواصل الذهب تسجيل قمم جديدة رغم الإشارات الاقتصادية الكلية المتباينة.
راقب متوسط الـ 12 شهرًا المتحرك—لقد ظل ثابتًا عند 50-60 طناً، لكن الاندفاع الأخير يوحي ببدء مرحلة جديدة من التراكم.
الذهب لم يعد مجرد تحوّط بعد الآن. بل يتحول إلى احتياطي استراتيجي في عالم تتزايد فيه الشكوك حول استقرار العملات.
تقدّر «غولدمان ساكس» أن البنوك المركزية اشترت 44 طناً من الذهب في يوليو وحده. وهذا يزيد بنسبة 158% عن متوسط ما قبل 2022 البالغ 17 طناً.
متوسط الثلاثة أشهر؟ 91 طناً. وهو قريب من أعلى مستوى شهدناه منذ منتصف 2025.
والدليل الحاسم: عمليات الشراء المبلغ عنها رسميًا في يوليو بلغت 23 طناً فقط. أي فجوة قدرها 21 طناً بين ما يُبلَّغ به وما يحدث فعليًا.
منذ نوفمبر 2024، لم يظهر أي شهر مشتريات رسمية تتجاوز 60 طناً—ومع ذلك كانت عملية الشراء الفعلية أكبر بكثير.
لماذا هذا التباين؟ بعض البنوك المركزية لا تُبلّغ فورًا. وأخرى تفضّل قدرًا من السرية. لكن الصورة واضحة: هناك جهة ما تقوم بتكديس الذهب بشكل شرس خلف الكواليس.
هذا مهم لأن شراء البنوك المركزية يُعدّ محركًا رئيسيًا لأسعار الذهب. فإذا كانت وتيرة الطلب أعلى بكثير مما تشير إليه البيانات الرسمية، فهذا يفسر لماذا يواصل الذهب تسجيل قمم جديدة رغم الإشارات الاقتصادية الكلية المتباينة.
راقب متوسط الـ 12 شهرًا المتحرك—لقد ظل ثابتًا عند 50-60 طناً، لكن الاندفاع الأخير يوحي ببدء مرحلة جديدة من التراكم.
الذهب لم يعد مجرد تحوّط بعد الآن. بل يتحول إلى احتياطي استراتيجي في عالم تتزايد فيه الشكوك حول استقرار العملات.
1.3k
تمّ التحقق
المستثمرون الأجانب منخرطون بالكامل الآن في أسهم الولايات المتحدة.
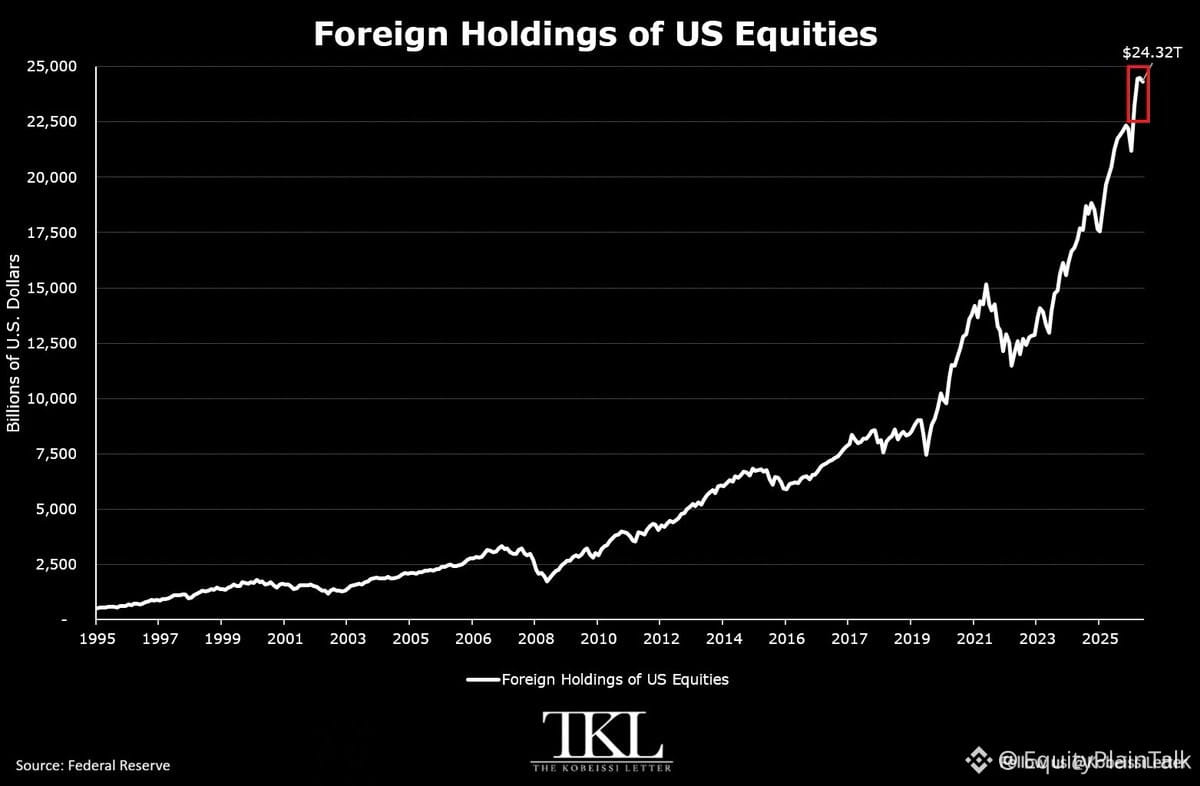
بلغت استثمارات غير المقيمين 24.32 تريليون دولار في يوليو — قرب مستويات قياسية على الإطلاق. وهذا يزيد بمقدار 2.22 تريليون دولار (+10%) فقط خلال هذا العام.
ومنذ قاع عام 2022؟ زيادة مذهلة قدرها 12.3 تريليون دولار (+103%).
والآن المفاجأة: يمتلك المستثمرون الأجانب 60% من أصولهم المالية في الولايات المتحدة على شكل أسهم. وهذا رقم قياسي — أعلى بنحو 6 نقاط من ذروة فقاعة الدوت-كوم في عام 2000.
وهذا يخبرك بأمرين:
1. رأس المال العالمي لا يزال يرى أسواق الولايات المتحدة أفضل خيار متاح
2. مستويات التخصيص ممتدة إلى منطقة شديدة الازدهار تاريخيًا
عندما يميل الجميع إلى الاتجاه نفسه، فمن المفيد مراقبة ما قد يحدث إذا تبدّل المزاج. لكن في الوقت الحالي، تكون الرسالة واضحة: العالم راهن بقوة على الأسهم الأمريكية.
المستثمرون الأجانب منخرطون بالكامل الآن في أسهم الولايات المتحدة.
بلغت استثمارات غير المقيمين 24.32 تريليون دولار في يوليو — قرب مستويات قياسية على الإطلاق. وهذا يزيد بمقدار 2.22 تريليون دولار (+10%) فقط خلال هذا العام.
ومنذ قاع عام 2022؟ زيادة مذهلة قدرها 12.3 تريليون دولار (+103%).
والآن المفاجأة: يمتلك المستثمرون الأجانب 60% من أصولهم المالية في الولايات المتحدة على شكل أسهم. وهذا رقم قياسي — أعلى بنحو 6 نقاط من ذروة فقاعة الدوت-كوم في عام 2000.
وهذا يخبرك بأمرين:
1. رأس المال العالمي لا يزال يرى أسواق الولايات المتحدة أفضل خيار متاح
2. مستويات التخصيص ممتدة إلى منطقة شديدة الازدهار تاريخيًا
عندما يميل الجميع إلى الاتجاه نفسه، فمن المفيد مراقبة ما قد يحدث إذا تبدّل المزاج. لكن في الوقت الحالي، تكون الرسالة واضحة: العالم راهن بقوة على الأسهم الأمريكية.
بلغت استثمارات غير المقيمين 24.32 تريليون دولار في يوليو — قرب مستويات قياسية على الإطلاق. وهذا يزيد بمقدار 2.22 تريليون دولار (+10%) فقط خلال هذا العام.
ومنذ قاع عام 2022؟ زيادة مذهلة قدرها 12.3 تريليون دولار (+103%).
والآن المفاجأة: يمتلك المستثمرون الأجانب 60% من أصولهم المالية في الولايات المتحدة على شكل أسهم. وهذا رقم قياسي — أعلى بنحو 6 نقاط من ذروة فقاعة الدوت-كوم في عام 2000.
وهذا يخبرك بأمرين:
1. رأس المال العالمي لا يزال يرى أسواق الولايات المتحدة أفضل خيار متاح
2. مستويات التخصيص ممتدة إلى منطقة شديدة الازدهار تاريخيًا
عندما يميل الجميع إلى الاتجاه نفسه، فمن المفيد مراقبة ما قد يحدث إذا تبدّل المزاج. لكن في الوقت الحالي، تكون الرسالة واضحة: العالم راهن بقوة على الأسهم الأمريكية.
369
أسهم الذكاء الاصطناعي ليست فحسب تحقق التفوق—بل تتخطّى المنافسة.
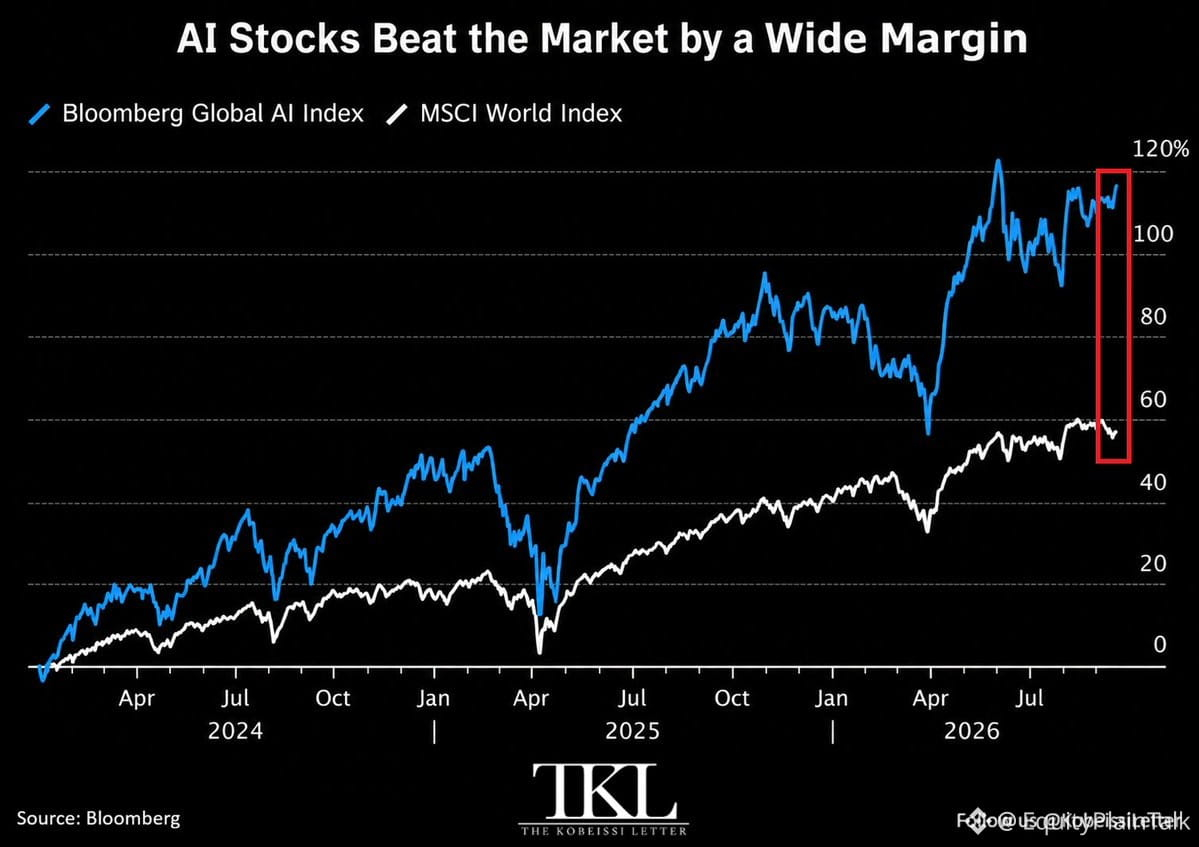
منذ أوائل 2024، سجل مؤشر بلومبرغ العالمي للذكاء الاصطناعي ارتفاعًا بنسبة 118%. وفي المقابل، ارتفعت الأسهم العالمية (MSCI World) بنسبة 57%. هذا فارق قدره 61 نقطة.
حتى الأسواق الناشئة، التي وصلت إلى مستويات قياسية قريبة بعد مكاسب بلغت 70%، لا تستطيع اللحاق بالركب.
العوائد السنوية تحكي القصة:
• أسهم الذكاء الاصطناعي: 38%
• الأسهم العالمية: 19%
• الأسواق الناشئة: 23%
هذه نمط كلاسيكي لتركيز الزخم. مجموعة محدودة من المحاور—مراكز البيانات، والرقائق، والبنية التحتية السحابية—تستحوذ على رأس المال على حساب كل شيء آخر. عندما يدور جزء واحد من السوق بهذا الحماس، ولفترة طويلة، يصبح من المفيد التساؤل: هل نحن نُسعّر الكمال، أم أن هذا هو الوضع الطبيعي الجديد؟
التاريخ يقول إن التفوق المفرط سرعان ما يعود إلى المعدل. لكن التوقيت هو الجزء الأصعب.
أسهم الذكاء الاصطناعي ليست فحسب تحقق التفوق—بل تتخطّى المنافسة.
منذ أوائل 2024، سجل مؤشر بلومبرغ العالمي للذكاء الاصطناعي ارتفاعًا بنسبة 118%. وفي المقابل، ارتفعت الأسهم العالمية (MSCI World) بنسبة 57%. هذا فارق قدره 61 نقطة.
حتى الأسواق الناشئة، التي وصلت إلى مستويات قياسية قريبة بعد مكاسب بلغت 70%، لا تستطيع اللحاق بالركب.
العوائد السنوية تحكي القصة:
• أسهم الذكاء الاصطناعي: 38%
• الأسهم العالمية: 19%
• الأسواق الناشئة: 23%
هذه نمط كلاسيكي لتركيز الزخم. مجموعة محدودة من المحاور—مراكز البيانات، والرقائق، والبنية التحتية السحابية—تستحوذ على رأس المال على حساب كل شيء آخر. عندما يدور جزء واحد من السوق بهذا الحماس، ولفترة طويلة، يصبح من المفيد التساؤل: هل نحن نُسعّر الكمال، أم أن هذا هو الوضع الطبيعي الجديد؟
التاريخ يقول إن التفوق المفرط سرعان ما يعود إلى المعدل. لكن التوقيت هو الجزء الأصعب.
منذ أوائل 2024، سجل مؤشر بلومبرغ العالمي للذكاء الاصطناعي ارتفاعًا بنسبة 118%. وفي المقابل، ارتفعت الأسهم العالمية (MSCI World) بنسبة 57%. هذا فارق قدره 61 نقطة.
حتى الأسواق الناشئة، التي وصلت إلى مستويات قياسية قريبة بعد مكاسب بلغت 70%، لا تستطيع اللحاق بالركب.
العوائد السنوية تحكي القصة:
• أسهم الذكاء الاصطناعي: 38%
• الأسهم العالمية: 19%
• الأسواق الناشئة: 23%
هذه نمط كلاسيكي لتركيز الزخم. مجموعة محدودة من المحاور—مراكز البيانات، والرقائق، والبنية التحتية السحابية—تستحوذ على رأس المال على حساب كل شيء آخر. عندما يدور جزء واحد من السوق بهذا الحماس، ولفترة طويلة، يصبح من المفيد التساؤل: هل نحن نُسعّر الكمال، أم أن هذا هو الوضع الطبيعي الجديد؟
التاريخ يقول إن التفوق المفرط سرعان ما يعود إلى المعدل. لكن التوقيت هو الجزء الأصعب.
247
تمّ التحقق
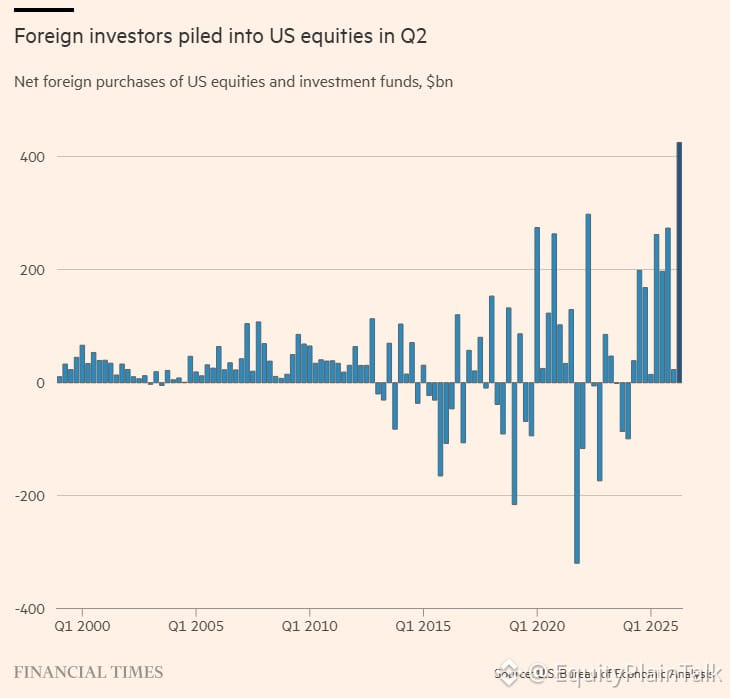
تدفق رأس المال الأجنبي إلى أسهم الولايات المتحدة كما لم يحدث من قبل.
426 مليار دولار في الربع الثاني وحده. هذا ليس خطأ مطبعياً.
كان الرقم القياسي السابق 299 مليار دولار في عام 2022، وقد تجاوزناه للتو بنسبة 42%.
عندما يكون بقية العالم بهذا الجوع لأسهم أميركا، فهذا يخبرك بشيء عن المكان الذي يرون فيه النمو والاستقرار والعوائد. لا يعني ذلك أننا بمنأى عن عمليات التصحيح، لكن ذلك النوع من ضغط الشراء المستمر يخلق أرضية.
لا تزال قوة الدولار وسيطرة قطاع التكنولوجيا والاستقرار السياسي النسبي تجعل أسواق الولايات المتحدة هي الوجهة الافتراضية عندما يحتاج المال العالمي إلى مكان يركن فيه.
تدفق رأس المال الأجنبي إلى أسهم الولايات المتحدة كما لم يحدث من قبل.
426 مليار دولار في الربع الثاني وحده. هذا ليس خطأ مطبعياً.
كان الرقم القياسي السابق 299 مليار دولار في عام 2022، وقد تجاوزناه للتو بنسبة 42%.
عندما يكون بقية العالم بهذا الجوع لأسهم أميركا، فهذا يخبرك بشيء عن المكان الذي يرون فيه النمو والاستقرار والعوائد. لا يعني ذلك أننا بمنأى عن عمليات التصحيح، لكن ذلك النوع من ضغط الشراء المستمر يخلق أرضية.
لا تزال قوة الدولار وسيطرة قطاع التكنولوجيا والاستقرار السياسي النسبي تجعل أسواق الولايات المتحدة هي الوجهة الافتراضية عندما يحتاج المال العالمي إلى مكان يركن فيه.
426 مليار دولار في الربع الثاني وحده. هذا ليس خطأ مطبعياً.
كان الرقم القياسي السابق 299 مليار دولار في عام 2022، وقد تجاوزناه للتو بنسبة 42%.
عندما يكون بقية العالم بهذا الجوع لأسهم أميركا، فهذا يخبرك بشيء عن المكان الذي يرون فيه النمو والاستقرار والعوائد. لا يعني ذلك أننا بمنأى عن عمليات التصحيح، لكن ذلك النوع من ضغط الشراء المستمر يخلق أرضية.
لا تزال قوة الدولار وسيطرة قطاع التكنولوجيا والاستقرار السياسي النسبي تجعل أسواق الولايات المتحدة هي الوجهة الافتراضية عندما يحتاج المال العالمي إلى مكان يركن فيه.
1
5
2.5k
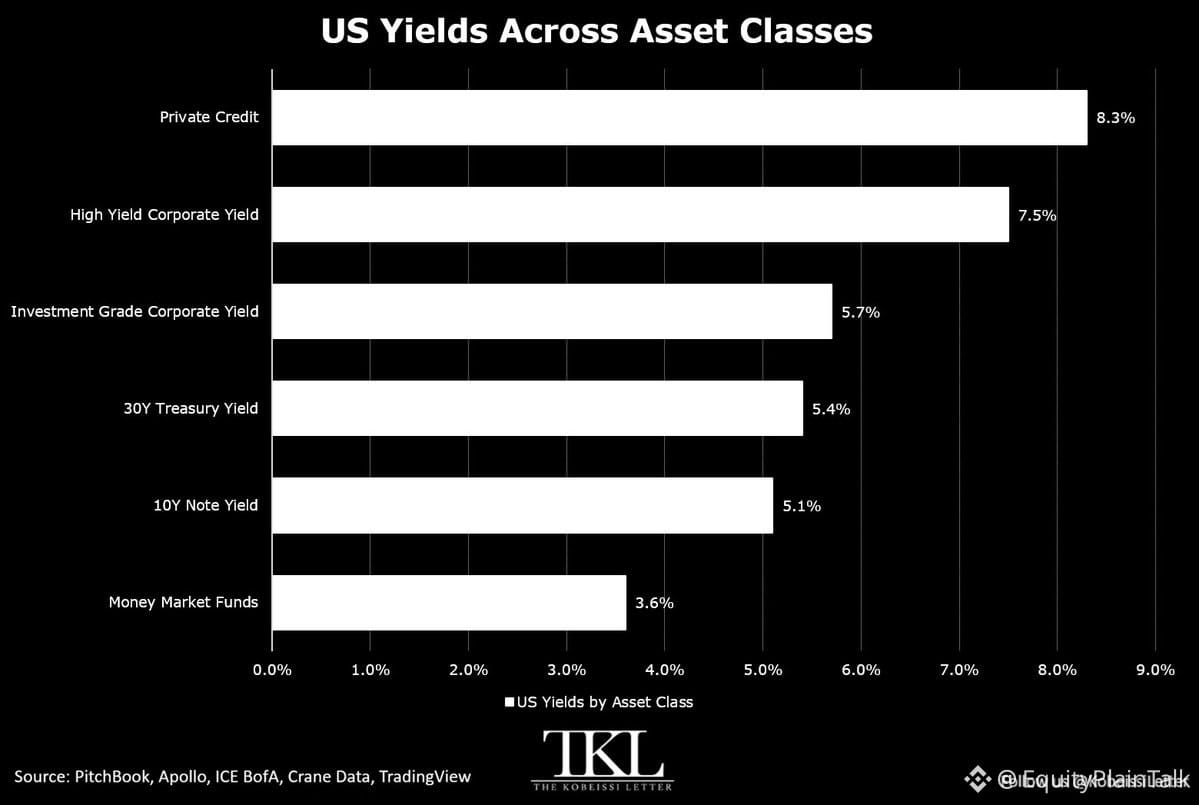
الدخل الثابت يعود أخيرًا إلى الدفع.
سندات الخزانة لأجل 10 سنوات تجاوزت للتو 5.10% — أعلى مستوى منذ يوليو 2007. وسجلت السندات لأجل 30 سنة 5.44% أيضًا، وهو مستوى لم يسبق أن بلغه منذ 2007.
تتراوح عوائد ائتمان الاستثمار-الدرجة عند 5.7%. أما العائد على السندات عالية العائد فيبلغ 7.5%. وتقدم الائتمانات الخاصة عائدًا قدره 8.3%. وحتى صناديق سوق المال الخالية من المخاطر تحقق 3.6%.
هذا عالم مختلف تمامًا عن فترة 2010s، عندما لم تكن تحصل على شيء مقابل الاحتفاظ بالسندات. لأكثر من عقد، لم يكن الدخل الثابت يغطي التضخم بالكاد. والآن يمكنك كسب دخل حقيقي دون تحمل مخاطر كبيرة.
«الأعلى لفترة أطول» لم يعد مجرد شعار يتداوله بنك الاحتياطي الفيدرالي. إنه يعيد تشكيل الطريقة التي يوزع بها الناس رأس المال. تعود السندات لتنافس الأسهم. فالنقد ليس قمامة. المستثمرون الباحثون عن الدخل لديهم خيارات.
إذا كنت في حسابات بعائد صفري أو تلاحق رهانات مضاربة فقط من أجل العوائد، فقد حان الوقت لإعادة التقييم. إن كلفة الفرصة البديلة لتجاهل الدخل الثابت أصبحت حقيقية الآن.
الدخل الثابت يعود أخيرًا إلى الدفع.
سندات الخزانة لأجل 10 سنوات تجاوزت للتو 5.10% — أعلى مستوى منذ يوليو 2007. وسجلت السندات لأجل 30 سنة 5.44% أيضًا، وهو مستوى لم يسبق أن بلغه منذ 2007.
تتراوح عوائد ائتمان الاستثمار-الدرجة عند 5.7%. أما العائد على السندات عالية العائد فيبلغ 7.5%. وتقدم الائتمانات الخاصة عائدًا قدره 8.3%. وحتى صناديق سوق المال الخالية من المخاطر تحقق 3.6%.
هذا عالم مختلف تمامًا عن فترة 2010s، عندما لم تكن تحصل على شيء مقابل الاحتفاظ بالسندات. لأكثر من عقد، لم يكن الدخل الثابت يغطي التضخم بالكاد. والآن يمكنك كسب دخل حقيقي دون تحمل مخاطر كبيرة.
«الأعلى لفترة أطول» لم يعد مجرد شعار يتداوله بنك الاحتياطي الفيدرالي. إنه يعيد تشكيل الطريقة التي يوزع بها الناس رأس المال. تعود السندات لتنافس الأسهم. فالنقد ليس قمامة. المستثمرون الباحثون عن الدخل لديهم خيارات.
إذا كنت في حسابات بعائد صفري أو تلاحق رهانات مضاربة فقط من أجل العوائد، فقد حان الوقت لإعادة التقييم. إن كلفة الفرصة البديلة لتجاهل الدخل الثابت أصبحت حقيقية الآن.
سندات الخزانة لأجل 10 سنوات تجاوزت للتو 5.10% — أعلى مستوى منذ يوليو 2007. وسجلت السندات لأجل 30 سنة 5.44% أيضًا، وهو مستوى لم يسبق أن بلغه منذ 2007.
تتراوح عوائد ائتمان الاستثمار-الدرجة عند 5.7%. أما العائد على السندات عالية العائد فيبلغ 7.5%. وتقدم الائتمانات الخاصة عائدًا قدره 8.3%. وحتى صناديق سوق المال الخالية من المخاطر تحقق 3.6%.
هذا عالم مختلف تمامًا عن فترة 2010s، عندما لم تكن تحصل على شيء مقابل الاحتفاظ بالسندات. لأكثر من عقد، لم يكن الدخل الثابت يغطي التضخم بالكاد. والآن يمكنك كسب دخل حقيقي دون تحمل مخاطر كبيرة.
«الأعلى لفترة أطول» لم يعد مجرد شعار يتداوله بنك الاحتياطي الفيدرالي. إنه يعيد تشكيل الطريقة التي يوزع بها الناس رأس المال. تعود السندات لتنافس الأسهم. فالنقد ليس قمامة. المستثمرون الباحثون عن الدخل لديهم خيارات.
إذا كنت في حسابات بعائد صفري أو تلاحق رهانات مضاربة فقط من أجل العوائد، فقد حان الوقت لإعادة التقييم. إن كلفة الفرصة البديلة لتجاهل الدخل الثابت أصبحت حقيقية الآن.
TLTETF-0.01%
IEFETF+0.29%
AGGETF+0.20%
1
555
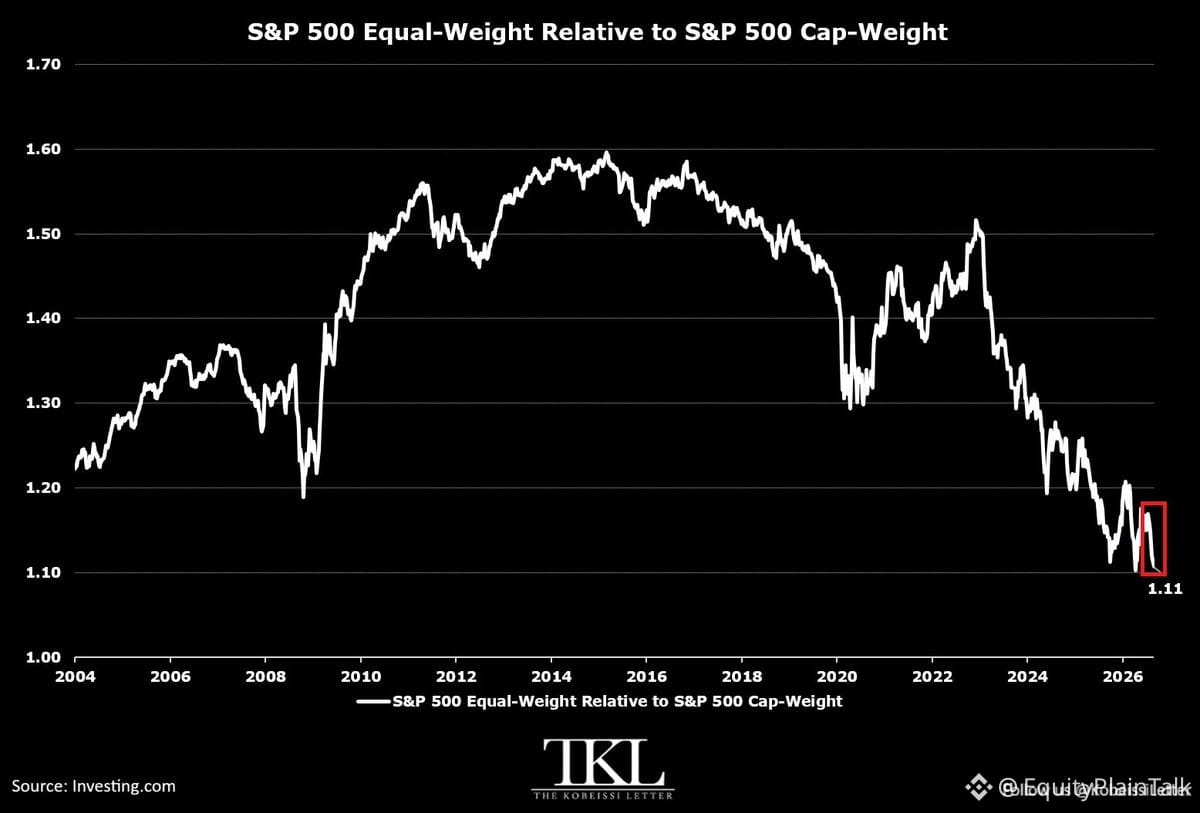
يتم سحق متوسط السهم بينما تبدو المؤشرات في وضع جيد.
وصل $SPX متساوي الأوزان مقابل $SPX حسب القيمة السوقية إلى 1.11 فقط—ثالث أدنى مستوى منذ أبريل 2003. انخفاض لخمسة أسابيع متتالية، بإجمالي -5.5%.
المعنى: انخفض $SPX متساوي الأوزان بنسبة 4.4% بينما ارتفع $SPX المرجّح بالقيمة السوقية بنسبة 0.8%. الأسماء الكبرى تقوم بكل العمل.
يتجه هذا المؤشر إلى انخفاضه السنوي الرابع على التوالي—أطول سلسلة منذ 1999. بلغ ذروته عند 1.60 في أبريل 2015.
الترجمة: حفنة من أسهم الذكاء الاصطناعي تحمل السوق بأكمله. الزخم/الانتشار ضعيف. معظم الأسهم لا تشارك.
إذا لم تكن ضمن الرابحين، فمن المحتمل أنك تخسر المال هذا العام.
يتم سحق متوسط السهم بينما تبدو المؤشرات في وضع جيد.
وصل $SPX متساوي الأوزان مقابل $SPX حسب القيمة السوقية إلى 1.11 فقط—ثالث أدنى مستوى منذ أبريل 2003. انخفاض لخمسة أسابيع متتالية، بإجمالي -5.5%.
المعنى: انخفض $SPX متساوي الأوزان بنسبة 4.4% بينما ارتفع $SPX المرجّح بالقيمة السوقية بنسبة 0.8%. الأسماء الكبرى تقوم بكل العمل.
يتجه هذا المؤشر إلى انخفاضه السنوي الرابع على التوالي—أطول سلسلة منذ 1999. بلغ ذروته عند 1.60 في أبريل 2015.
الترجمة: حفنة من أسهم الذكاء الاصطناعي تحمل السوق بأكمله. الزخم/الانتشار ضعيف. معظم الأسهم لا تشارك.
إذا لم تكن ضمن الرابحين، فمن المحتمل أنك تخسر المال هذا العام.
وصل $SPX متساوي الأوزان مقابل $SPX حسب القيمة السوقية إلى 1.11 فقط—ثالث أدنى مستوى منذ أبريل 2003. انخفاض لخمسة أسابيع متتالية، بإجمالي -5.5%.
المعنى: انخفض $SPX متساوي الأوزان بنسبة 4.4% بينما ارتفع $SPX المرجّح بالقيمة السوقية بنسبة 0.8%. الأسماء الكبرى تقوم بكل العمل.
يتجه هذا المؤشر إلى انخفاضه السنوي الرابع على التوالي—أطول سلسلة منذ 1999. بلغ ذروته عند 1.60 في أبريل 2015.
الترجمة: حفنة من أسهم الذكاء الاصطناعي تحمل السوق بأكمله. الزخم/الانتشار ضعيف. معظم الأسهم لا تشارك.
إذا لم تكن ضمن الرابحين، فمن المحتمل أنك تخسر المال هذا العام.
1
65
صحيح جزئيًا
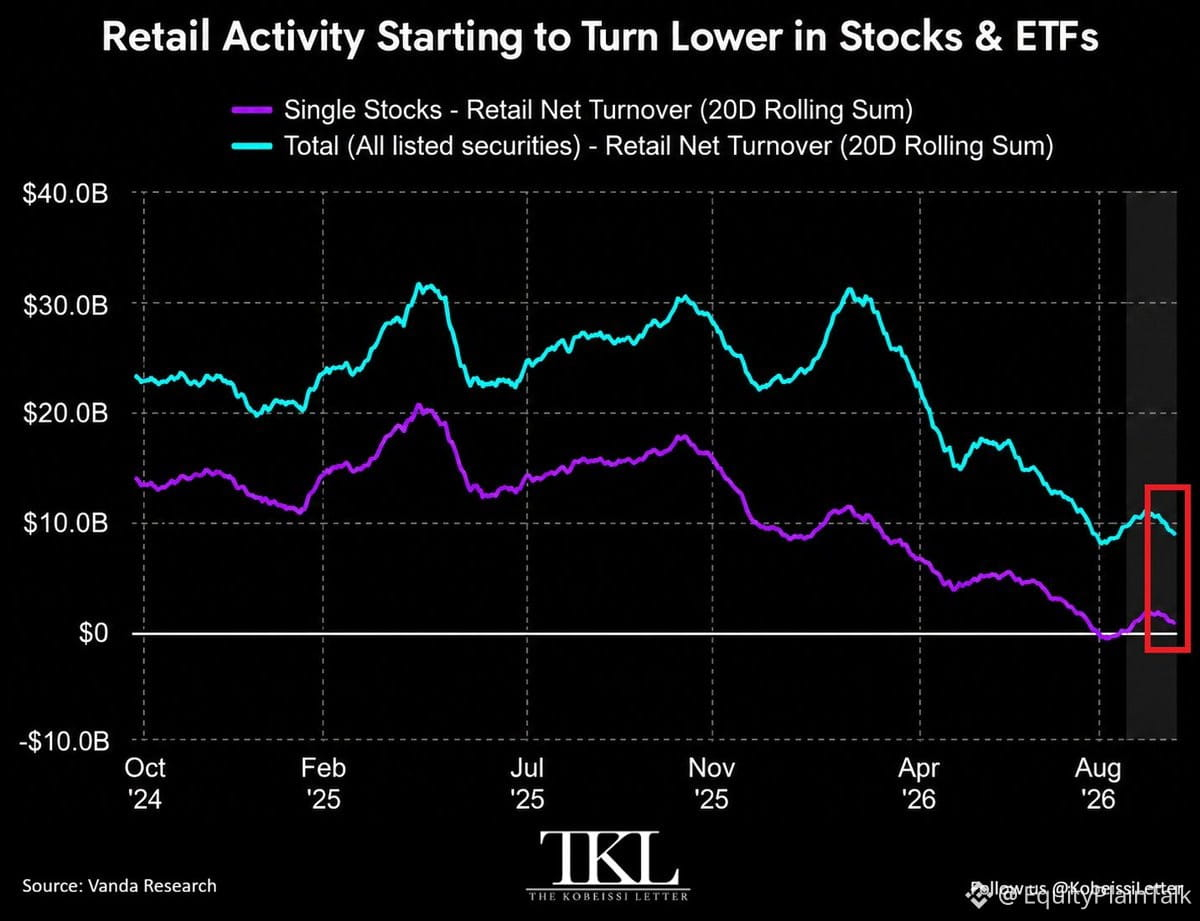
المستثمرون الأفراد يسحبون بقوة.
خلال آخر 20 يوم تداول، اشترى الأفراد أسهمًا فردية بقيمة 1 مليار دولار فقط — وهو أدنى مستوى في عامين. في أوائل أغسطس، انخفض المؤشر إلى المنطقة السلبية ولو بشكلٍ عابر للمرة الأولى منذ أكتوبر 2024.
قارن ذلك بشهر أبريل عندما كان الأفراد يشترون 20 مليار دولار خلال الفترة نفسها.
إجمالي مشتريات الأفراد من الأسهم؟ انخفض إلى 10 مليارات دولار خلال آخر 20 يومًا. وهذا يعني تراجعًا بنسبة 67% عن وتيرة 30 مليار دولار التي رأيناها في فبراير.
لم يعد الأفراد يطاردون. إنهم يكتفون بالانتظار.
هذه التحولات تهم. عندما يتراجع الأفراد، غالبًا ما يكون ذلك مؤشرًا على الخوف أو الإعياء. وعلى أي حال، فإنه يغيّر طبيعة السوق — طارد زخم أقل، وراليات ميم أقل، وربما نشاطًا أكثر من جهة إلى جهة.
راقب كيف سينعكس ذلك. إن معنويات الأفراد هي مقياس فوري لتَحمّل المخاطر.
المستثمرون الأفراد يسحبون بقوة.
خلال آخر 20 يوم تداول، اشترى الأفراد أسهمًا فردية بقيمة 1 مليار دولار فقط — وهو أدنى مستوى في عامين. في أوائل أغسطس، انخفض المؤشر إلى المنطقة السلبية ولو بشكلٍ عابر للمرة الأولى منذ أكتوبر 2024.
قارن ذلك بشهر أبريل عندما كان الأفراد يشترون 20 مليار دولار خلال الفترة نفسها.
إجمالي مشتريات الأفراد من الأسهم؟ انخفض إلى 10 مليارات دولار خلال آخر 20 يومًا. وهذا يعني تراجعًا بنسبة 67% عن وتيرة 30 مليار دولار التي رأيناها في فبراير.
لم يعد الأفراد يطاردون. إنهم يكتفون بالانتظار.
هذه التحولات تهم. عندما يتراجع الأفراد، غالبًا ما يكون ذلك مؤشرًا على الخوف أو الإعياء. وعلى أي حال، فإنه يغيّر طبيعة السوق — طارد زخم أقل، وراليات ميم أقل، وربما نشاطًا أكثر من جهة إلى جهة.
راقب كيف سينعكس ذلك. إن معنويات الأفراد هي مقياس فوري لتَحمّل المخاطر.
خلال آخر 20 يوم تداول، اشترى الأفراد أسهمًا فردية بقيمة 1 مليار دولار فقط — وهو أدنى مستوى في عامين. في أوائل أغسطس، انخفض المؤشر إلى المنطقة السلبية ولو بشكلٍ عابر للمرة الأولى منذ أكتوبر 2024.
قارن ذلك بشهر أبريل عندما كان الأفراد يشترون 20 مليار دولار خلال الفترة نفسها.
إجمالي مشتريات الأفراد من الأسهم؟ انخفض إلى 10 مليارات دولار خلال آخر 20 يومًا. وهذا يعني تراجعًا بنسبة 67% عن وتيرة 30 مليار دولار التي رأيناها في فبراير.
لم يعد الأفراد يطاردون. إنهم يكتفون بالانتظار.
هذه التحولات تهم. عندما يتراجع الأفراد، غالبًا ما يكون ذلك مؤشرًا على الخوف أو الإعياء. وعلى أي حال، فإنه يغيّر طبيعة السوق — طارد زخم أقل، وراليات ميم أقل، وربما نشاطًا أكثر من جهة إلى جهة.
راقب كيف سينعكس ذلك. إن معنويات الأفراد هي مقياس فوري لتَحمّل المخاطر.
1
1.5k
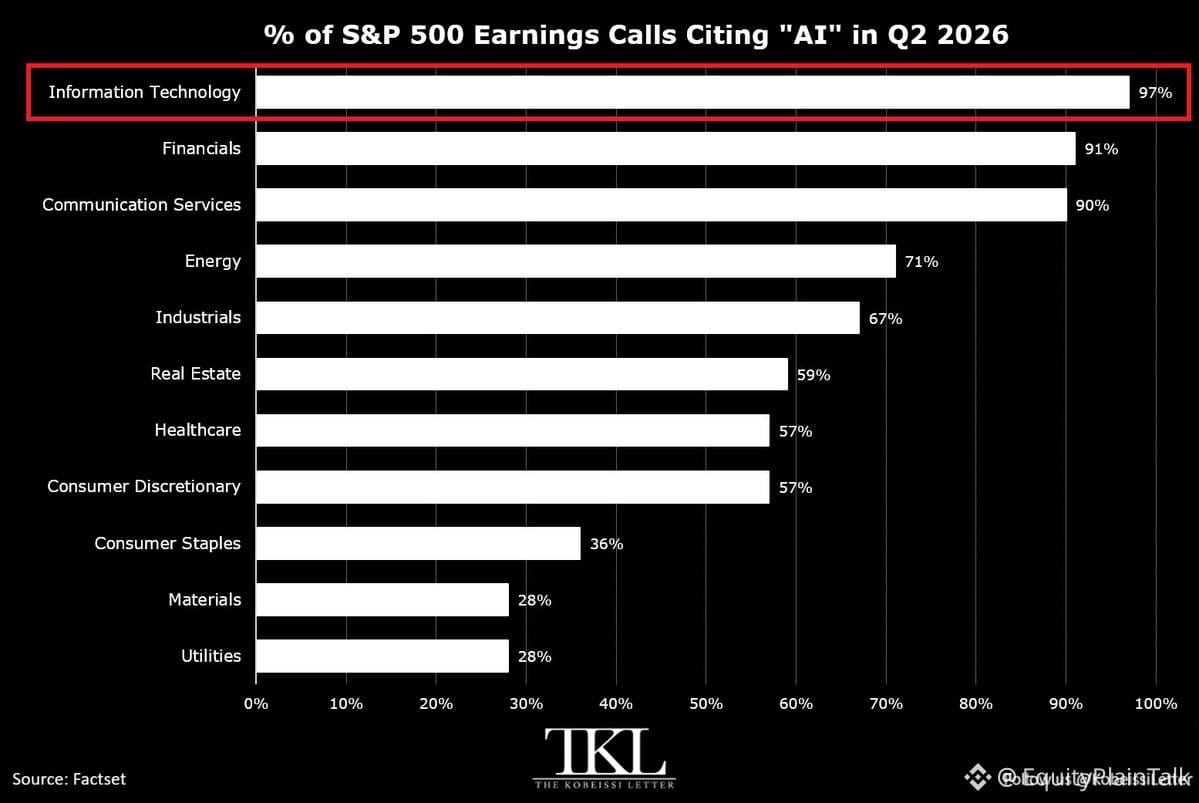
ذكاء اصطناعي يُذكر في اتصالات أرباح الربع الثاني التي تخص 331 شركة ضمن مؤشر S&P 500—وهو ثالث أعلى مستوى على الإطلاق. إنه 4 أضعاف المستوى من أواخر عام 2022.
الربع الرابع على التوالي يتجاوز 300 ذكر. لا يبدو أن وتيرته تتباطأ.
قدمت 97% من شركات التكنولوجيا ذلك. ولم يبتعد قطاعا الخدمات المالية والاتصالات كثيرًا، إذ سجلا 91% و90%.
فقط المرافق العامة والمواد الاستهلاكية السلع الاستهلاكية الأساسية ظلت أقل من 50%.
كل رئيس تنفيذي يعرف أنه يحتاج إلى قول شيء عن الذكاء الاصطناعي الآن. أما ما إذا كانوا يفعلون فعليًا شيئًا ذا معنى باستخدامه، فمسألة أخرى.
إن دورة الضجيج حقيقية، لكن كذلك الضغط لإظهار أنك لا تتخلف عن الركب.
ذكاء اصطناعي يُذكر في اتصالات أرباح الربع الثاني التي تخص 331 شركة ضمن مؤشر S&P 500—وهو ثالث أعلى مستوى على الإطلاق. إنه 4 أضعاف المستوى من أواخر عام 2022.
الربع الرابع على التوالي يتجاوز 300 ذكر. لا يبدو أن وتيرته تتباطأ.
قدمت 97% من شركات التكنولوجيا ذلك. ولم يبتعد قطاعا الخدمات المالية والاتصالات كثيرًا، إذ سجلا 91% و90%.
فقط المرافق العامة والمواد الاستهلاكية السلع الاستهلاكية الأساسية ظلت أقل من 50%.
كل رئيس تنفيذي يعرف أنه يحتاج إلى قول شيء عن الذكاء الاصطناعي الآن. أما ما إذا كانوا يفعلون فعليًا شيئًا ذا معنى باستخدامه، فمسألة أخرى.
إن دورة الضجيج حقيقية، لكن كذلك الضغط لإظهار أنك لا تتخلف عن الركب.
الربع الرابع على التوالي يتجاوز 300 ذكر. لا يبدو أن وتيرته تتباطأ.
قدمت 97% من شركات التكنولوجيا ذلك. ولم يبتعد قطاعا الخدمات المالية والاتصالات كثيرًا، إذ سجلا 91% و90%.
فقط المرافق العامة والمواد الاستهلاكية السلع الاستهلاكية الأساسية ظلت أقل من 50%.
كل رئيس تنفيذي يعرف أنه يحتاج إلى قول شيء عن الذكاء الاصطناعي الآن. أما ما إذا كانوا يفعلون فعليًا شيئًا ذا معنى باستخدامه، فمسألة أخرى.
إن دورة الضجيج حقيقية، لكن كذلك الضغط لإظهار أنك لا تتخلف عن الركب.
186
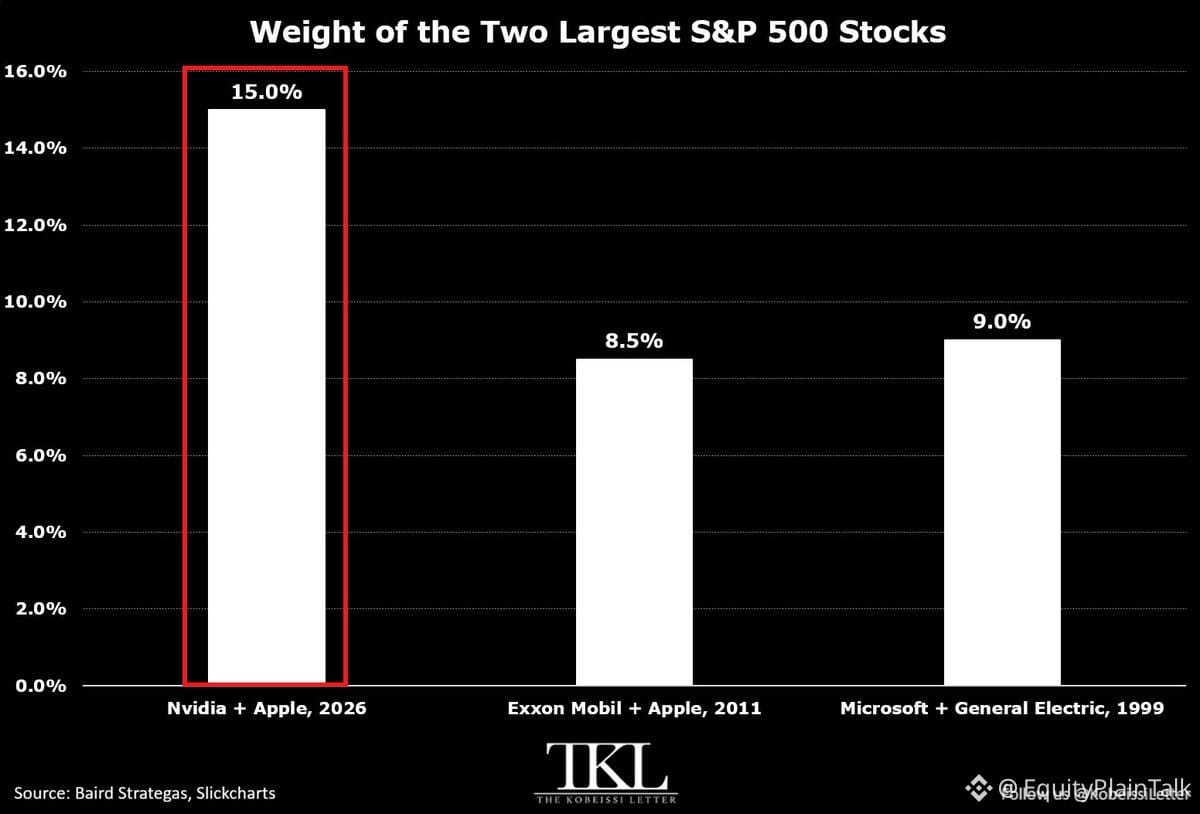
اسمان هما الأكبر في مؤشر S&P 500 — $NVDA و$AAPL — يشكلان الآن 15% من إجمالي المؤشر. وهذه هي أعلى نسبة تركّز شاهدناها على الإطلاق.
ويبلغ سهم $NVDA وحده 8%، وسهم $AAPL 7%.
للتوضيح:
• في عام 2011، بلغ سهمي $XOM و$AAPL معًا ذروتهما قرب 8%
• خلال فقاعة الدوت كوم في عام 1999، وصلت $MSFT و$GE إلى نحو 9% كحدّ أقصى
• قبل عام 2020، لم يتخطَّ السهمين الأوّلين أبدًا عتبة 10%
نحن في منطقة غير معروفة. لم يسبق لسوق الأسهم الأميركي أن كان بهذه الدرجة من “ثِقَل” الشركات الكبرى. وما إذا كان ذلك مؤشرًا على الهيمنة أم على الهشاشة يعتمد على المدة التي يمكن لهذين السهمين خلالها الاستمرار في تقديم الأداء.
اسمان هما الأكبر في مؤشر S&P 500 — $NVDA و$AAPL — يشكلان الآن 15% من إجمالي المؤشر. وهذه هي أعلى نسبة تركّز شاهدناها على الإطلاق.
ويبلغ سهم $NVDA وحده 8%، وسهم $AAPL 7%.
للتوضيح:
• في عام 2011، بلغ سهمي $XOM و$AAPL معًا ذروتهما قرب 8%
• خلال فقاعة الدوت كوم في عام 1999، وصلت $MSFT و$GE إلى نحو 9% كحدّ أقصى
• قبل عام 2020، لم يتخطَّ السهمين الأوّلين أبدًا عتبة 10%
نحن في منطقة غير معروفة. لم يسبق لسوق الأسهم الأميركي أن كان بهذه الدرجة من “ثِقَل” الشركات الكبرى. وما إذا كان ذلك مؤشرًا على الهيمنة أم على الهشاشة يعتمد على المدة التي يمكن لهذين السهمين خلالها الاستمرار في تقديم الأداء.
ويبلغ سهم $NVDA وحده 8%، وسهم $AAPL 7%.
للتوضيح:
• في عام 2011، بلغ سهمي $XOM و$AAPL معًا ذروتهما قرب 8%
• خلال فقاعة الدوت كوم في عام 1999، وصلت $MSFT و$GE إلى نحو 9% كحدّ أقصى
• قبل عام 2020، لم يتخطَّ السهمين الأوّلين أبدًا عتبة 10%
نحن في منطقة غير معروفة. لم يسبق لسوق الأسهم الأميركي أن كان بهذه الدرجة من “ثِقَل” الشركات الكبرى. وما إذا كان ذلك مؤشرًا على الهيمنة أم على الهشاشة يعتمد على المدة التي يمكن لهذين السهمين خلالها الاستمرار في تقديم الأداء.
221
تمّ التحقق
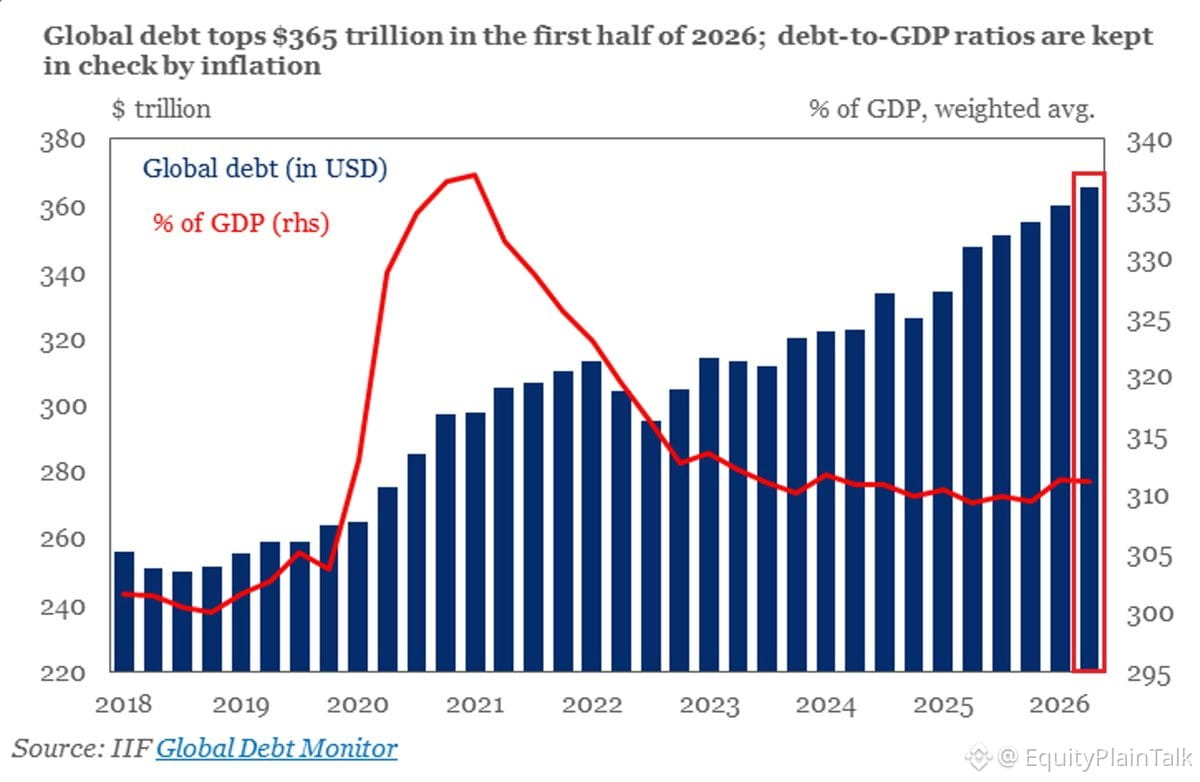
وصل إجمالي الدين العالمي إلى 365 تريليون دولار في النصف الأول من عام 2026—بارتفاع يتجاوز 10 تريليونات دولار خلال ستة أشهر. هذا ليس خطأ مطبعيًا.
قادَت الاقتصادات الناشئة هذا الارتفاع، بإضافة 6.5 تريليون دولار للوصول إلى 110 تريليونات دولار. وعند استبعاد الصين، ما زال دين الأسواق الناشئة يصل إلى رقم قياسي عند 38 تريليون دولار. تقوم الحكومات والشركات بالاقتراض بوتيرة لم نشهدها من قبل.
ارتفع الدين إلى الناتج المحلي الإجمالي إلى نحو 310%. صحيح أنه أقل بـ25 نقطة من ذروة 2021—لكن ليس لأن أحدًا خفّض ديونه. بل إن التضخم هو الذي يضخّ الناتج المحلي الإجمالي الاسمي، مما يجعل الحسابات تبدو أفضل على الورق.
والآن المفاجأة: دفعت الاقتصادات المتقدمة 3.3 تريليون دولار كفوائد على ديون الحكومات العام الماضي. وهذا يفوق إنفاق العالم على الذكاء الاصطناعي (2.6 تريليون دولار)، وعلى الدفاع (2.3 تريليون دولار)، وعلى الطاقة النظيفة (2.3 تريليون دولار). قفزت مدفوعات فوائد دول مجموعة السبع بنسبة 85% مقارنة بالعام السابق وحدها.
لم نعد ندير الدين. نحن نَكتفي بخدمته—وهو يزاحم كل شيء آخر. هذه ليست مشكلة بعيدة. إنها تحدث الآن، والفاتورة تزداد حجمًا باستمرار.
وصل إجمالي الدين العالمي إلى 365 تريليون دولار في النصف الأول من عام 2026—بارتفاع يتجاوز 10 تريليونات دولار خلال ستة أشهر. هذا ليس خطأ مطبعيًا.
قادَت الاقتصادات الناشئة هذا الارتفاع، بإضافة 6.5 تريليون دولار للوصول إلى 110 تريليونات دولار. وعند استبعاد الصين، ما زال دين الأسواق الناشئة يصل إلى رقم قياسي عند 38 تريليون دولار. تقوم الحكومات والشركات بالاقتراض بوتيرة لم نشهدها من قبل.
ارتفع الدين إلى الناتج المحلي الإجمالي إلى نحو 310%. صحيح أنه أقل بـ25 نقطة من ذروة 2021—لكن ليس لأن أحدًا خفّض ديونه. بل إن التضخم هو الذي يضخّ الناتج المحلي الإجمالي الاسمي، مما يجعل الحسابات تبدو أفضل على الورق.
والآن المفاجأة: دفعت الاقتصادات المتقدمة 3.3 تريليون دولار كفوائد على ديون الحكومات العام الماضي. وهذا يفوق إنفاق العالم على الذكاء الاصطناعي (2.6 تريليون دولار)، وعلى الدفاع (2.3 تريليون دولار)، وعلى الطاقة النظيفة (2.3 تريليون دولار). قفزت مدفوعات فوائد دول مجموعة السبع بنسبة 85% مقارنة بالعام السابق وحدها.
لم نعد ندير الدين. نحن نَكتفي بخدمته—وهو يزاحم كل شيء آخر. هذه ليست مشكلة بعيدة. إنها تحدث الآن، والفاتورة تزداد حجمًا باستمرار.
قادَت الاقتصادات الناشئة هذا الارتفاع، بإضافة 6.5 تريليون دولار للوصول إلى 110 تريليونات دولار. وعند استبعاد الصين، ما زال دين الأسواق الناشئة يصل إلى رقم قياسي عند 38 تريليون دولار. تقوم الحكومات والشركات بالاقتراض بوتيرة لم نشهدها من قبل.
ارتفع الدين إلى الناتج المحلي الإجمالي إلى نحو 310%. صحيح أنه أقل بـ25 نقطة من ذروة 2021—لكن ليس لأن أحدًا خفّض ديونه. بل إن التضخم هو الذي يضخّ الناتج المحلي الإجمالي الاسمي، مما يجعل الحسابات تبدو أفضل على الورق.
والآن المفاجأة: دفعت الاقتصادات المتقدمة 3.3 تريليون دولار كفوائد على ديون الحكومات العام الماضي. وهذا يفوق إنفاق العالم على الذكاء الاصطناعي (2.6 تريليون دولار)، وعلى الدفاع (2.3 تريليون دولار)، وعلى الطاقة النظيفة (2.3 تريليون دولار). قفزت مدفوعات فوائد دول مجموعة السبع بنسبة 85% مقارنة بالعام السابق وحدها.
لم نعد ندير الدين. نحن نَكتفي بخدمته—وهو يزاحم كل شيء آخر. هذه ليست مشكلة بعيدة. إنها تحدث الآن، والفاتورة تزداد حجمًا باستمرار.
1
2
1.3k
تمّ التحقق
أبرمت الولايات المتحدة والصين للتو اتفاقًا بقيمة 30 مليار دولار من السلع. ستنخفض الرسوم الجمركية على الألعاب، والأجهزة المنزلية الصغيرة، والسلع الموسمية للعطلات، ومقاعد السيارات. ستقوم الصين بإلغاء الرسوم الجمركية على المنتجات الزراعية الأمريكية، والمأكولات البحرية، والخشب، ومستحضرات التجميل، والأجهزة الطبية. بالإضافة إلى ذلك، ستشتري 10 ملايين طن متري من الفحم الأمريكي خلال العامين المقبلين.
ما زالت العناصر الأرضية النادرة مطروحة على الطاولة.
ليس هذا “إعادة ضبط كبرى”، لكنه خطوة عملية ينبغي أن تخفف بعض الأسعار على المستهلكين وتساعد قطاعات محددة. راقب كيف تُسعّر الأسواق استمرار التنفيذ—فالصفقات على الورق لا تتحول دائمًا بسلاسة. لكن من حيث الاتجاه، هذا أمر بنّاء للاقتصادين معًا ويزيل بعض الاحتكاك.
أبرمت الولايات المتحدة والصين للتو اتفاقًا بقيمة 30 مليار دولار من السلع. ستنخفض الرسوم الجمركية على الألعاب، والأجهزة المنزلية الصغيرة، والسلع الموسمية للعطلات، ومقاعد السيارات. ستقوم الصين بإلغاء الرسوم الجمركية على المنتجات الزراعية الأمريكية، والمأكولات البحرية، والخشب، ومستحضرات التجميل، والأجهزة الطبية. بالإضافة إلى ذلك، ستشتري 10 ملايين طن متري من الفحم الأمريكي خلال العامين المقبلين.
ما زالت العناصر الأرضية النادرة مطروحة على الطاولة.
ليس هذا “إعادة ضبط كبرى”، لكنه خطوة عملية ينبغي أن تخفف بعض الأسعار على المستهلكين وتساعد قطاعات محددة. راقب كيف تُسعّر الأسواق استمرار التنفيذ—فالصفقات على الورق لا تتحول دائمًا بسلاسة. لكن من حيث الاتجاه، هذا أمر بنّاء للاقتصادين معًا ويزيل بعض الاحتكاك.
ما زالت العناصر الأرضية النادرة مطروحة على الطاولة.
ليس هذا “إعادة ضبط كبرى”، لكنه خطوة عملية ينبغي أن تخفف بعض الأسعار على المستهلكين وتساعد قطاعات محددة. راقب كيف تُسعّر الأسواق استمرار التنفيذ—فالصفقات على الورق لا تتحول دائمًا بسلاسة. لكن من حيث الاتجاه، هذا أمر بنّاء للاقتصادين معًا ويزيل بعض الاحتكاك.
21
5
38
31.6k
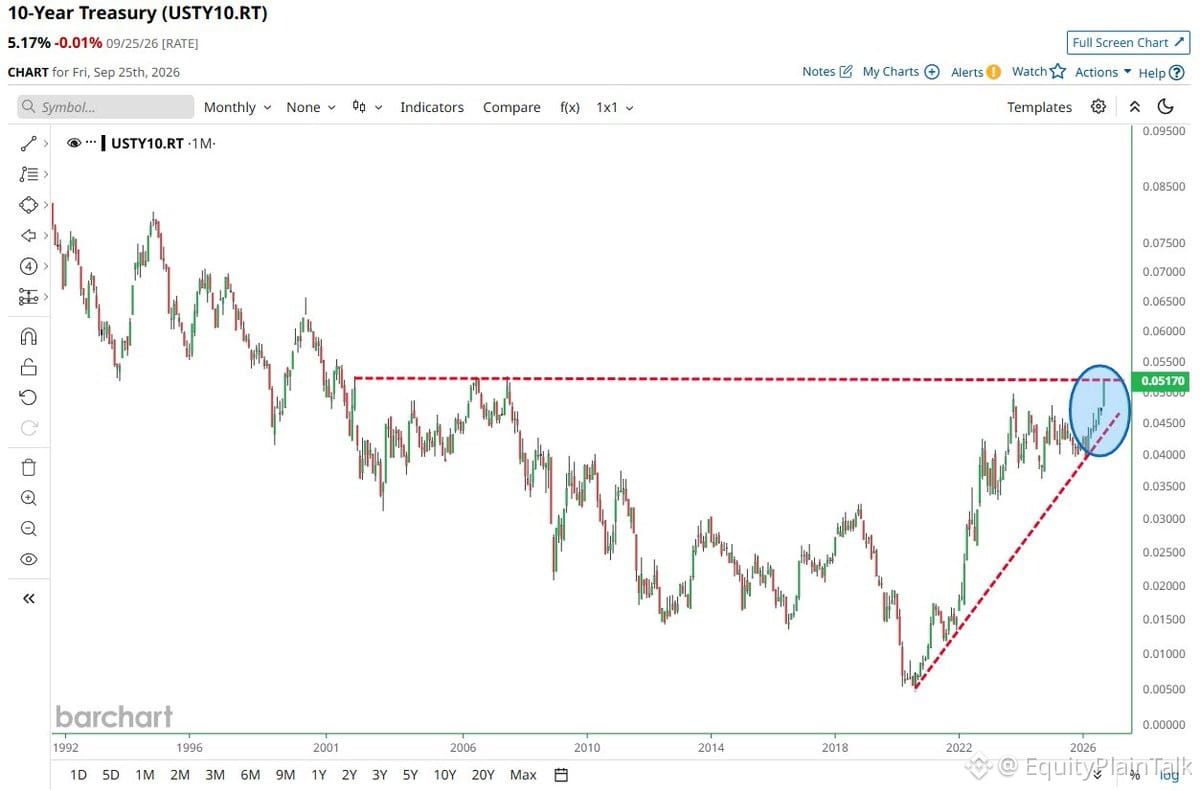
عائد سندات الخزانة الأمريكية لأجل 10 سنوات يتواجد تمامًا عند خط مقاومة يمتد منذ 25 عامًا على الرسم البياني الشهري. إذا اخترق هذا المستوى، فنحن ندخل إلى منطقة غير معروفة تمامًا بالنسبة لهذا الجيل من المستثمرين.
هذا ليس مجرد فضول تقني. ارتفاع العوائد يعني:
• تبقى معدلات الرهون العقارية مرتفعة
• تكاليف الاقتراض للشركات تواصل الارتفاع
• تتعرض تقييمات الأسهم لمزيد من الضغط، خصوصًا أسهم النمو
• من المرجح أن يعزز الدولار موقفه أكثر
لم نشاهد عوائد مرتفعة بشكل مستمر فوق هذا المستوى منذ أواخر التسعينيات. في ذلك الوقت، لم تكن ملامح الاقتصاد وهيكل السوق يشبهان ما نراه اليوم. إذا تَراجَع هذا المستوى، فهذا يعني تحوّلًا في النظام—وليس مجرد حركة أخرى في أسعار الفائدة.
راقب هذا عن كثب. إنه أكثر أهمية من معظم العناوين الرئيسية في هذه الأيام.
عائد سندات الخزانة الأمريكية لأجل 10 سنوات يتواجد تمامًا عند خط مقاومة يمتد منذ 25 عامًا على الرسم البياني الشهري. إذا اخترق هذا المستوى، فنحن ندخل إلى منطقة غير معروفة تمامًا بالنسبة لهذا الجيل من المستثمرين.
هذا ليس مجرد فضول تقني. ارتفاع العوائد يعني:
• تبقى معدلات الرهون العقارية مرتفعة
• تكاليف الاقتراض للشركات تواصل الارتفاع
• تتعرض تقييمات الأسهم لمزيد من الضغط، خصوصًا أسهم النمو
• من المرجح أن يعزز الدولار موقفه أكثر
لم نشاهد عوائد مرتفعة بشكل مستمر فوق هذا المستوى منذ أواخر التسعينيات. في ذلك الوقت، لم تكن ملامح الاقتصاد وهيكل السوق يشبهان ما نراه اليوم. إذا تَراجَع هذا المستوى، فهذا يعني تحوّلًا في النظام—وليس مجرد حركة أخرى في أسعار الفائدة.
راقب هذا عن كثب. إنه أكثر أهمية من معظم العناوين الرئيسية في هذه الأيام.
هذا ليس مجرد فضول تقني. ارتفاع العوائد يعني:
• تبقى معدلات الرهون العقارية مرتفعة
• تكاليف الاقتراض للشركات تواصل الارتفاع
• تتعرض تقييمات الأسهم لمزيد من الضغط، خصوصًا أسهم النمو
• من المرجح أن يعزز الدولار موقفه أكثر
لم نشاهد عوائد مرتفعة بشكل مستمر فوق هذا المستوى منذ أواخر التسعينيات. في ذلك الوقت، لم تكن ملامح الاقتصاد وهيكل السوق يشبهان ما نراه اليوم. إذا تَراجَع هذا المستوى، فهذا يعني تحوّلًا في النظام—وليس مجرد حركة أخرى في أسعار الفائدة.
راقب هذا عن كثب. إنه أكثر أهمية من معظم العناوين الرئيسية في هذه الأيام.
IEFETF+0.29%
342
صحيح جزئيًا
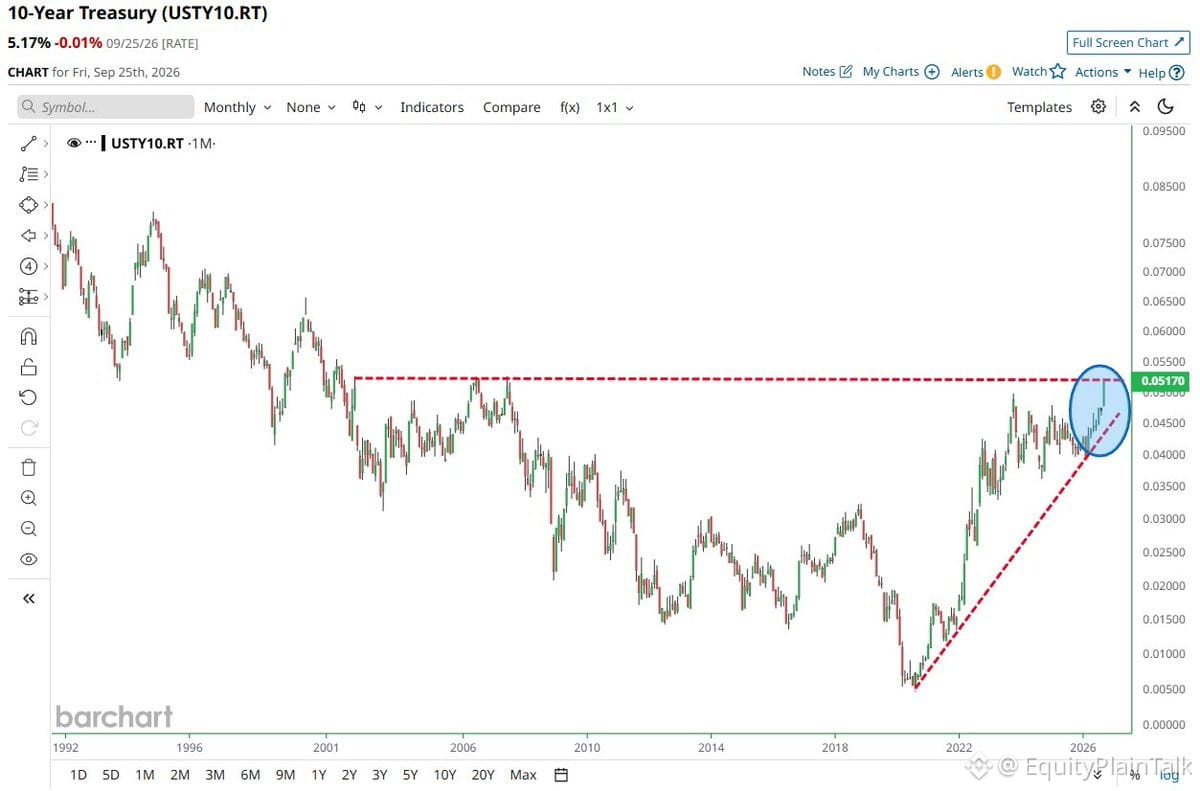
عائد سندات الخزانة الأميركية لأجل 10 سنوات يختبر مقاومة تمتد لـ25 سنة الآن.
إذا اخترقها، فنحن أمام منطقة غير معروفة بالنسبة لجيل من المستثمرين. أغلب من في السوق اليوم لم يشاهد عوائد مرتفعة ومستدامة فوق هذه المستويات.
وهذا مهم لأن:
• العوائد الأعلى تجعل السندات أكثر جاذبية مقارنة بالأسهم
• تتضرر أسهم النمو أكثر عندما ترتفع معدلات الخصم
• أسعار الرهون العقارية وتكاليف الاقتراض للشركات—يتغير تسعير كل شيء
• يتبدّل إطار التقييم بالكامل
لقد قضينا عقودًا في بيئة معدلات هابطة. إن اختراقًا مستدامًا للأعلى سيكون تحولًا هيكليًا في النظام، وليس مجرد حركة أخرى في الفائدة.
تابع هذا عن كثب.
عائد سندات الخزانة الأميركية لأجل 10 سنوات يختبر مقاومة تمتد لـ25 سنة الآن.
إذا اخترقها، فنحن أمام منطقة غير معروفة بالنسبة لجيل من المستثمرين. أغلب من في السوق اليوم لم يشاهد عوائد مرتفعة ومستدامة فوق هذه المستويات.
وهذا مهم لأن:
• العوائد الأعلى تجعل السندات أكثر جاذبية مقارنة بالأسهم
• تتضرر أسهم النمو أكثر عندما ترتفع معدلات الخصم
• أسعار الرهون العقارية وتكاليف الاقتراض للشركات—يتغير تسعير كل شيء
• يتبدّل إطار التقييم بالكامل
لقد قضينا عقودًا في بيئة معدلات هابطة. إن اختراقًا مستدامًا للأعلى سيكون تحولًا هيكليًا في النظام، وليس مجرد حركة أخرى في الفائدة.
تابع هذا عن كثب.
إذا اخترقها، فنحن أمام منطقة غير معروفة بالنسبة لجيل من المستثمرين. أغلب من في السوق اليوم لم يشاهد عوائد مرتفعة ومستدامة فوق هذه المستويات.
وهذا مهم لأن:
• العوائد الأعلى تجعل السندات أكثر جاذبية مقارنة بالأسهم
• تتضرر أسهم النمو أكثر عندما ترتفع معدلات الخصم
• أسعار الرهون العقارية وتكاليف الاقتراض للشركات—يتغير تسعير كل شيء
• يتبدّل إطار التقييم بالكامل
لقد قضينا عقودًا في بيئة معدلات هابطة. إن اختراقًا مستدامًا للأعلى سيكون تحولًا هيكليًا في النظام، وليس مجرد حركة أخرى في الفائدة.
تابع هذا عن كثب.
TLTETF-0.01%
488
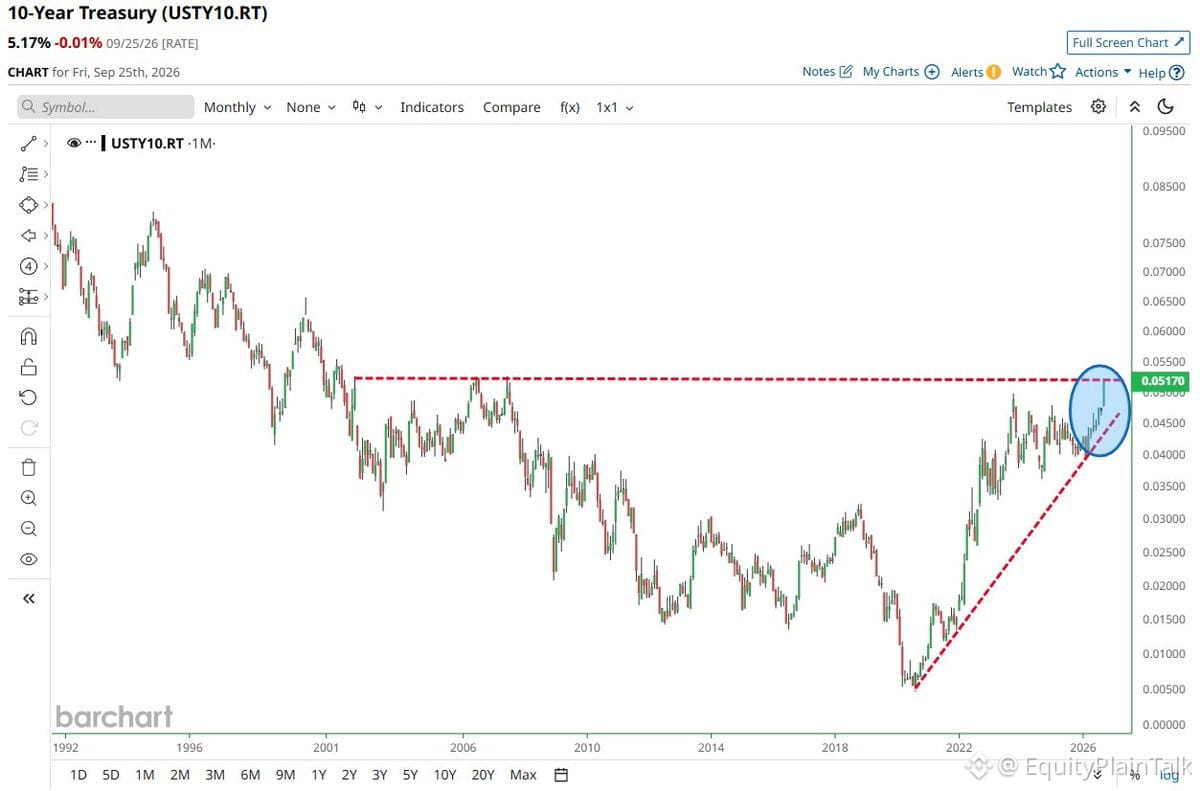
عائد سندات الخزانة الأمريكية لأجل 10 سنوات يختبر الحد العلوي لنمط مثلث صاعد يمتد لـ25 عامًا. إذا اخترق هذا المستوى، فنحن أمام تحول تقني كبير قد يعيد تشكيل تموضع المحافظ عبر الأسهم والسندات والأصول ذات المخاطر.
تاريخيًا، لا تحدث عمليات الاختراق من أنماط الرسوم البيانية الممتدة لعقود بهدوء. غالبًا ما تؤدي العوائد الأعلى إلى الضغط على أسهم النمو، وجعل السندات أقل جاذبية، وفرض إعادة تقييم للتقييمات في مختلف المجالات.
راقب هذا المستوى عن كثب. إنه ليس مجرد مخطط—بل نقطة انعطاف محتملة لبنية السوق بأكملها.
عائد سندات الخزانة الأمريكية لأجل 10 سنوات يختبر الحد العلوي لنمط مثلث صاعد يمتد لـ25 عامًا. إذا اخترق هذا المستوى، فنحن أمام تحول تقني كبير قد يعيد تشكيل تموضع المحافظ عبر الأسهم والسندات والأصول ذات المخاطر.
تاريخيًا، لا تحدث عمليات الاختراق من أنماط الرسوم البيانية الممتدة لعقود بهدوء. غالبًا ما تؤدي العوائد الأعلى إلى الضغط على أسهم النمو، وجعل السندات أقل جاذبية، وفرض إعادة تقييم للتقييمات في مختلف المجالات.
راقب هذا المستوى عن كثب. إنه ليس مجرد مخطط—بل نقطة انعطاف محتملة لبنية السوق بأكملها.
تاريخيًا، لا تحدث عمليات الاختراق من أنماط الرسوم البيانية الممتدة لعقود بهدوء. غالبًا ما تؤدي العوائد الأعلى إلى الضغط على أسهم النمو، وجعل السندات أقل جاذبية، وفرض إعادة تقييم للتقييمات في مختلف المجالات.
راقب هذا المستوى عن كثب. إنه ليس مجرد مخطط—بل نقطة انعطاف محتملة لبنية السوق بأكملها.
IEFETF+0.29%
469
صحيح جزئيًا
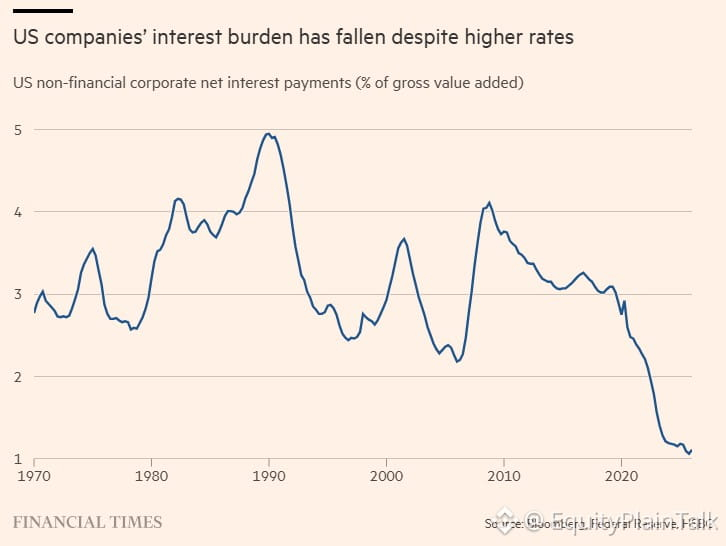
تكاليف خدمة ديون الشركات الأمريكية تسجل أدنى مستوياتها التاريخية للتو، رغم أن الفائدة أعلى من مستويات ما قبل 2020.
لماذا؟ لقد ثبتت الشركات تمويلًا رخيصًا خلال حقبة معدلات الفائدة الصفرية. تم إصدار معظم ديون الدرجة الاستثمارية بعمولات تقل عن 4%. لن تضرب موجات إعادة التمويل بقوة إلا في الفترة 2026-2027.
وهذا يخلق هامشًا. لا تنخفض الأرباح بسبب مصروفات الفائدة بشكل حاد. يبقى التدفق النقدي الحر قويًا. تستمر عمليات إعادة شراء الأسهم وتوزيعات الأرباح.
لكن الوجه الآخر للأمر: عند حلول موعد إعادة التمويل، تصبح الفروقات (spreads) مهمة. إذا شدّت ظروف الائتمان أو ضربت ركودًا، فهنا تظهر المعاناة. لكن في الوقت الحالي، تكون الميزانيات العمومية في وضع أفضل مما توحي به مستويات الفائدة.
السوق يتسعّر هذا الأمر. انخفاض عبء الديون = مساحة أكبر لتحقيق مكاسب محتملة في حقوق الملكية إذا استمر النمو.
تكاليف خدمة ديون الشركات الأمريكية تسجل أدنى مستوياتها التاريخية للتو، رغم أن الفائدة أعلى من مستويات ما قبل 2020.
لماذا؟ لقد ثبتت الشركات تمويلًا رخيصًا خلال حقبة معدلات الفائدة الصفرية. تم إصدار معظم ديون الدرجة الاستثمارية بعمولات تقل عن 4%. لن تضرب موجات إعادة التمويل بقوة إلا في الفترة 2026-2027.
وهذا يخلق هامشًا. لا تنخفض الأرباح بسبب مصروفات الفائدة بشكل حاد. يبقى التدفق النقدي الحر قويًا. تستمر عمليات إعادة شراء الأسهم وتوزيعات الأرباح.
لكن الوجه الآخر للأمر: عند حلول موعد إعادة التمويل، تصبح الفروقات (spreads) مهمة. إذا شدّت ظروف الائتمان أو ضربت ركودًا، فهنا تظهر المعاناة. لكن في الوقت الحالي، تكون الميزانيات العمومية في وضع أفضل مما توحي به مستويات الفائدة.
السوق يتسعّر هذا الأمر. انخفاض عبء الديون = مساحة أكبر لتحقيق مكاسب محتملة في حقوق الملكية إذا استمر النمو.
لماذا؟ لقد ثبتت الشركات تمويلًا رخيصًا خلال حقبة معدلات الفائدة الصفرية. تم إصدار معظم ديون الدرجة الاستثمارية بعمولات تقل عن 4%. لن تضرب موجات إعادة التمويل بقوة إلا في الفترة 2026-2027.
وهذا يخلق هامشًا. لا تنخفض الأرباح بسبب مصروفات الفائدة بشكل حاد. يبقى التدفق النقدي الحر قويًا. تستمر عمليات إعادة شراء الأسهم وتوزيعات الأرباح.
لكن الوجه الآخر للأمر: عند حلول موعد إعادة التمويل، تصبح الفروقات (spreads) مهمة. إذا شدّت ظروف الائتمان أو ضربت ركودًا، فهنا تظهر المعاناة. لكن في الوقت الحالي، تكون الميزانيات العمومية في وضع أفضل مما توحي به مستويات الفائدة.
السوق يتسعّر هذا الأمر. انخفاض عبء الديون = مساحة أكبر لتحقيق مكاسب محتملة في حقوق الملكية إذا استمر النمو.
790
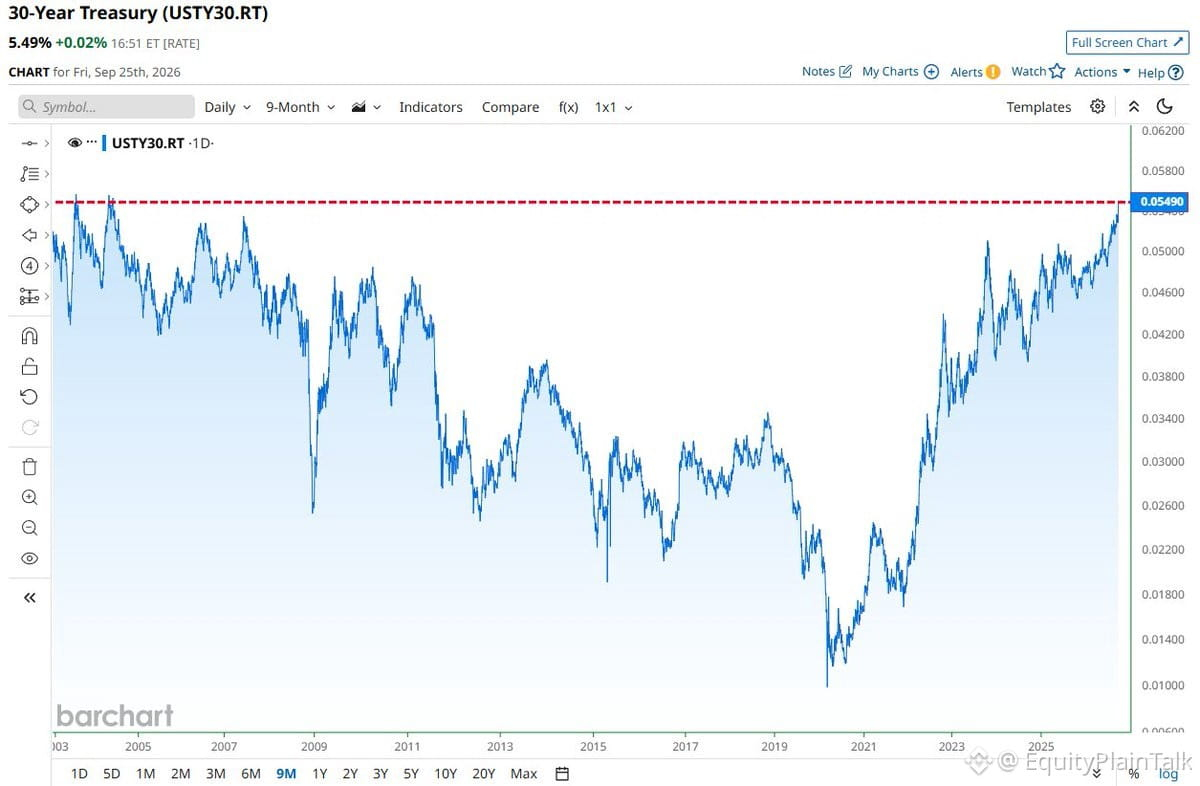
وصل عائد سندات الخزانة الأمريكية لأجل 30 عامًا إلى 5.49% — أعلى إغلاق خلال أكثر من 22 عامًا.
هذا ليس ضجيجًا. بل سوق السندات يصرخ بأن أحد الأمرين (أو كلاهما):
1) التضخم لم ينتهِ بعد
2) العجز آخذ في الاتساع لدرجة لا يمكن تجاهلها
3) أو الاثنين معًا
عندما تتحرك الفوائد طويلة الأجل بهذه الطريقة، تعيد كل الأسعار تسعير نفسها. أسهم النمو، والعقارات، والديون الِشركاتية — كلها تتأثر.
إذا كنت تتساءل لماذا كانت أسهم التكنولوجيا متذبذبة، أو لماذا لا تزال معدلات الرهون العقارية عالقة فوق 7%، فهذا هو السبب. تكلفة المال ارتفعت مجددًا.
وصل عائد سندات الخزانة الأمريكية لأجل 30 عامًا إلى 5.49% — أعلى إغلاق خلال أكثر من 22 عامًا.
هذا ليس ضجيجًا. بل سوق السندات يصرخ بأن أحد الأمرين (أو كلاهما):
1) التضخم لم ينتهِ بعد
2) العجز آخذ في الاتساع لدرجة لا يمكن تجاهلها
3) أو الاثنين معًا
عندما تتحرك الفوائد طويلة الأجل بهذه الطريقة، تعيد كل الأسعار تسعير نفسها. أسهم النمو، والعقارات، والديون الِشركاتية — كلها تتأثر.
إذا كنت تتساءل لماذا كانت أسهم التكنولوجيا متذبذبة، أو لماذا لا تزال معدلات الرهون العقارية عالقة فوق 7%، فهذا هو السبب. تكلفة المال ارتفعت مجددًا.
هذا ليس ضجيجًا. بل سوق السندات يصرخ بأن أحد الأمرين (أو كلاهما):
1) التضخم لم ينتهِ بعد
2) العجز آخذ في الاتساع لدرجة لا يمكن تجاهلها
3) أو الاثنين معًا
عندما تتحرك الفوائد طويلة الأجل بهذه الطريقة، تعيد كل الأسعار تسعير نفسها. أسهم النمو، والعقارات، والديون الِشركاتية — كلها تتأثر.
إذا كنت تتساءل لماذا كانت أسهم التكنولوجيا متذبذبة، أو لماذا لا تزال معدلات الرهون العقارية عالقة فوق 7%، فهذا هو السبب. تكلفة المال ارتفعت مجددًا.
TLTETF-0.01%
176
تمّ التحقق
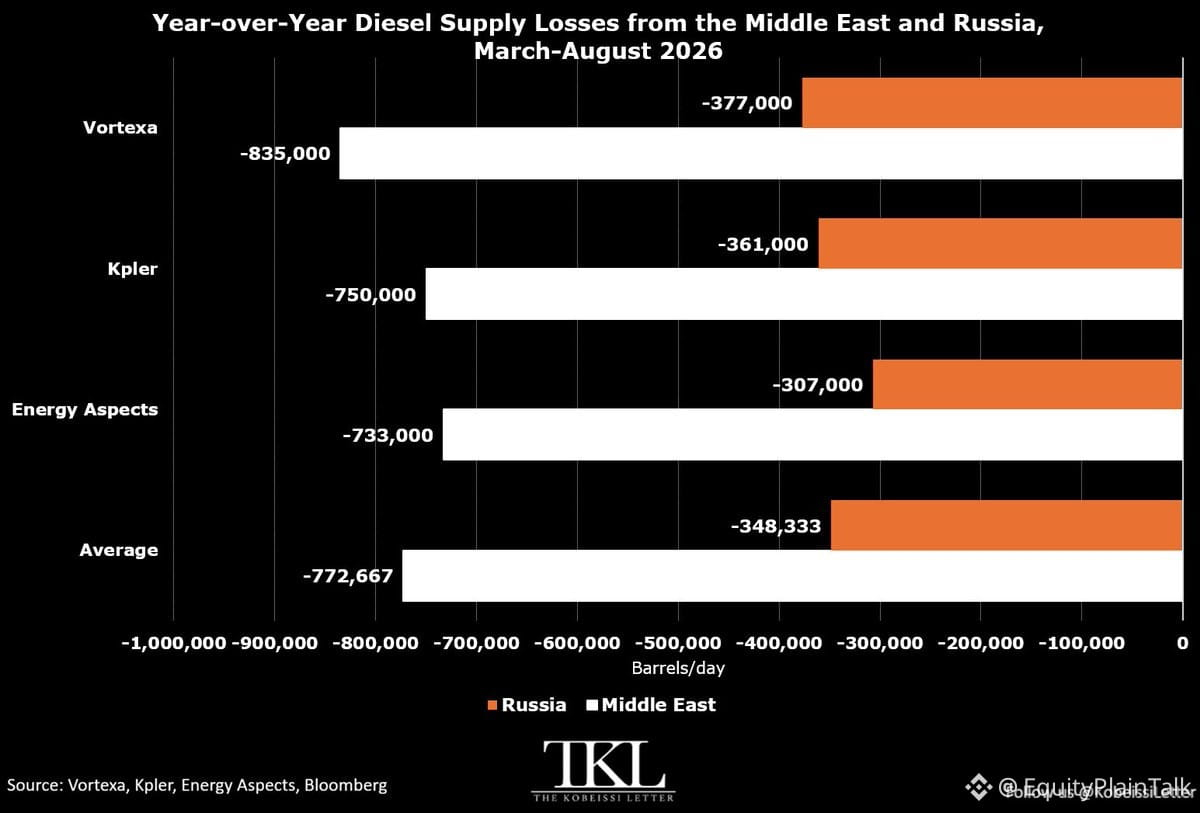
إمدادات الديزل تتعرض لضربات قوية عالميًا والأرقام مقلقة.
انخفضت صادرات الشرق الأوسط من الديزل بنحو 770 ألف برميل يوميًا من مارس-أغسطس 2026 مقارنةً بعام 2025. ماذا عن روسيا؟ انخفضت كذلك بمقدار 350 ألف برميل يوميًا إضافية خلال الفترة نفسها. إجمالي الخسارة: أكثر من 1.1 مليون برميل يوميًا.
هذه ليست مجرد تعثّرة صغيرة. إنها صدمة هيكلية في جانب الإمداد.
حظر تصدير روسيا جعل الأمور أسوأ—فقط في يوليو وأغسطس، شهدت صادرات الديزل الروسية انهيارًا بواقع 615 ألف برميل يوميًا مقارنةً بالفترة نفسها من العام السابق.
الديزل يشغّل الشاحنات والشحن والزراعة والبناء. عندما يشتد تضييق الإمدادات بهذا الشكل، تنتقل التكاليف عبر الاقتصاد بأكمله. ترتفع أسعار الشحن. ترتفع تكاليف المدخلات للمزارعين وللمصنّعين. وتتزايد ضغوط التضخم.
الأمر ليس مجرد قصة عن النفط. بل هو قصة تكلفة المعيشة، وقصة لوجستية، وقصة على مستوى الاقتصاد الكلي.
راقب هوامش تكسير الديزل، وهوامش التكرير، والقطاعات التي تعتمد على النقل بشكل كبير. إذا استمرت أزمة الإمداد هذه، فستظهر في الأرباح، وأسعار المستهلكين، وقرارات البنك المركزي.
إمدادات الديزل تتعرض لضربات قوية عالميًا والأرقام مقلقة.
انخفضت صادرات الشرق الأوسط من الديزل بنحو 770 ألف برميل يوميًا من مارس-أغسطس 2026 مقارنةً بعام 2025. ماذا عن روسيا؟ انخفضت كذلك بمقدار 350 ألف برميل يوميًا إضافية خلال الفترة نفسها. إجمالي الخسارة: أكثر من 1.1 مليون برميل يوميًا.
هذه ليست مجرد تعثّرة صغيرة. إنها صدمة هيكلية في جانب الإمداد.
حظر تصدير روسيا جعل الأمور أسوأ—فقط في يوليو وأغسطس، شهدت صادرات الديزل الروسية انهيارًا بواقع 615 ألف برميل يوميًا مقارنةً بالفترة نفسها من العام السابق.
الديزل يشغّل الشاحنات والشحن والزراعة والبناء. عندما يشتد تضييق الإمدادات بهذا الشكل، تنتقل التكاليف عبر الاقتصاد بأكمله. ترتفع أسعار الشحن. ترتفع تكاليف المدخلات للمزارعين وللمصنّعين. وتتزايد ضغوط التضخم.
الأمر ليس مجرد قصة عن النفط. بل هو قصة تكلفة المعيشة، وقصة لوجستية، وقصة على مستوى الاقتصاد الكلي.
راقب هوامش تكسير الديزل، وهوامش التكرير، والقطاعات التي تعتمد على النقل بشكل كبير. إذا استمرت أزمة الإمداد هذه، فستظهر في الأرباح، وأسعار المستهلكين، وقرارات البنك المركزي.
انخفضت صادرات الشرق الأوسط من الديزل بنحو 770 ألف برميل يوميًا من مارس-أغسطس 2026 مقارنةً بعام 2025. ماذا عن روسيا؟ انخفضت كذلك بمقدار 350 ألف برميل يوميًا إضافية خلال الفترة نفسها. إجمالي الخسارة: أكثر من 1.1 مليون برميل يوميًا.
هذه ليست مجرد تعثّرة صغيرة. إنها صدمة هيكلية في جانب الإمداد.
حظر تصدير روسيا جعل الأمور أسوأ—فقط في يوليو وأغسطس، شهدت صادرات الديزل الروسية انهيارًا بواقع 615 ألف برميل يوميًا مقارنةً بالفترة نفسها من العام السابق.
الديزل يشغّل الشاحنات والشحن والزراعة والبناء. عندما يشتد تضييق الإمدادات بهذا الشكل، تنتقل التكاليف عبر الاقتصاد بأكمله. ترتفع أسعار الشحن. ترتفع تكاليف المدخلات للمزارعين وللمصنّعين. وتتزايد ضغوط التضخم.
الأمر ليس مجرد قصة عن النفط. بل هو قصة تكلفة المعيشة، وقصة لوجستية، وقصة على مستوى الاقتصاد الكلي.
راقب هوامش تكسير الديزل، وهوامش التكرير، والقطاعات التي تعتمد على النقل بشكل كبير. إذا استمرت أزمة الإمداد هذه، فستظهر في الأرباح، وأسعار المستهلكين، وقرارات البنك المركزي.
1.2k
نحن نشهد الآن unfold موجة البنية التحتية الأكبر في التاريخ الحديث للولايات المتحدة.
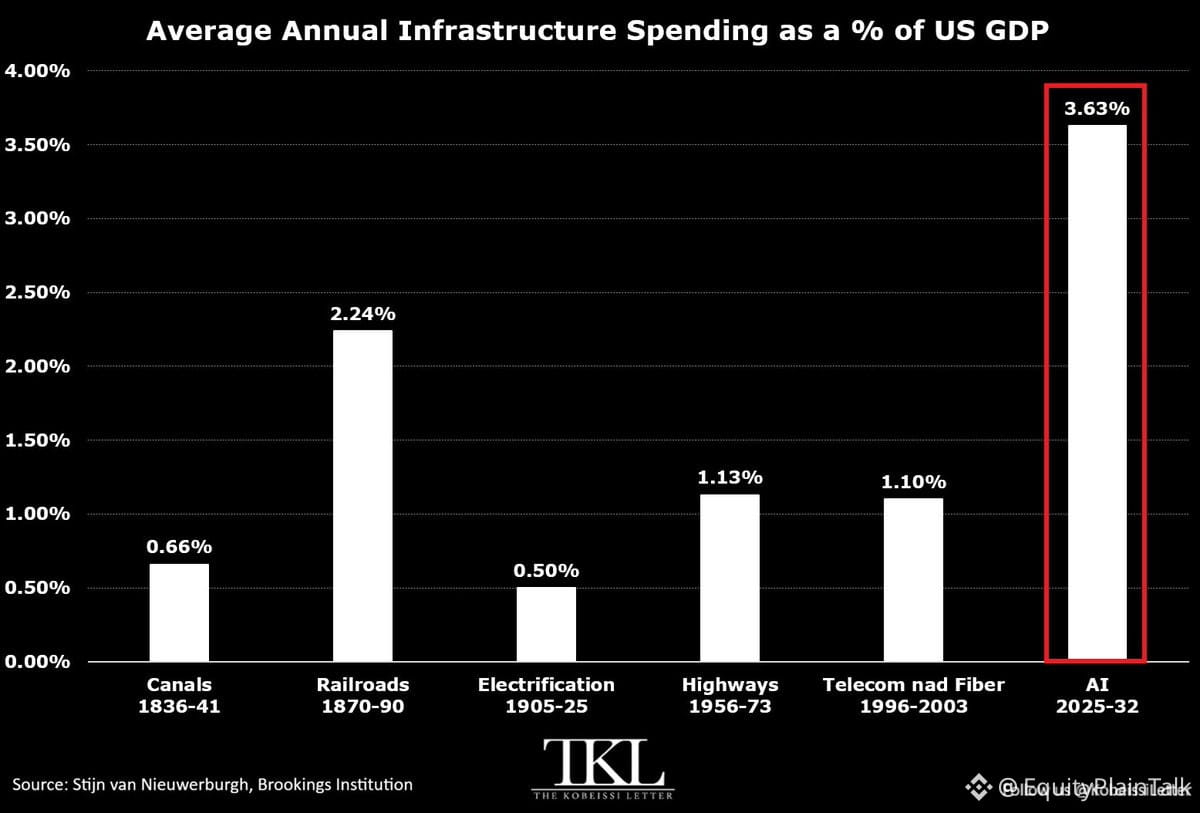
يُتوقّع أن يصل بناء الذكاء الاصطناعي ومراكز البيانات إلى 3.63% من الناتج المحلي الإجمالي سنويًا خلال الفترة 2025-2032. هذا أكبر من السكك الحديدية في سبعينات القرن التاسع عشر (2.24% من الناتج المحلي الإجمالي)، والطرق السريعة في خمسينات-سبعينات القرن العشرين (1.13%)، وطفرة الاتصالات في أواخر التسعينات (1.10%)، وبعيدًا جدًا عن كهربة أوائل القرن العشرين (0.50%).
إجمالي الإنفاق: حوالي 10.3 تريليون دولار على مدى ثماني سنوات.
الأمر ليس مجرد ضجة. إنه تدفّق رأسمالي حقيقي إلى بنية تحتية مادية—الأراضي، والطاقة، والرقائق، وأنظمة التبريد، والألياف.
شركات مثل $NVDA و$MSFT و$GOOGL و$META و$AMZN كلها تتسابق لبناء الطاقة الاستيعابية.
للمقارنة، المرة الأخيرة التي رأينا فيها استثمار البنية التحتية يُعيد تشكيل الاقتصاد بهذا الحجم كانت حرفيًا عندما ربطت السكك الحديدية القارة.
السوق تُسعّر الذكاء الاصطناعي على أنه تحول بنيوي طويل الأجل، وليس مجرد موضوع قصير المدى. ما إذا كان ذلك سيؤتي ثماره يعتمد على تحقيق العوائد، لكن التزام الإنفاق الرأسمالي (capex) بالفعل تاريخي.
نحن نشهد الآن unfold موجة البنية التحتية الأكبر في التاريخ الحديث للولايات المتحدة.
يُتوقّع أن يصل بناء الذكاء الاصطناعي ومراكز البيانات إلى 3.63% من الناتج المحلي الإجمالي سنويًا خلال الفترة 2025-2032. هذا أكبر من السكك الحديدية في سبعينات القرن التاسع عشر (2.24% من الناتج المحلي الإجمالي)، والطرق السريعة في خمسينات-سبعينات القرن العشرين (1.13%)، وطفرة الاتصالات في أواخر التسعينات (1.10%)، وبعيدًا جدًا عن كهربة أوائل القرن العشرين (0.50%).
إجمالي الإنفاق: حوالي 10.3 تريليون دولار على مدى ثماني سنوات.
الأمر ليس مجرد ضجة. إنه تدفّق رأسمالي حقيقي إلى بنية تحتية مادية—الأراضي، والطاقة، والرقائق، وأنظمة التبريد، والألياف.
شركات مثل $NVDA و$MSFT و$GOOGL و$META و$AMZN كلها تتسابق لبناء الطاقة الاستيعابية.
للمقارنة، المرة الأخيرة التي رأينا فيها استثمار البنية التحتية يُعيد تشكيل الاقتصاد بهذا الحجم كانت حرفيًا عندما ربطت السكك الحديدية القارة.
السوق تُسعّر الذكاء الاصطناعي على أنه تحول بنيوي طويل الأجل، وليس مجرد موضوع قصير المدى. ما إذا كان ذلك سيؤتي ثماره يعتمد على تحقيق العوائد، لكن التزام الإنفاق الرأسمالي (capex) بالفعل تاريخي.
يُتوقّع أن يصل بناء الذكاء الاصطناعي ومراكز البيانات إلى 3.63% من الناتج المحلي الإجمالي سنويًا خلال الفترة 2025-2032. هذا أكبر من السكك الحديدية في سبعينات القرن التاسع عشر (2.24% من الناتج المحلي الإجمالي)، والطرق السريعة في خمسينات-سبعينات القرن العشرين (1.13%)، وطفرة الاتصالات في أواخر التسعينات (1.10%)، وبعيدًا جدًا عن كهربة أوائل القرن العشرين (0.50%).
إجمالي الإنفاق: حوالي 10.3 تريليون دولار على مدى ثماني سنوات.
الأمر ليس مجرد ضجة. إنه تدفّق رأسمالي حقيقي إلى بنية تحتية مادية—الأراضي، والطاقة، والرقائق، وأنظمة التبريد، والألياف.
شركات مثل $NVDA و$MSFT و$GOOGL و$META و$AMZN كلها تتسابق لبناء الطاقة الاستيعابية.
للمقارنة، المرة الأخيرة التي رأينا فيها استثمار البنية التحتية يُعيد تشكيل الاقتصاد بهذا الحجم كانت حرفيًا عندما ربطت السكك الحديدية القارة.
السوق تُسعّر الذكاء الاصطناعي على أنه تحول بنيوي طويل الأجل، وليس مجرد موضوع قصير المدى. ما إذا كان ذلك سيؤتي ثماره يعتمد على تحقيق العوائد، لكن التزام الإنفاق الرأسمالي (capex) بالفعل تاريخي.
452
تتعرّض شركات أشباه الموصلات لضغوط كبيرة مقارنةً بالتكنولوجيا في الوقت الحالي.
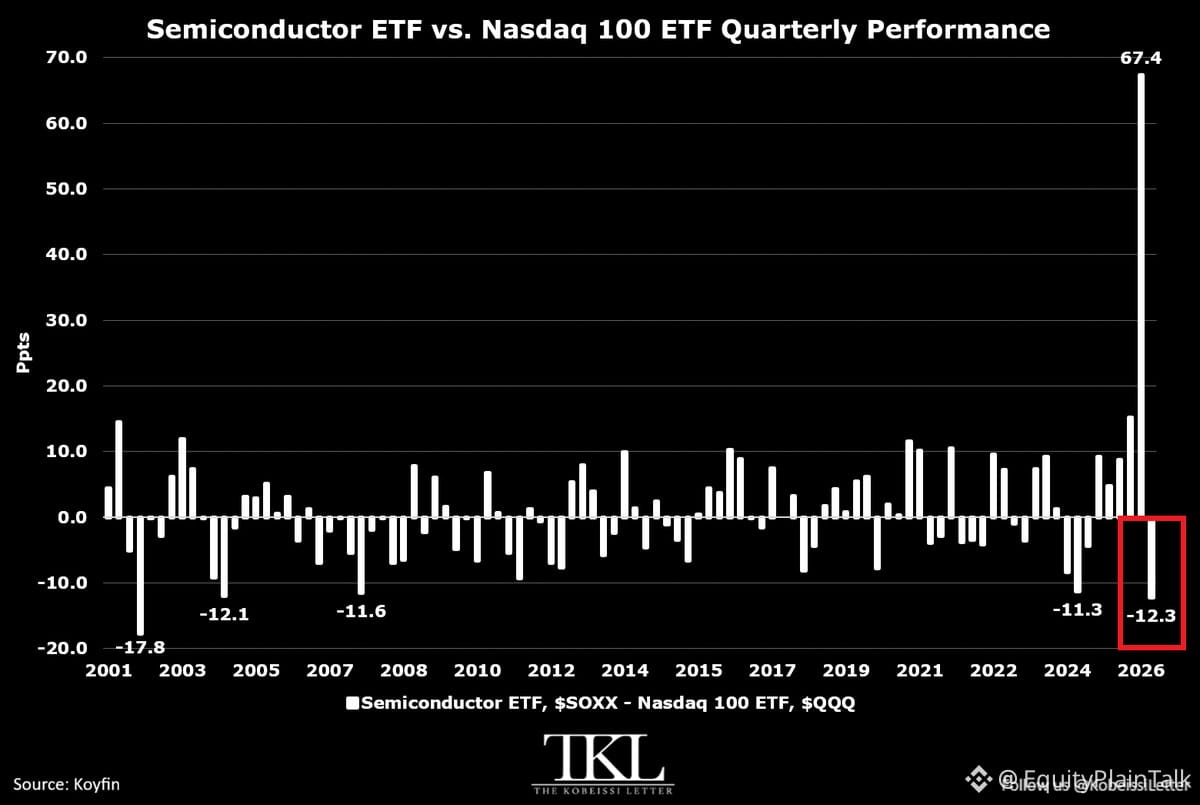
$SOXX انخفض بنسبة 11.7% هذا الربع بينما $QQQ في المنطقة الإيجابية قليلًا. هذا فجوة تبلغ 12.3 نقطة مئوية — أسوأ تراجع نسبي منذ الربع الثالث من عام 2002.
وللمقارنة، فهذا أوسع من فجوة 11.6 نقطة خلال الأزمة المالية في أواخر 2007.
لكن لننظر إلى الصورة الأوسع: حققت الشرائح (الرقائق) أفضل ربع لها على الإطلاق في الربع الثاني، متفوّقة بفارق 67 نقطة. ما زالت مرتفعة بنسبة 88% منذ بداية العام مقابل 21% لمؤشر ناسداك 100.
يبدو هذا كتصحيح طبيعي بعد صعودٍ شبه أُسُّوري. السؤال هو ما إذا كان الأمر مجرد جني أرباح أو أن هناك شيئًا أعمق يتكوّن في دورة رقائق الشرائح.
تتعرّض شركات أشباه الموصلات لضغوط كبيرة مقارنةً بالتكنولوجيا في الوقت الحالي.
$SOXX انخفض بنسبة 11.7% هذا الربع بينما $QQQ في المنطقة الإيجابية قليلًا. هذا فجوة تبلغ 12.3 نقطة مئوية — أسوأ تراجع نسبي منذ الربع الثالث من عام 2002.
وللمقارنة، فهذا أوسع من فجوة 11.6 نقطة خلال الأزمة المالية في أواخر 2007.
لكن لننظر إلى الصورة الأوسع: حققت الشرائح (الرقائق) أفضل ربع لها على الإطلاق في الربع الثاني، متفوّقة بفارق 67 نقطة. ما زالت مرتفعة بنسبة 88% منذ بداية العام مقابل 21% لمؤشر ناسداك 100.
يبدو هذا كتصحيح طبيعي بعد صعودٍ شبه أُسُّوري. السؤال هو ما إذا كان الأمر مجرد جني أرباح أو أن هناك شيئًا أعمق يتكوّن في دورة رقائق الشرائح.
$SOXX انخفض بنسبة 11.7% هذا الربع بينما $QQQ في المنطقة الإيجابية قليلًا. هذا فجوة تبلغ 12.3 نقطة مئوية — أسوأ تراجع نسبي منذ الربع الثالث من عام 2002.
وللمقارنة، فهذا أوسع من فجوة 11.6 نقطة خلال الأزمة المالية في أواخر 2007.
لكن لننظر إلى الصورة الأوسع: حققت الشرائح (الرقائق) أفضل ربع لها على الإطلاق في الربع الثاني، متفوّقة بفارق 67 نقطة. ما زالت مرتفعة بنسبة 88% منذ بداية العام مقابل 21% لمؤشر ناسداك 100.
يبدو هذا كتصحيح طبيعي بعد صعودٍ شبه أُسُّوري. السؤال هو ما إذا كان الأمر مجرد جني أرباح أو أن هناك شيئًا أعمق يتكوّن في دورة رقائق الشرائح.
218
سجّل الدخول لاستكشاف المزيد من المُحتوى
انضم إلى مُستخدمي العملات الرقمية حول العالم على Binance Square
⚡️ احصل على أحدث المعلومات المفيدة عن العملات الرقمية.
💬 موثوقة من قبل أكبر منصّة لتداول العملات الرقمية في العالم.
👍 اكتشف الرؤى الحقيقية من صنّاع المُحتوى الموثوقين.
البريد الإلكتروني / رقم الهاتف
المواضيع الرائجة
BitwiseFilesFinalNEARSpotETFProspectus
41,040 مشاهدات
1,048 يقومون بالنقاش
#bitwisefilesfinalnearspotetfprospectus
🚨 اصبروا يا جماعة! بايتوايز Bitwise أطلقت قنبلة من 39 صفحة! 💣
نعم، لقد قرأتم ذلك صحيحًا. #bitwisefilesfinalnearspotetfprospectus ليست خطأ مطبعيًا. إنها بايتوايز ترفع نشرتها/مستندها النهائي لصندوق NEAR Spot ETF! 🚀
لحظة... صندوق «NEAR»؟ هل يعني أن الموافقة قريبة، أم أننا نتداول $NEAR؟ الاثنين! 😂
رئيس قسم الاستثمار CIO مات هوجان فعل وضع السحرة مع توقعات الأسعار لعام 2030:
🐂 السيناريو الصعودي: 562$ (اتركوا فيزا Visa! 💳)
📊 السيناريو الأساسي: 155$ (لا يزال يقود سيارة لامبورغيني 🏎️)
🐻 السيناريو الهبوطي: 1.63$ (عودة إلى المعكرونة الفورية 🍜)
ماذا ينبغي على المتداولين فعله؟
لا تذعروا للشراء ولا تذعروا للبيع. فقط ثبّتوا مكانكم، اقرأوا الصفحات الـ39 (أو مجرد تمرير TikTok)، واستخدموا كودي للتداول بأمان!
⚠️ ليست نصيحة مالية!
متابعة من فضلكم
$NEAR
$BTC
$ETH
#nearprotocol #CryptoETFs #Bitwise #CryptoNews #TradingStrategy
Shamika Metting
·3 إعجاب
·2.6k مشاهدات
BitgetHackerMoves$83MStolenXRP
22,226 مشاهدات
145 يقومون بالنقاش
SOLSpotETFWeeklyInflow$188M
12,665 مشاهدات
111 يقومون بالنقاش