

CryptoPatel
7.2k منشورات

CryptoPatel
 تم التحقُّق من Square
إبلاغ
حظر المُستخدم
Crypto Entrepreneur. 10 years TA FA. Founder of CryptoPatel. Alpha Hunter. SMC and ICT Trader. Sharing 10x Gems, X: CryptoPatel, Pro Setups, Market Trends 🚀
24 تتابع
6.4K+ المتابعون
18.0K+ إعجاب
منشورات
الكل
اقتباسات
مقاطع فيديو
Live
·
--
صاعد
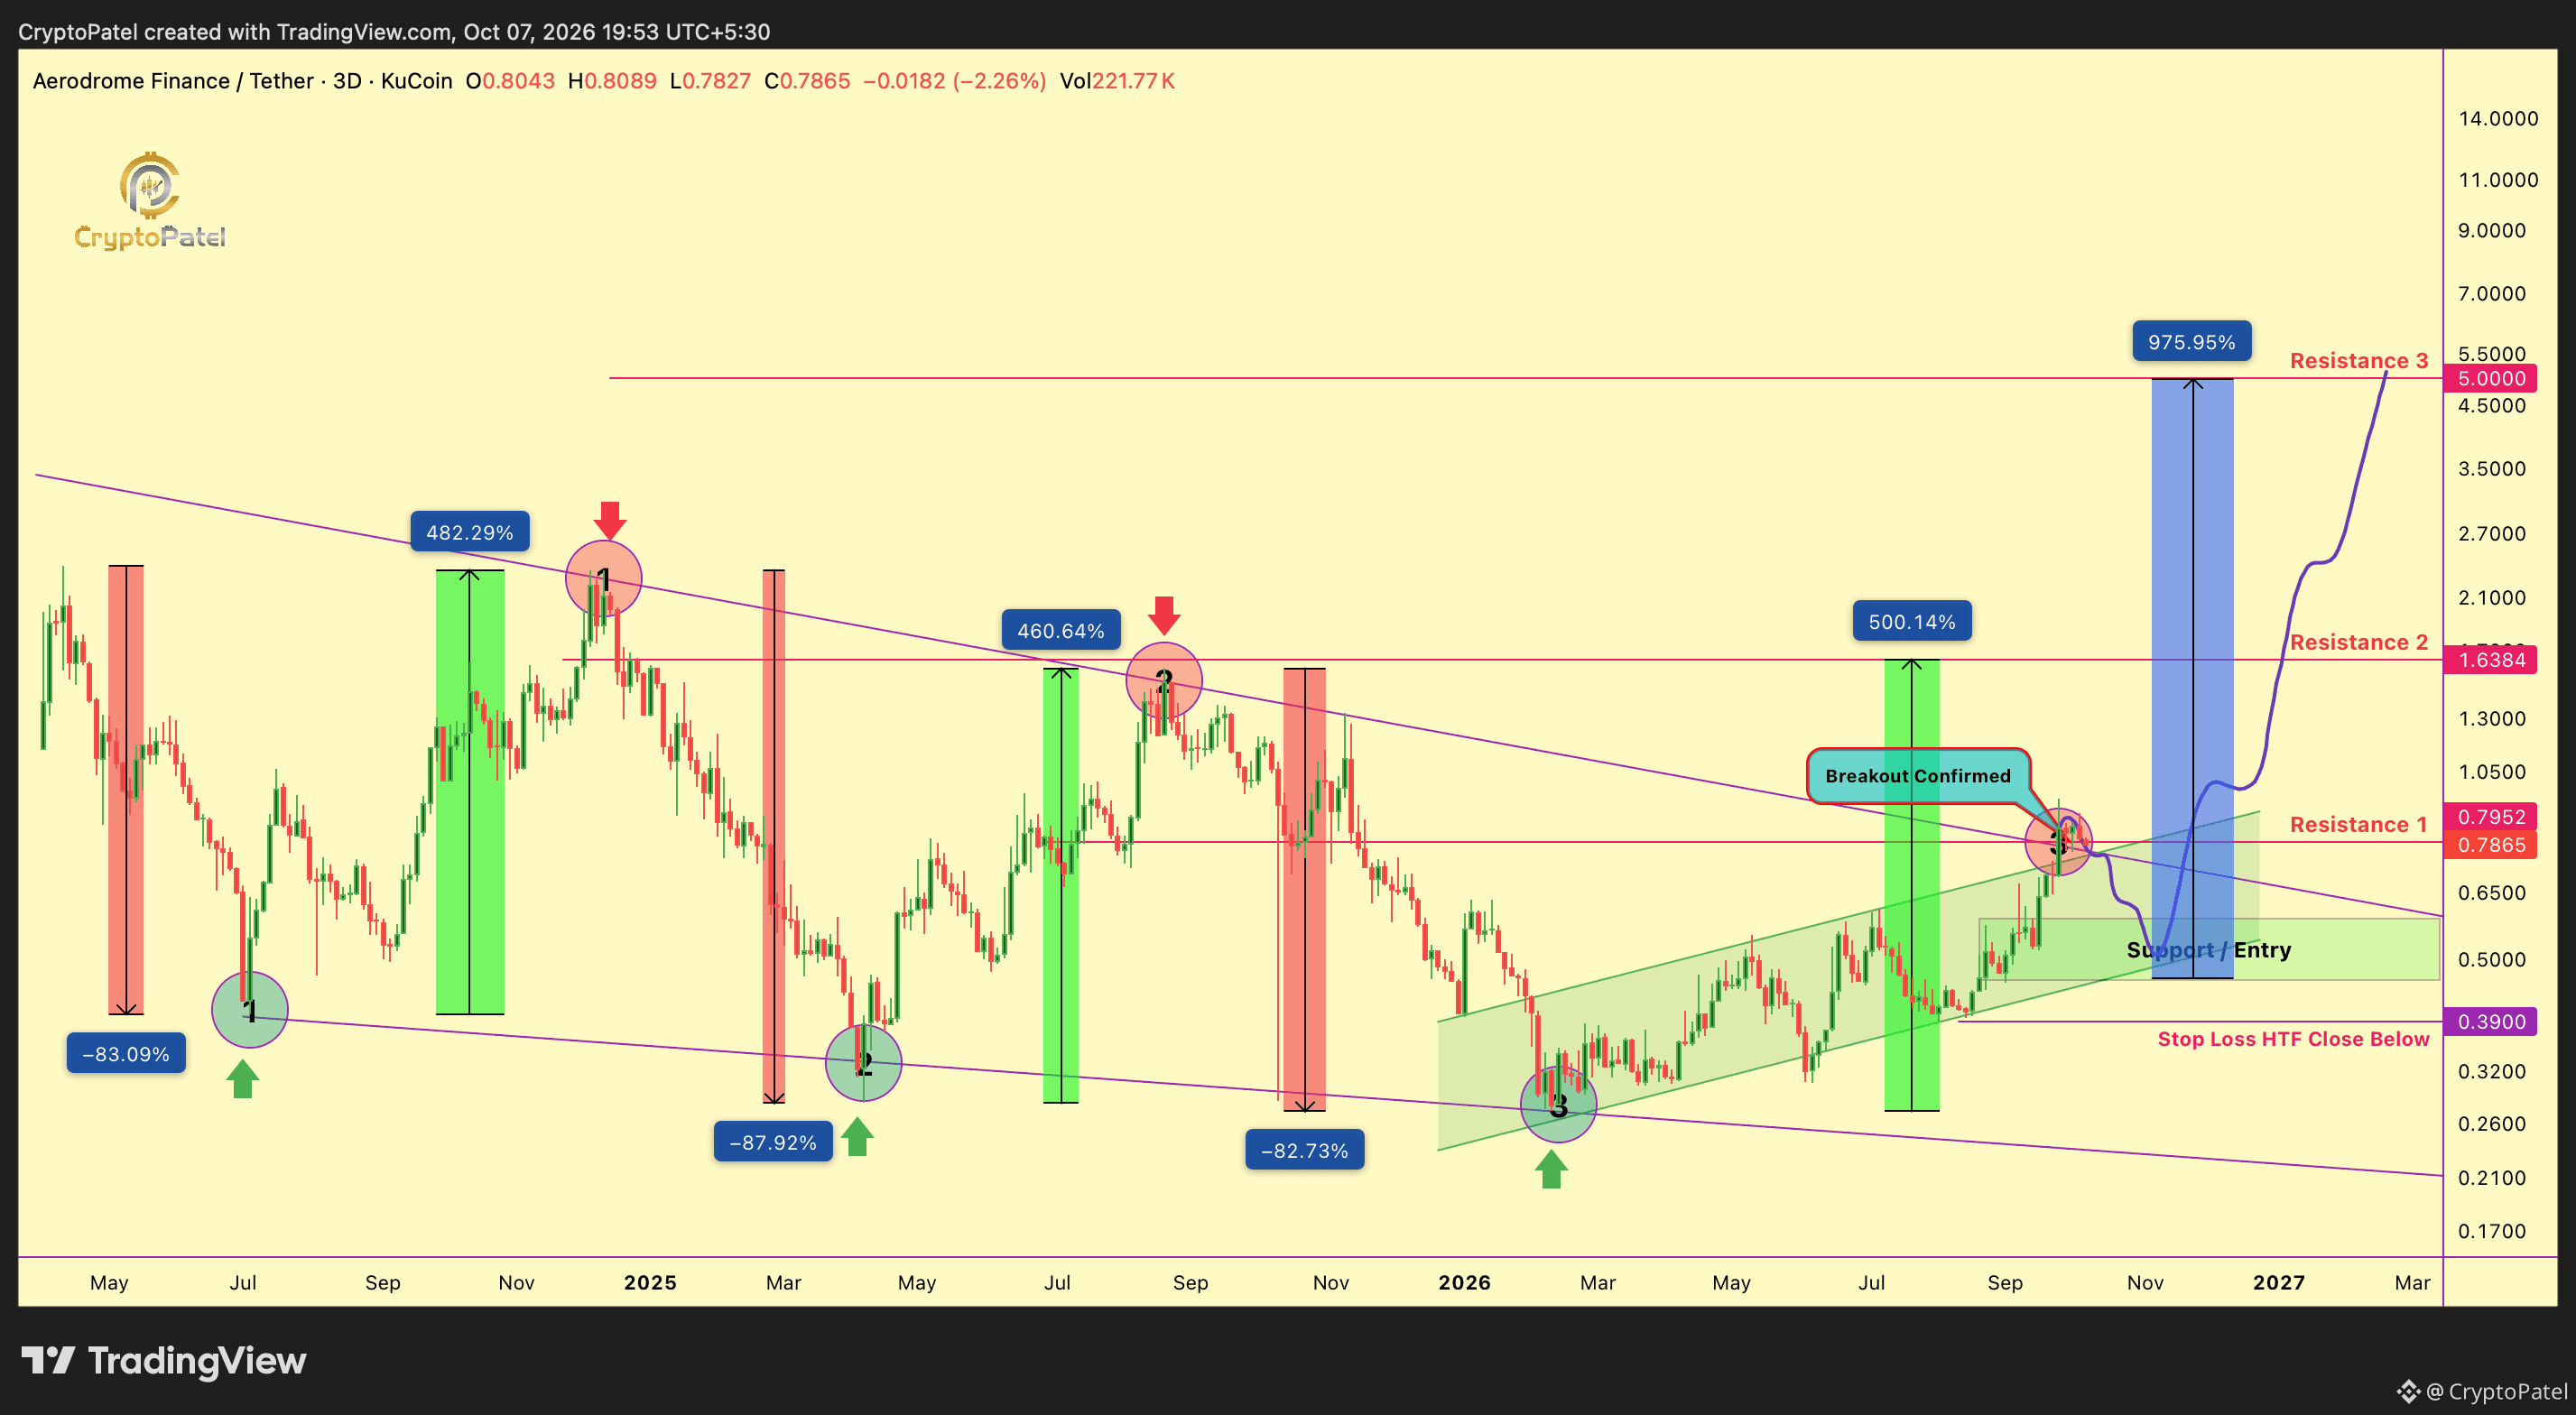
$AERO اختراق HTF: التحول الهيكلي قد يستهدف 5 دولارات
التحليل الفني: تأكد اختراق خط اتجاه هابط ممتد لعدة سنوات
🔹 مستوى الاختراق: $0.7952
🔹 منطقة الطلب: $0.58–$0.45 (منطقة الدخول)
🔹 المقاومة 1: $0.7952/$1.6384/$5
🔹 إبطال السيناريو: إغلاق HTF دون $0.39
يشير الاختراق إلى احتمال انتقال هيكل السوق إلى الاتجاه الصعودي. ومن شأن إعادة اختبار ناجحة والثبات فوق $0.7952 أن يعززا استمرار الصعود نحو $1.65، مع بقاء $5 الهدف الرئيسي للتوسع على إطار HTF.
ليست نصيحة مالية. أجرِ أبحاثك بنفسك.
{future}(AEROUSDT)
$AERO اختراق HTF: التحول الهيكلي قد يستهدف 5 دولارات
التحليل الفني: تأكد اختراق خط اتجاه هابط ممتد لعدة سنوات
🔹 مستوى الاختراق: $0.7952
🔹 منطقة الطلب: $0.58–$0.45 (منطقة الدخول)
🔹 المقاومة 1: $0.7952/$1.6384/$5
🔹 إبطال السيناريو: إغلاق HTF دون $0.39
يشير الاختراق إلى احتمال انتقال هيكل السوق إلى الاتجاه الصعودي. ومن شأن إعادة اختبار ناجحة والثبات فوق $0.7952 أن يعززا استمرار الصعود نحو $1.65، مع بقاء $5 الهدف الرئيسي للتوسع على إطار HTF.
ليست نصيحة مالية. أجرِ أبحاثك بنفسك.
التحليل الفني: تأكد اختراق خط اتجاه هابط ممتد لعدة سنوات
🔹 مستوى الاختراق: $0.7952
🔹 منطقة الطلب: $0.58–$0.45 (منطقة الدخول)
🔹 المقاومة 1: $0.7952/$1.6384/$5
🔹 إبطال السيناريو: إغلاق HTF دون $0.39
يشير الاختراق إلى احتمال انتقال هيكل السوق إلى الاتجاه الصعودي. ومن شأن إعادة اختبار ناجحة والثبات فوق $0.7952 أن يعززا استمرار الصعود نحو $1.65، مع بقاء $5 الهدف الرئيسي للتوسع على إطار HTF.
ليست نصيحة مالية. أجرِ أبحاثك بنفسك.
124
·
--
تيثر تدخل للتوّ ساحة العملات المستقرة في كازاخستان
وقّعت تيثر مذكرة تفاهم مع البنك الوطني الكازاخستاني ومدينة ألاتاو لاستكشاف إصدار عملة مستقرة مرتبطة بالتنغي الكازاخستاني (KZT)، وترميز الأصول الحقيقية (RWA)، وبنية التمويل اللامركزي (DeFi).
وقد تستفيد المبادرة التجريبية من منصة هادرون التابعة لتيثر لترميز الأصول.
لكن المشروع لا يزال في مرحلة الاستكشاف، ولم يُعلَن بعد عن إطلاق رسمي لأي عملة مستقرة.
لكن الرسالة واضحة: كازاخستان تتجه نحو اعتماد مؤسسي للعملات المستقرة والأصول الحقيقية.
تيثر تدخل للتوّ ساحة العملات المستقرة في كازاخستان
وقّعت تيثر مذكرة تفاهم مع البنك الوطني الكازاخستاني ومدينة ألاتاو لاستكشاف إصدار عملة مستقرة مرتبطة بالتنغي الكازاخستاني (KZT)، وترميز الأصول الحقيقية (RWA)، وبنية التمويل اللامركزي (DeFi).
وقد تستفيد المبادرة التجريبية من منصة هادرون التابعة لتيثر لترميز الأصول.
لكن المشروع لا يزال في مرحلة الاستكشاف، ولم يُعلَن بعد عن إطلاق رسمي لأي عملة مستقرة.
لكن الرسالة واضحة: كازاخستان تتجه نحو اعتماد مؤسسي للعملات المستقرة والأصول الحقيقية.
وقّعت تيثر مذكرة تفاهم مع البنك الوطني الكازاخستاني ومدينة ألاتاو لاستكشاف إصدار عملة مستقرة مرتبطة بالتنغي الكازاخستاني (KZT)، وترميز الأصول الحقيقية (RWA)، وبنية التمويل اللامركزي (DeFi).
وقد تستفيد المبادرة التجريبية من منصة هادرون التابعة لتيثر لترميز الأصول.
لكن المشروع لا يزال في مرحلة الاستكشاف، ولم يُعلَن بعد عن إطلاق رسمي لأي عملة مستقرة.
لكن الرسالة واضحة: كازاخستان تتجه نحو اعتماد مؤسسي للعملات المستقرة والأصول الحقيقية.

122
·
--
هابط
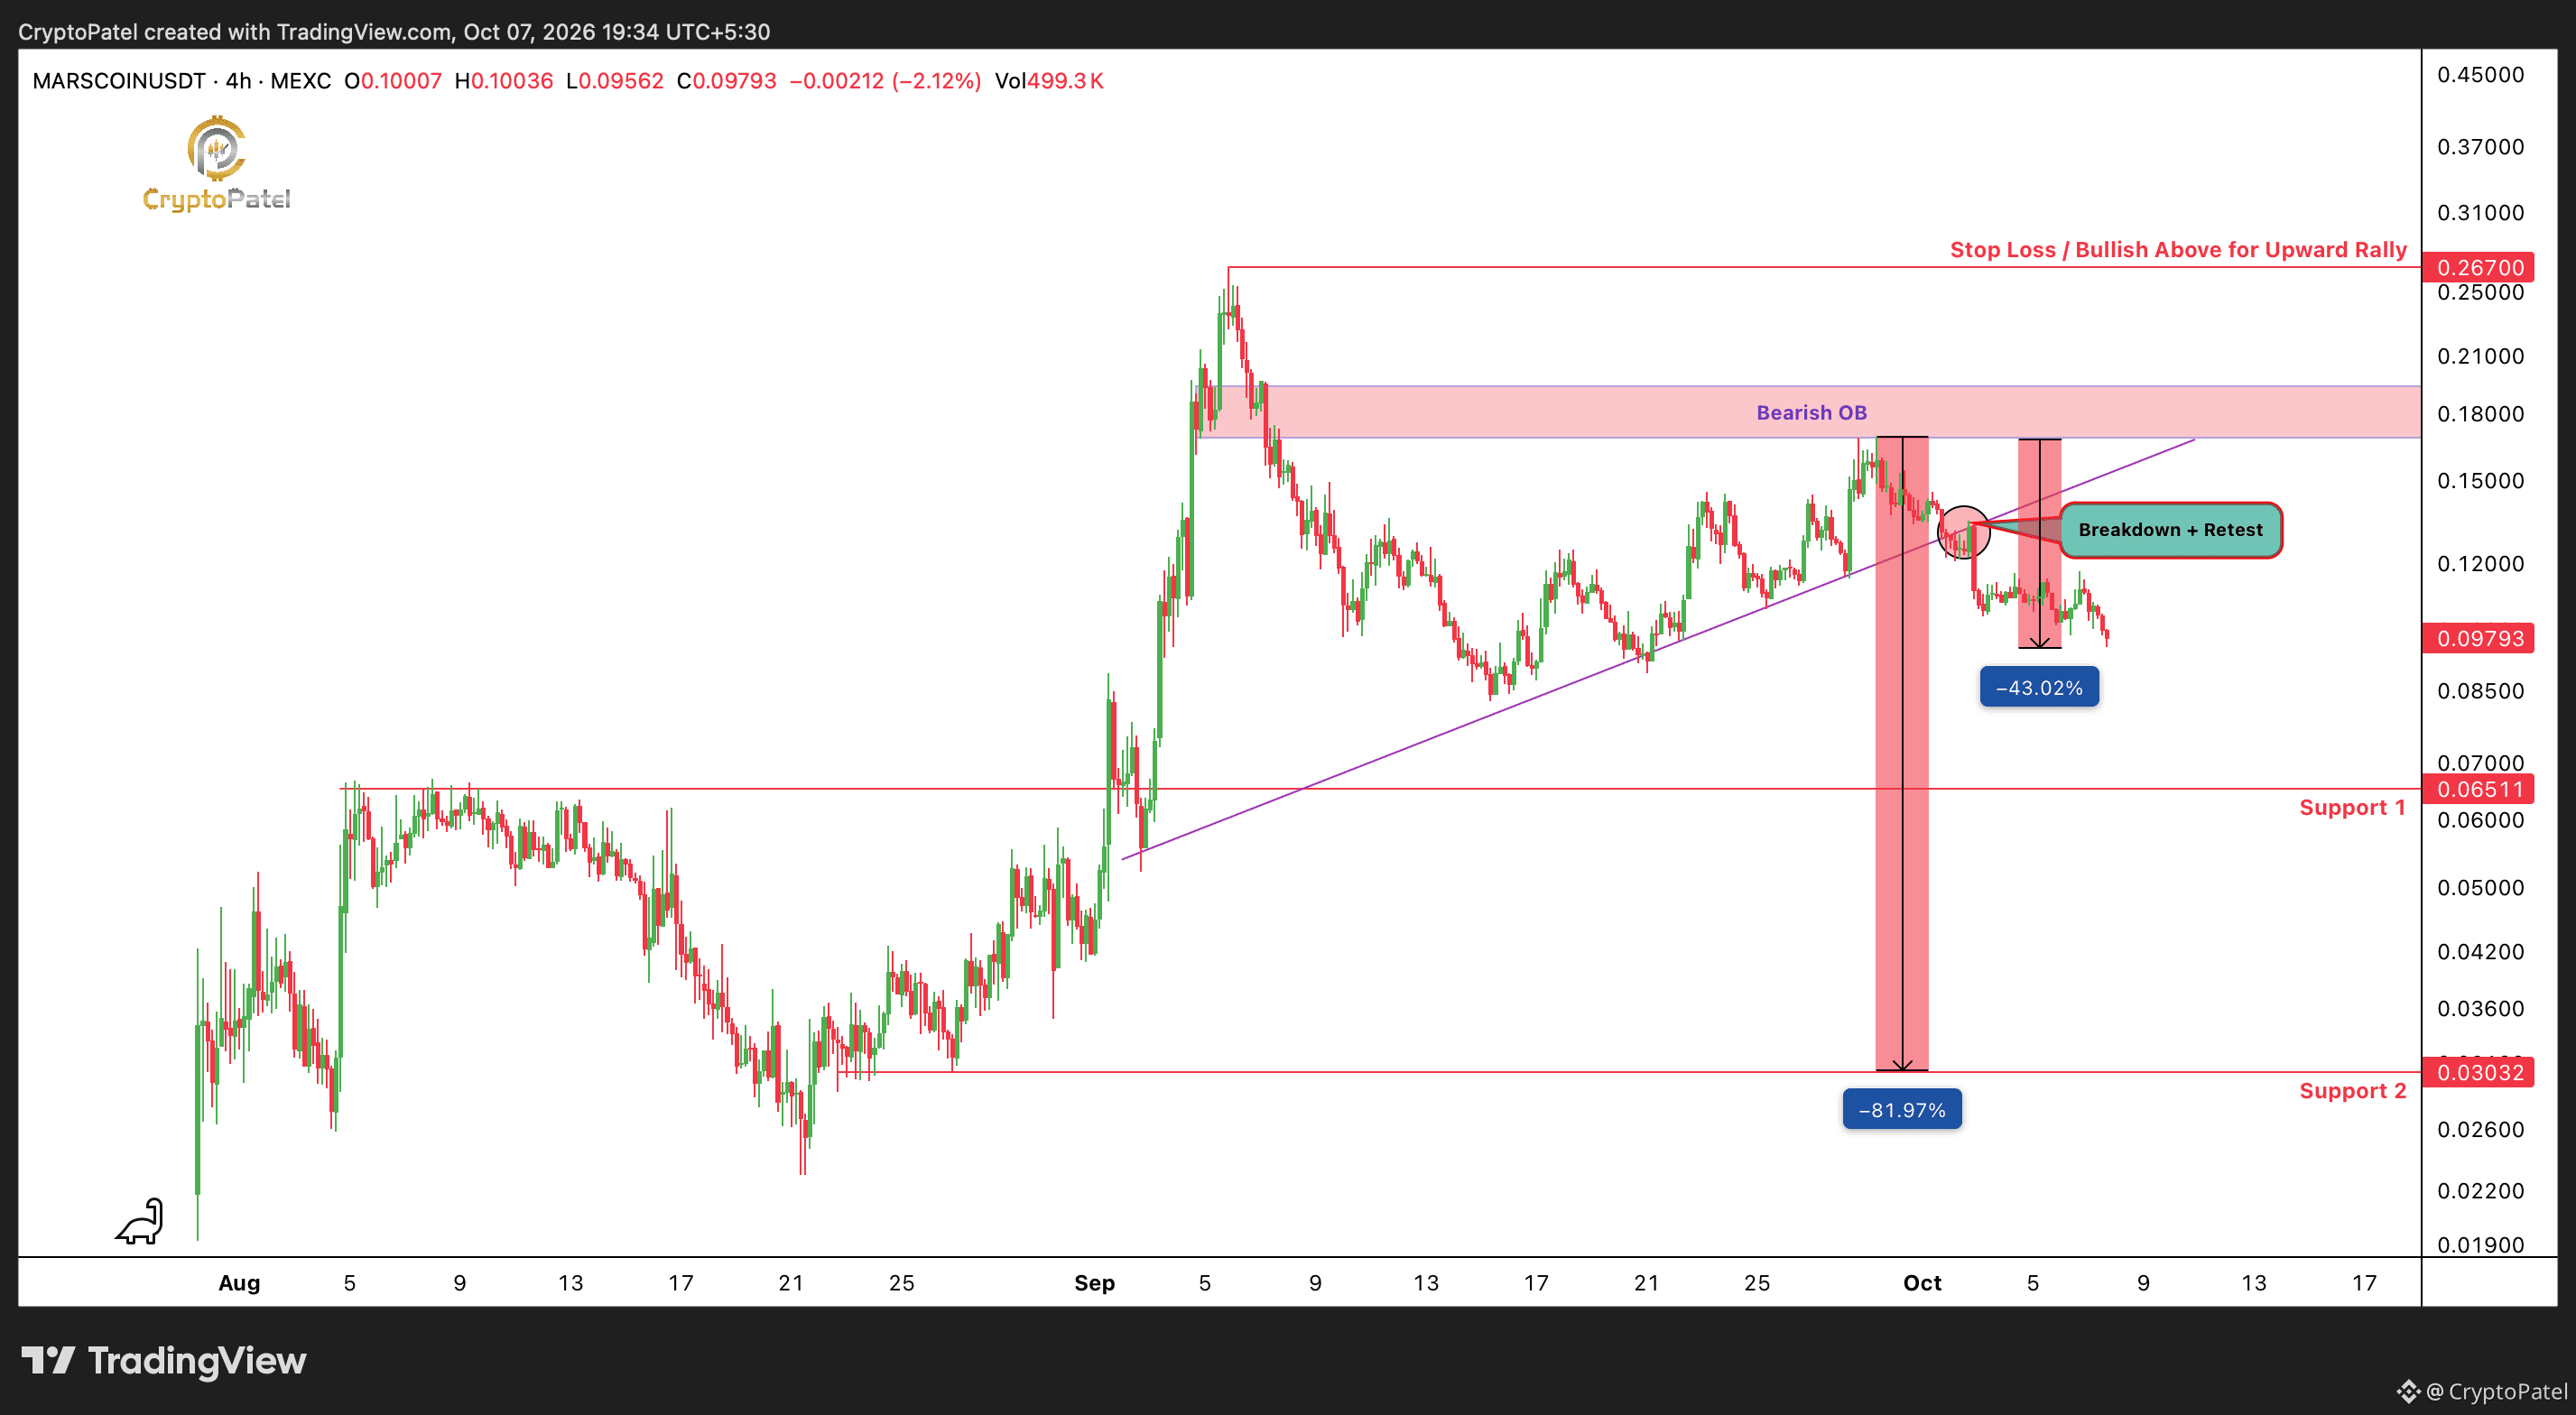
$MARSCOIN هبط للتو بنسبة 43% من كتلة الأوامر الهبوطية لدينا!
اتبَع #MARSCOIN البنية نفسها تمامًا التي أشرت إليها في تحليلي السابق.
حذّرت من أن السعر قد يرتفع إلى كتلة الأوامر الهبوطية عند $0.18–$0.20 قبل أن يواجه ضغوط بيع كبيرة.
اختبر السعر المنطقة… ثم هبط بنسبة 43%.
ولهذا أكرر دائمًا: لا تطارد الضجة وFOMO عند القمة.
إذا تجنبت فخ الشراء الطويل عند القمة، فقد حميت محفظتك.
وإذا فتحت صفقة بيع من كتلة الأوامر الهبوطية لدينا برافعة مالية 5X، فهذه الحركة تعادل ربحًا يقارب 200% من الهامش قبل الرسوم/التمويل.
أهدافي الهبوطية لـ $MARSCOIN لم تتغير: $0.065/$0.030
يمكنك التفكير في جني جزء من الأرباح وترك بقية الصفقة مفتوحة مع إدارة المخاطر بشكل سليم.
السيناريو يتكشف كما توقعنا. والآن أدر الصفقة.
ليست نصيحة مالية. قم بأبحاثك بنفسك.
{future}(MARSCOINUSDT)
$MARSCOIN هبط للتو بنسبة 43% من كتلة الأوامر الهبوطية لدينا!
اتبَع #MARSCOIN البنية نفسها تمامًا التي أشرت إليها في تحليلي السابق.
حذّرت من أن السعر قد يرتفع إلى كتلة الأوامر الهبوطية عند $0.18–$0.20 قبل أن يواجه ضغوط بيع كبيرة.
اختبر السعر المنطقة… ثم هبط بنسبة 43%.
ولهذا أكرر دائمًا: لا تطارد الضجة وFOMO عند القمة.
إذا تجنبت فخ الشراء الطويل عند القمة، فقد حميت محفظتك.
وإذا فتحت صفقة بيع من كتلة الأوامر الهبوطية لدينا برافعة مالية 5X، فهذه الحركة تعادل ربحًا يقارب 200% من الهامش قبل الرسوم/التمويل.
أهدافي الهبوطية لـ $MARSCOIN لم تتغير: $0.065/$0.030
يمكنك التفكير في جني جزء من الأرباح وترك بقية الصفقة مفتوحة مع إدارة المخاطر بشكل سليم.
السيناريو يتكشف كما توقعنا. والآن أدر الصفقة.
ليست نصيحة مالية. قم بأبحاثك بنفسك.
اتبَع #MARSCOIN البنية نفسها تمامًا التي أشرت إليها في تحليلي السابق.
حذّرت من أن السعر قد يرتفع إلى كتلة الأوامر الهبوطية عند $0.18–$0.20 قبل أن يواجه ضغوط بيع كبيرة.
اختبر السعر المنطقة… ثم هبط بنسبة 43%.
ولهذا أكرر دائمًا: لا تطارد الضجة وFOMO عند القمة.
إذا تجنبت فخ الشراء الطويل عند القمة، فقد حميت محفظتك.
وإذا فتحت صفقة بيع من كتلة الأوامر الهبوطية لدينا برافعة مالية 5X، فهذه الحركة تعادل ربحًا يقارب 200% من الهامش قبل الرسوم/التمويل.
أهدافي الهبوطية لـ $MARSCOIN لم تتغير: $0.065/$0.030
يمكنك التفكير في جني جزء من الأرباح وترك بقية الصفقة مفتوحة مع إدارة المخاطر بشكل سليم.
السيناريو يتكشف كما توقعنا. والآن أدر الصفقة.
ليست نصيحة مالية. قم بأبحاثك بنفسك.
CryptoPatel
·
--
هابط$MARSCOIN التحليل الفني | كتلة أوامر هابطة في دائرة الضوء
#MARSCOIN يتداول قرب $0.12 بعد موجة صعود حادة ثم رفض لاحق من القمة المتأرجحة عند $0.2670.
يبقى السعر تحت كتلة الأوامر الهابطة الرئيسية عند $0.18–$0.2، ما يحافظ على البنية التصحيحية.
مستويات الدعم الرئيسية: $0.065 → $0.030
إبطال الاتجاه الهابط: $0.2670
اختراق مستمر خلال 6H فوق $0.2670 قد يشير إلى تحول في البنية السوقية لصالح الاتجاه الصاعد. وحتى ذلك الحين، قد تواجه الارتفاعات نحو منطقة العرض ضغط بيع متجدد.
تداول بإدارة مخاطر محددة. ليس نصيحة مالية.
#MARSCOIN يتداول قرب $0.12 بعد موجة صعود حادة ثم رفض لاحق من القمة المتأرجحة عند $0.2670.
يبقى السعر تحت كتلة الأوامر الهابطة الرئيسية عند $0.18–$0.2، ما يحافظ على البنية التصحيحية.
مستويات الدعم الرئيسية: $0.065 → $0.030
إبطال الاتجاه الهابط: $0.2670
اختراق مستمر خلال 6H فوق $0.2670 قد يشير إلى تحول في البنية السوقية لصالح الاتجاه الصاعد. وحتى ذلك الحين، قد تواجه الارتفاعات نحو منطقة العرض ضغط بيع متجدد.
تداول بإدارة مخاطر محددة. ليس نصيحة مالية.
791
·
--
صاعد
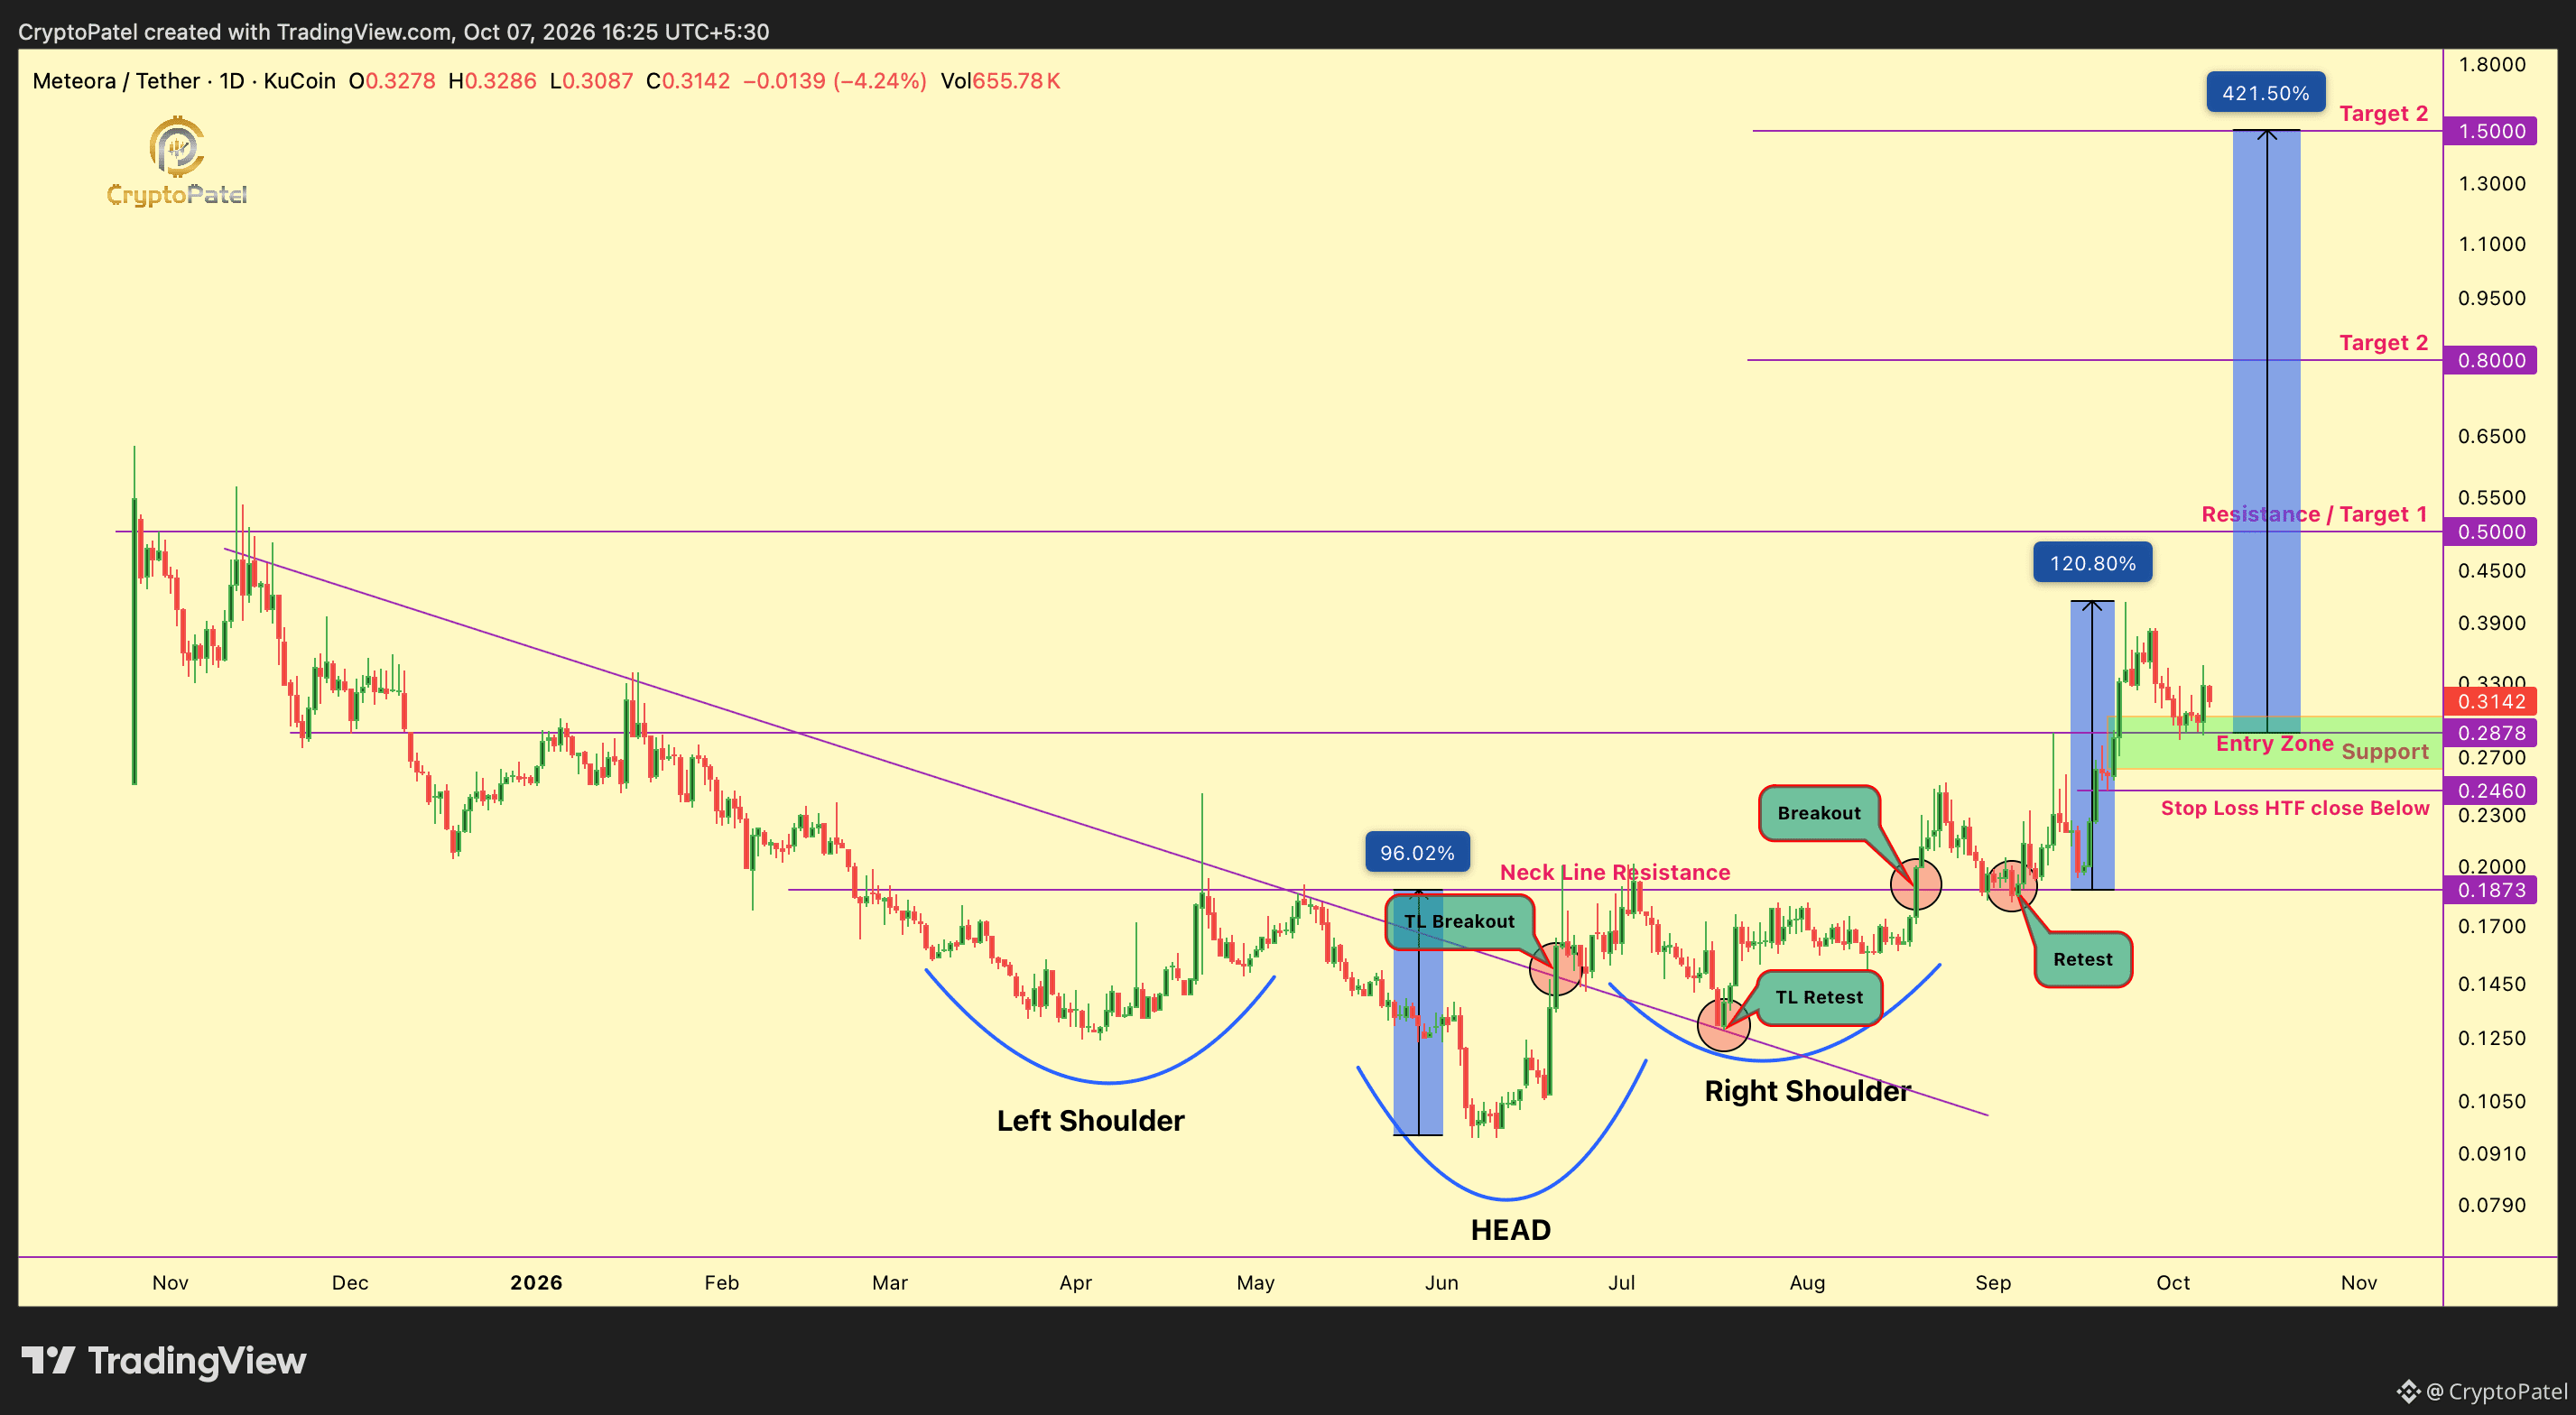
$MET توقعات السعر: نموذج الرأس والكتفين المقلوب الذي لا يمكنك تجاهله
#MET يُظهر أحد أوضح نماذج الرأس والكتفين المقلوب التي رأيتها منذ وقت طويل، وهو نموذج انعكاس صعودي عالي الجودة على المدى الطويل.
حدث الاختراق الرئيسي فوق خط العنق عند $0.1873–$0.1875، تلاه إعادة اختبار مثالية ومواصلة للصعود. ومن منطقة الاختراق وإعادة الاختبار هذه، حقق MET/USDT ارتفاعًا بنحو 120%.
كما شهد خط الاتجاه الهابط طويل الأمد اختراقًا قرب $0.15، تلاه إعادة اختبار واضحة قرب $0.13، وهي منطقة حققت لاحقًا ارتفاعًا بنحو 219%.
والآن، يحافظ MET/USDT على التداول فوق مستوى الدعم عند $0.2878.
منطقة التجميع الخاصة بي: $0.30–$0.25، مع ترك مجال لاحتمال سحب السيولة.
وقف الخسارة: إغلاق يومي على الإطار الزمني الأعلى عند $0.2460
ما دام دعم خط العنق الرئيسي عند $0.1873 صامدًا، يظل الهيكل الصعودي قائمًا.
الأهداف: $0.50/$0.80/$1.50+
ليست نصيحة مالية. احرص دائمًا على إجراء بحثك الخاص.
{future}(METUSDT)
$MET توقعات السعر: نموذج الرأس والكتفين المقلوب الذي لا يمكنك تجاهله
#MET يُظهر أحد أوضح نماذج الرأس والكتفين المقلوب التي رأيتها منذ وقت طويل، وهو نموذج انعكاس صعودي عالي الجودة على المدى الطويل.
حدث الاختراق الرئيسي فوق خط العنق عند $0.1873–$0.1875، تلاه إعادة اختبار مثالية ومواصلة للصعود. ومن منطقة الاختراق وإعادة الاختبار هذه، حقق MET/USDT ارتفاعًا بنحو 120%.
كما شهد خط الاتجاه الهابط طويل الأمد اختراقًا قرب $0.15، تلاه إعادة اختبار واضحة قرب $0.13، وهي منطقة حققت لاحقًا ارتفاعًا بنحو 219%.
والآن، يحافظ MET/USDT على التداول فوق مستوى الدعم عند $0.2878.
منطقة التجميع الخاصة بي: $0.30–$0.25، مع ترك مجال لاحتمال سحب السيولة.
وقف الخسارة: إغلاق يومي على الإطار الزمني الأعلى عند $0.2460
ما دام دعم خط العنق الرئيسي عند $0.1873 صامدًا، يظل الهيكل الصعودي قائمًا.
الأهداف: $0.50/$0.80/$1.50+
ليست نصيحة مالية. احرص دائمًا على إجراء بحثك الخاص.
#MET يُظهر أحد أوضح نماذج الرأس والكتفين المقلوب التي رأيتها منذ وقت طويل، وهو نموذج انعكاس صعودي عالي الجودة على المدى الطويل.
حدث الاختراق الرئيسي فوق خط العنق عند $0.1873–$0.1875، تلاه إعادة اختبار مثالية ومواصلة للصعود. ومن منطقة الاختراق وإعادة الاختبار هذه، حقق MET/USDT ارتفاعًا بنحو 120%.
كما شهد خط الاتجاه الهابط طويل الأمد اختراقًا قرب $0.15، تلاه إعادة اختبار واضحة قرب $0.13، وهي منطقة حققت لاحقًا ارتفاعًا بنحو 219%.
والآن، يحافظ MET/USDT على التداول فوق مستوى الدعم عند $0.2878.
منطقة التجميع الخاصة بي: $0.30–$0.25، مع ترك مجال لاحتمال سحب السيولة.
وقف الخسارة: إغلاق يومي على الإطار الزمني الأعلى عند $0.2460
ما دام دعم خط العنق الرئيسي عند $0.1873 صامدًا، يظل الهيكل الصعودي قائمًا.
الأهداف: $0.50/$0.80/$1.50+
ليست نصيحة مالية. احرص دائمًا على إجراء بحثك الخاص.
1
209
·
--
صاعد
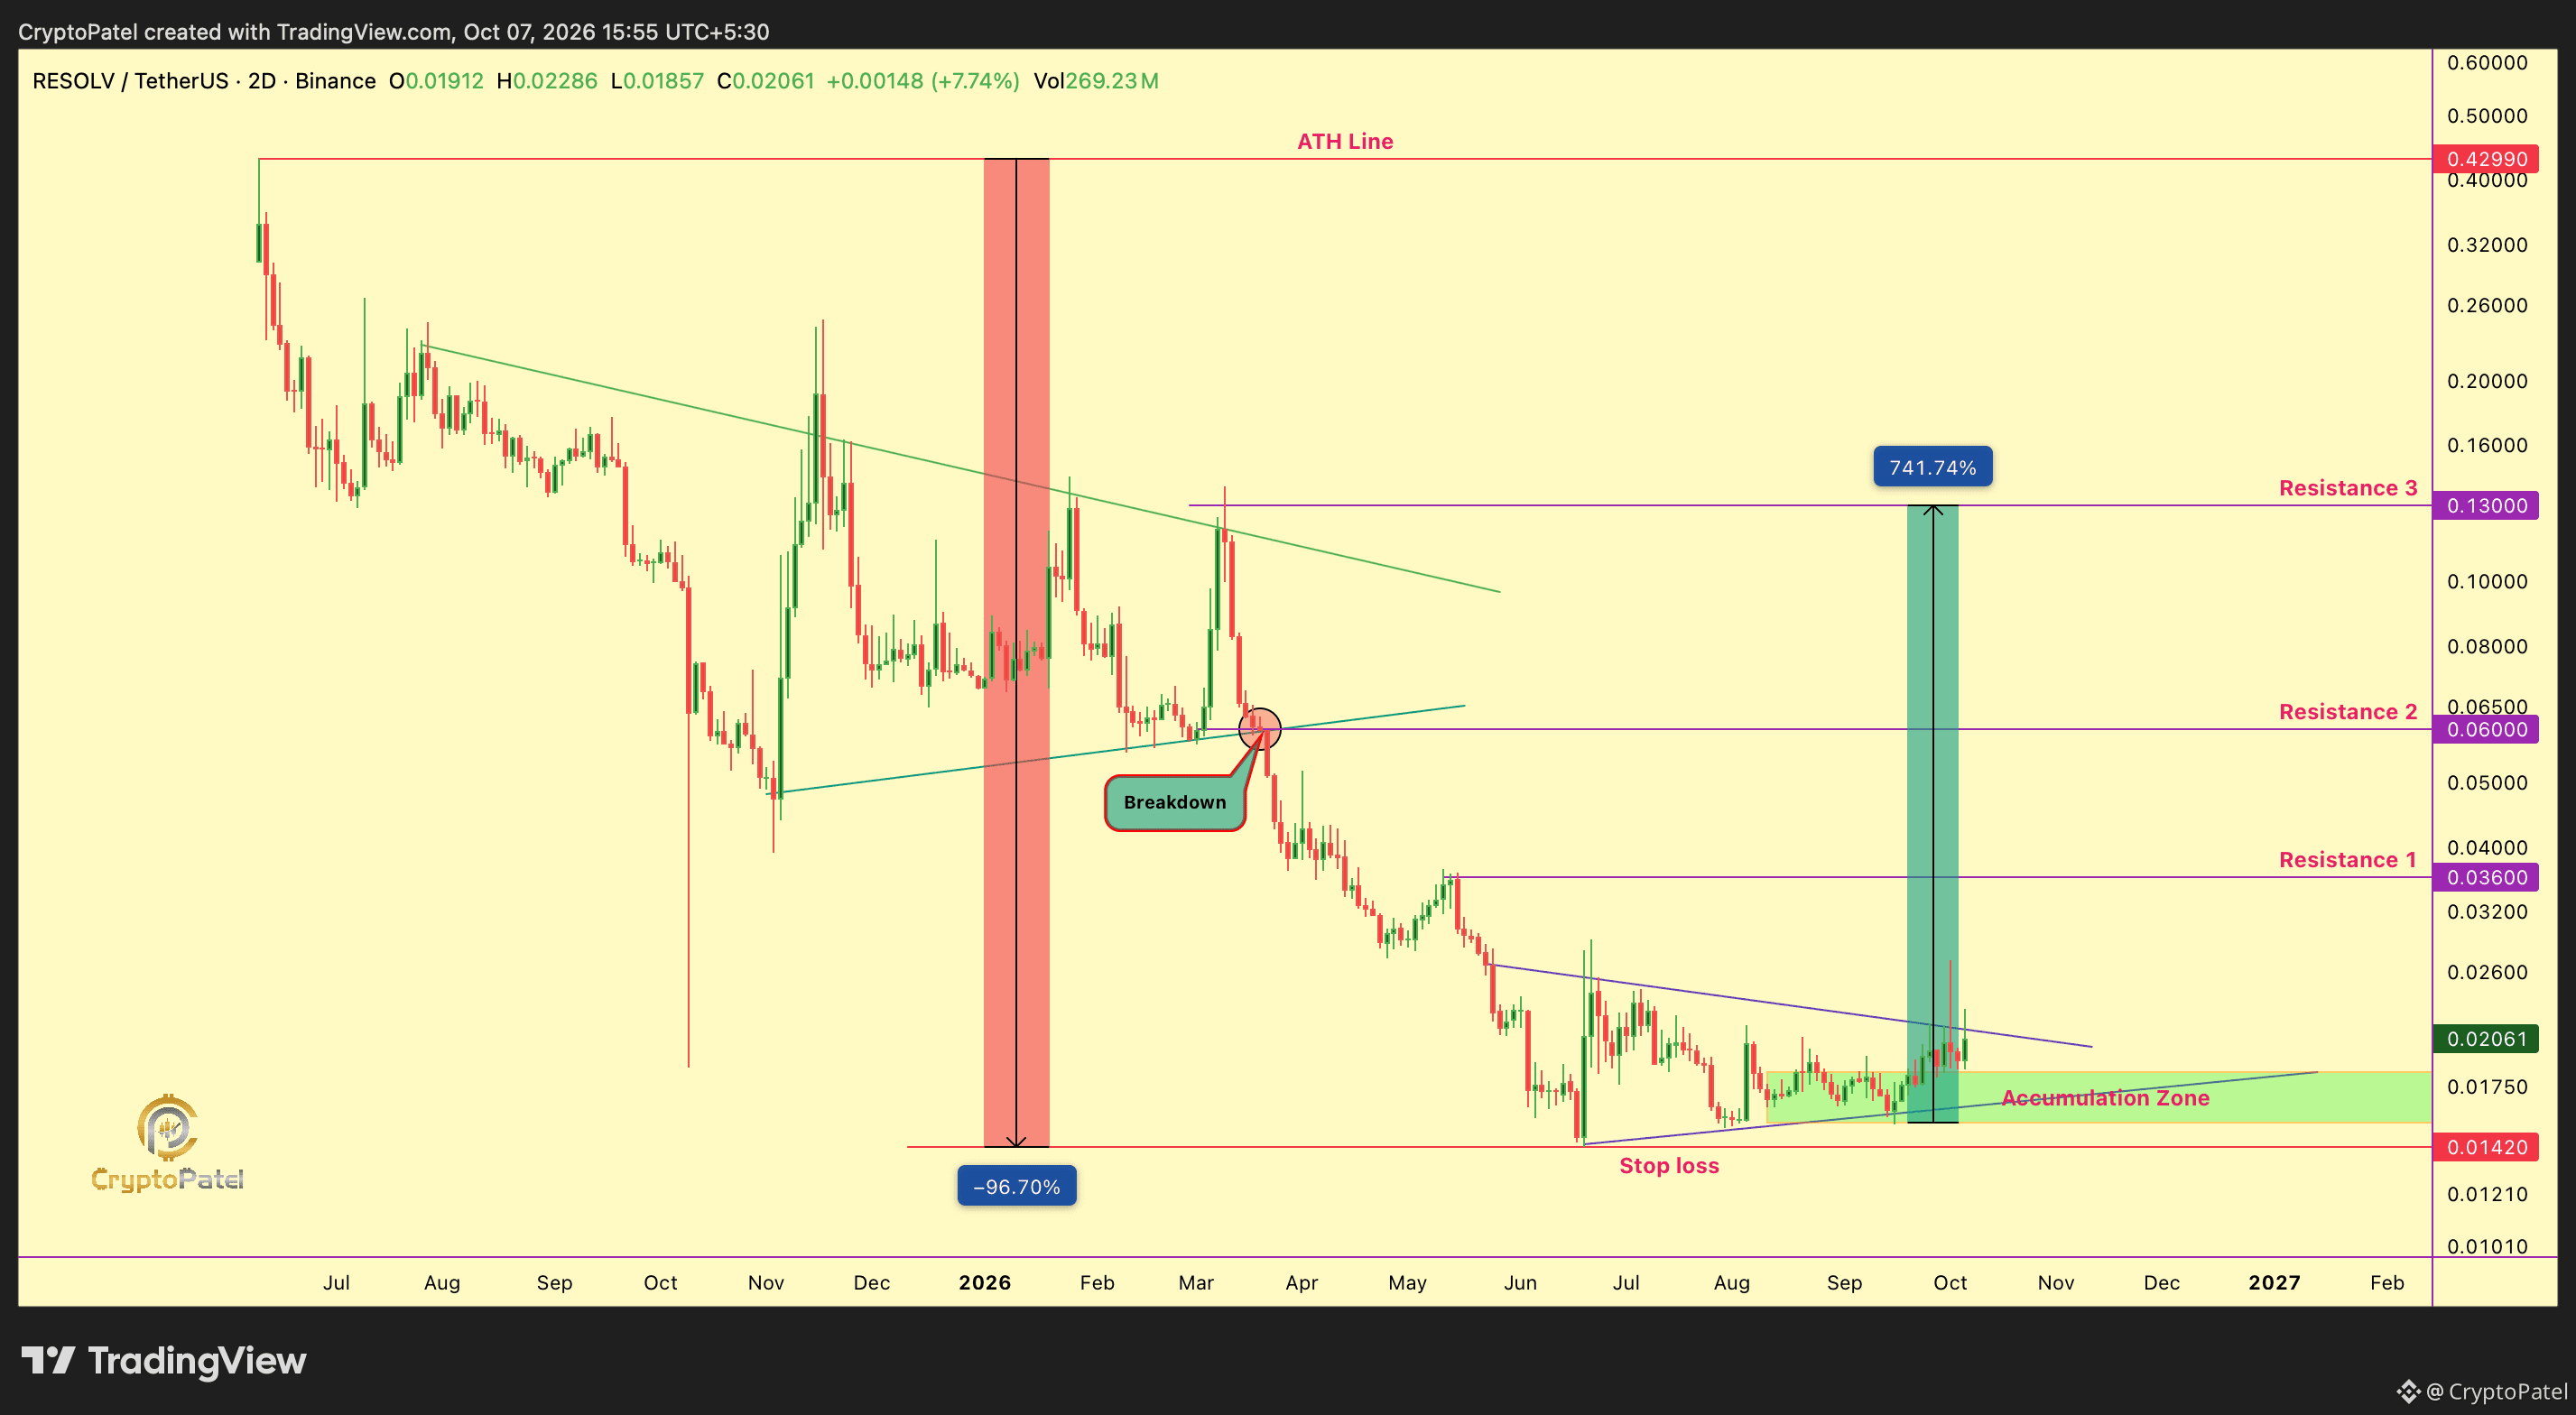
$RESOLV توقعات السعر: اكتمل هبوط بنسبة 97% | هل يلوح انعكاس بمقدار 7X–10X؟
تراجع #RESOLV بنحو 97% تقريبًا من أعلى مستوى له على الإطلاق (ATH) في يونيو 2025، والبالغ $0.4299، إلى $0.0142 في يونيو 2026.
يحاول السعر الآن تحقيق انعكاس كبير من منطقة التجميع بين $0.018 و$0.015، لكن هيكل HTF لا يزال محصورًا داخل مثلث هابط.
المستوى الرئيسي الذي أراقبه هو $0.023:
قد يؤدي إغلاق شمعة HTF مؤكد فوق $0.023 إلى اختراق صعودي وإبطال الهيكل الهابط الحالي. وإذا نجح الاختراق، أتوقع احتمال تحقيق صعود بمقدار 7X–10X انطلاقًا من منطقة التجميع.
مستويات الصعود الرئيسية: $0.036 → $0.060 → $0.130 → أعلى مستوى على الإطلاق (ATH) عند $0.4299
مستوى إبطال الفرضية واضح: إغلاق شمعة HTF دون $0.0142 = إبطال الفرضية الصعودية.
إلى أن يتم اختراق $0.023 مع تأكيد HTF، تظل هذه فرصة قيد التشكّل.
اختراق RESOLV/USDT = تأكيد صعودي.
كسر RESOLV/USDT = استمرار الهبوط.
ليس نصيحة مالية. احرص دائمًا على إجراء بحثك الخاص.
@ResolvLabs
{future}(RESOLVUSDT)
$RESOLV توقعات السعر: اكتمل هبوط بنسبة 97% | هل يلوح انعكاس بمقدار 7X–10X؟
تراجع #RESOLV بنحو 97% تقريبًا من أعلى مستوى له على الإطلاق (ATH) في يونيو 2025، والبالغ $0.4299، إلى $0.0142 في يونيو 2026.
يحاول السعر الآن تحقيق انعكاس كبير من منطقة التجميع بين $0.018 و$0.015، لكن هيكل HTF لا يزال محصورًا داخل مثلث هابط.
المستوى الرئيسي الذي أراقبه هو $0.023:
قد يؤدي إغلاق شمعة HTF مؤكد فوق $0.023 إلى اختراق صعودي وإبطال الهيكل الهابط الحالي. وإذا نجح الاختراق، أتوقع احتمال تحقيق صعود بمقدار 7X–10X انطلاقًا من منطقة التجميع.
مستويات الصعود الرئيسية: $0.036 → $0.060 → $0.130 → أعلى مستوى على الإطلاق (ATH) عند $0.4299
مستوى إبطال الفرضية واضح: إغلاق شمعة HTF دون $0.0142 = إبطال الفرضية الصعودية.
إلى أن يتم اختراق $0.023 مع تأكيد HTF، تظل هذه فرصة قيد التشكّل.
اختراق RESOLV/USDT = تأكيد صعودي.
كسر RESOLV/USDT = استمرار الهبوط.
ليس نصيحة مالية. احرص دائمًا على إجراء بحثك الخاص.
@Resolv Labs
تراجع #RESOLV بنحو 97% تقريبًا من أعلى مستوى له على الإطلاق (ATH) في يونيو 2025، والبالغ $0.4299، إلى $0.0142 في يونيو 2026.
يحاول السعر الآن تحقيق انعكاس كبير من منطقة التجميع بين $0.018 و$0.015، لكن هيكل HTF لا يزال محصورًا داخل مثلث هابط.
المستوى الرئيسي الذي أراقبه هو $0.023:
قد يؤدي إغلاق شمعة HTF مؤكد فوق $0.023 إلى اختراق صعودي وإبطال الهيكل الهابط الحالي. وإذا نجح الاختراق، أتوقع احتمال تحقيق صعود بمقدار 7X–10X انطلاقًا من منطقة التجميع.
مستويات الصعود الرئيسية: $0.036 → $0.060 → $0.130 → أعلى مستوى على الإطلاق (ATH) عند $0.4299
مستوى إبطال الفرضية واضح: إغلاق شمعة HTF دون $0.0142 = إبطال الفرضية الصعودية.
إلى أن يتم اختراق $0.023 مع تأكيد HTF، تظل هذه فرصة قيد التشكّل.
اختراق RESOLV/USDT = تأكيد صعودي.
كسر RESOLV/USDT = استمرار الهبوط.
ليس نصيحة مالية. احرص دائمًا على إجراء بحثك الخاص.
@Resolv Labs
114
·
--
روسيا تُفعّل رسمياً العملات المشفّرة المؤسسية 🇷🇺
أصبح سبيربنك، أكبر بنك في روسيا، مسجلاً رسمياً لدى بنك روسيا بصفته جهة إيداع رقمية خاضعة للتنظيم.
يخطط سبيربنك لإتاحة الوصول المنظّم إلى $BTC و$ETH و$USDT عبر منصاته المصرفية والاستثمارية اعتباراً من 1 ديسمبر 2026، رهناً بالجاهزية التنظيمية.
روسيا تُفعّل رسمياً العملات المشفّرة المؤسسية 🇷🇺
أصبح سبيربنك، أكبر بنك في روسيا، مسجلاً رسمياً لدى بنك روسيا بصفته جهة إيداع رقمية خاضعة للتنظيم.
يخطط سبيربنك لإتاحة الوصول المنظّم إلى $BTC و$ETH و$USDT عبر منصاته المصرفية والاستثمارية اعتباراً من 1 ديسمبر 2026، رهناً بالجاهزية التنظيمية.
أصبح سبيربنك، أكبر بنك في روسيا، مسجلاً رسمياً لدى بنك روسيا بصفته جهة إيداع رقمية خاضعة للتنظيم.
يخطط سبيربنك لإتاحة الوصول المنظّم إلى $BTC و$ETH و$USDT عبر منصاته المصرفية والاستثمارية اعتباراً من 1 ديسمبر 2026، رهناً بالجاهزية التنظيمية.

1
180
·
--
صاعد
$PAID: هل تتهيأ موجة صعود 10X–13X؟ هذا المستوى حاسم!
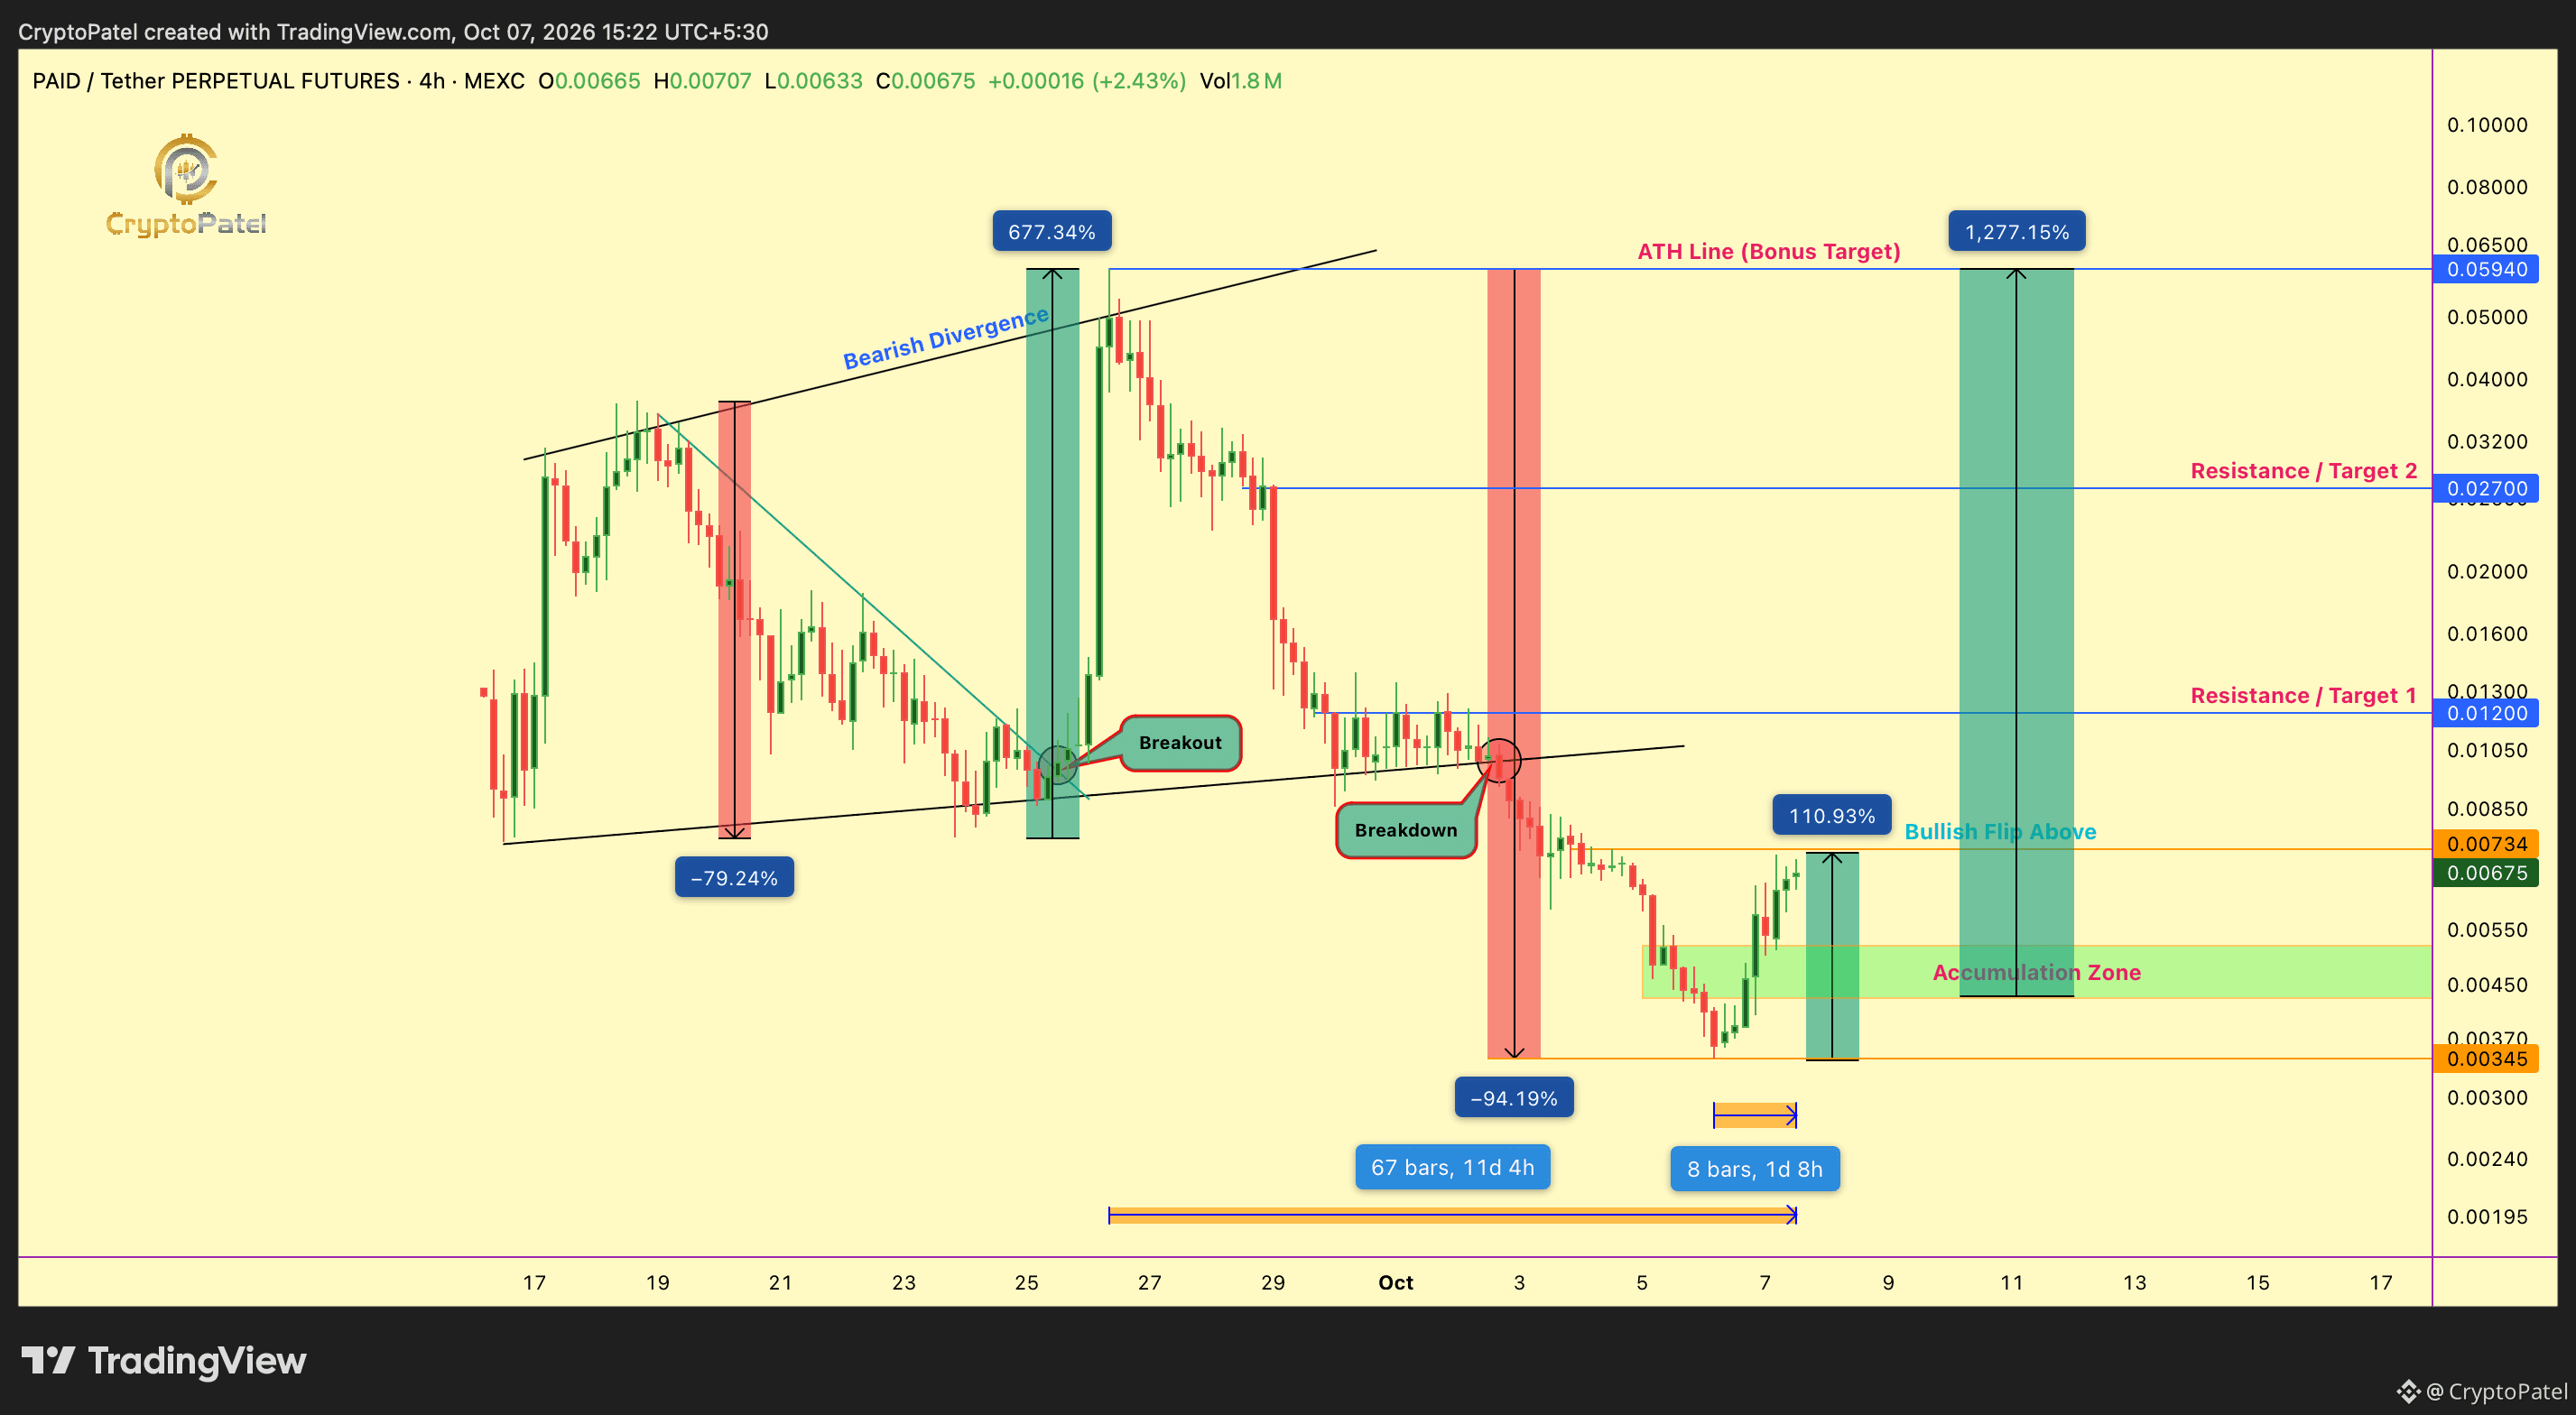
شهد #PAID تقلبات حادة منذ إدراجه في سبتمبر. فبعد أن وصل إلى $0.03692 خلال 3 أيام، هبط بنسبة 79% إلى $0.00766. ثم قفز PAID بنسبة 677% إلى أعلى مستوى له على الإطلاق عند $0.05940 في 4 أيام فقط، قبل أن ينهار مجددًا بنسبة 94% إلى $0.00345 في 6 أكتوبر.
والآن بدأ الانعكاس، إذ ارتفع PAID بالفعل بنحو 110% من القاع الأخير.
المستوى المحوري الآن هو $0.00734:
إذا اخترق PAID مستوى $0.00734 وأغلق فوقه، مع تأكيد الإغلاق على إطار 4 ساعات وإعادة اختبار ناجحة، أتوقع تحولًا صعوديًا في هيكل السوق.
الأهداف: $0.012 → $0.027 → $0.05940 (أعلى مستوى على الإطلاق)
لن ألاحق الارتفاع الحالي. منطقة التجميع المفضلة لدي وفق مستويات فيبوناتشي 0.5–0.618 هي $0.00520–$0.00420.
إذا صمدت هذه المنطقة وتحول مستوى $0.00734 إلى دعم، أرى احتمالًا لسيناريو صعود بمقدار 10X–13X انطلاقًا من منطقة التجميع.
مستوى إبطال السيناريو على الإطار الزمني الأكبر: إغلاق دون $0.00345
من الناحية الأساسية، يستفيد PAID أيضًا من آلية UsePaid التي تحوّل رسوم المنشئين إلى عمليات إعادة شراء PAID وحرقه.
لكن تذكّر: هذه عملة صغيرة القيمة السوقية وشديدة التقلب. إدارة المخاطر أهم من التوقعات.
هذه ليست نصيحة مالية. أجرِ بحثك الخاص.
$PAID: هل تتهيأ موجة صعود 10X–13X؟ هذا المستوى حاسم!
شهد #PAID تقلبات حادة منذ إدراجه في سبتمبر. فبعد أن وصل إلى $0.03692 خلال 3 أيام، هبط بنسبة 79% إلى $0.00766. ثم قفز PAID بنسبة 677% إلى أعلى مستوى له على الإطلاق عند $0.05940 في 4 أيام فقط، قبل أن ينهار مجددًا بنسبة 94% إلى $0.00345 في 6 أكتوبر.
والآن بدأ الانعكاس، إذ ارتفع PAID بالفعل بنحو 110% من القاع الأخير.
المستوى المحوري الآن هو $0.00734:
إذا اخترق PAID مستوى $0.00734 وأغلق فوقه، مع تأكيد الإغلاق على إطار 4 ساعات وإعادة اختبار ناجحة، أتوقع تحولًا صعوديًا في هيكل السوق.
الأهداف: $0.012 → $0.027 → $0.05940 (أعلى مستوى على الإطلاق)
لن ألاحق الارتفاع الحالي. منطقة التجميع المفضلة لدي وفق مستويات فيبوناتشي 0.5–0.618 هي $0.00520–$0.00420.
إذا صمدت هذه المنطقة وتحول مستوى $0.00734 إلى دعم، أرى احتمالًا لسيناريو صعود بمقدار 10X–13X انطلاقًا من منطقة التجميع.
مستوى إبطال السيناريو على الإطار الزمني الأكبر: إغلاق دون $0.00345
من الناحية الأساسية، يستفيد PAID أيضًا من آلية UsePaid التي تحوّل رسوم المنشئين إلى عمليات إعادة شراء PAID وحرقه.
لكن تذكّر: هذه عملة صغيرة القيمة السوقية وشديدة التقلب. إدارة المخاطر أهم من التوقعات.
هذه ليست نصيحة مالية. أجرِ بحثك الخاص.
شهد #PAID تقلبات حادة منذ إدراجه في سبتمبر. فبعد أن وصل إلى $0.03692 خلال 3 أيام، هبط بنسبة 79% إلى $0.00766. ثم قفز PAID بنسبة 677% إلى أعلى مستوى له على الإطلاق عند $0.05940 في 4 أيام فقط، قبل أن ينهار مجددًا بنسبة 94% إلى $0.00345 في 6 أكتوبر.
والآن بدأ الانعكاس، إذ ارتفع PAID بالفعل بنحو 110% من القاع الأخير.
المستوى المحوري الآن هو $0.00734:
إذا اخترق PAID مستوى $0.00734 وأغلق فوقه، مع تأكيد الإغلاق على إطار 4 ساعات وإعادة اختبار ناجحة، أتوقع تحولًا صعوديًا في هيكل السوق.
الأهداف: $0.012 → $0.027 → $0.05940 (أعلى مستوى على الإطلاق)
لن ألاحق الارتفاع الحالي. منطقة التجميع المفضلة لدي وفق مستويات فيبوناتشي 0.5–0.618 هي $0.00520–$0.00420.
إذا صمدت هذه المنطقة وتحول مستوى $0.00734 إلى دعم، أرى احتمالًا لسيناريو صعود بمقدار 10X–13X انطلاقًا من منطقة التجميع.
مستوى إبطال السيناريو على الإطار الزمني الأكبر: إغلاق دون $0.00345
من الناحية الأساسية، يستفيد PAID أيضًا من آلية UsePaid التي تحوّل رسوم المنشئين إلى عمليات إعادة شراء PAID وحرقه.
لكن تذكّر: هذه عملة صغيرة القيمة السوقية وشديدة التقلب. إدارة المخاطر أهم من التوقعات.
هذه ليست نصيحة مالية. أجرِ بحثك الخاص.
1
148
·
--
صاعد
تنبيه سعر إيثيريوم: قد يحدد $2,562 الحركة الرئيسية التالية $ETH
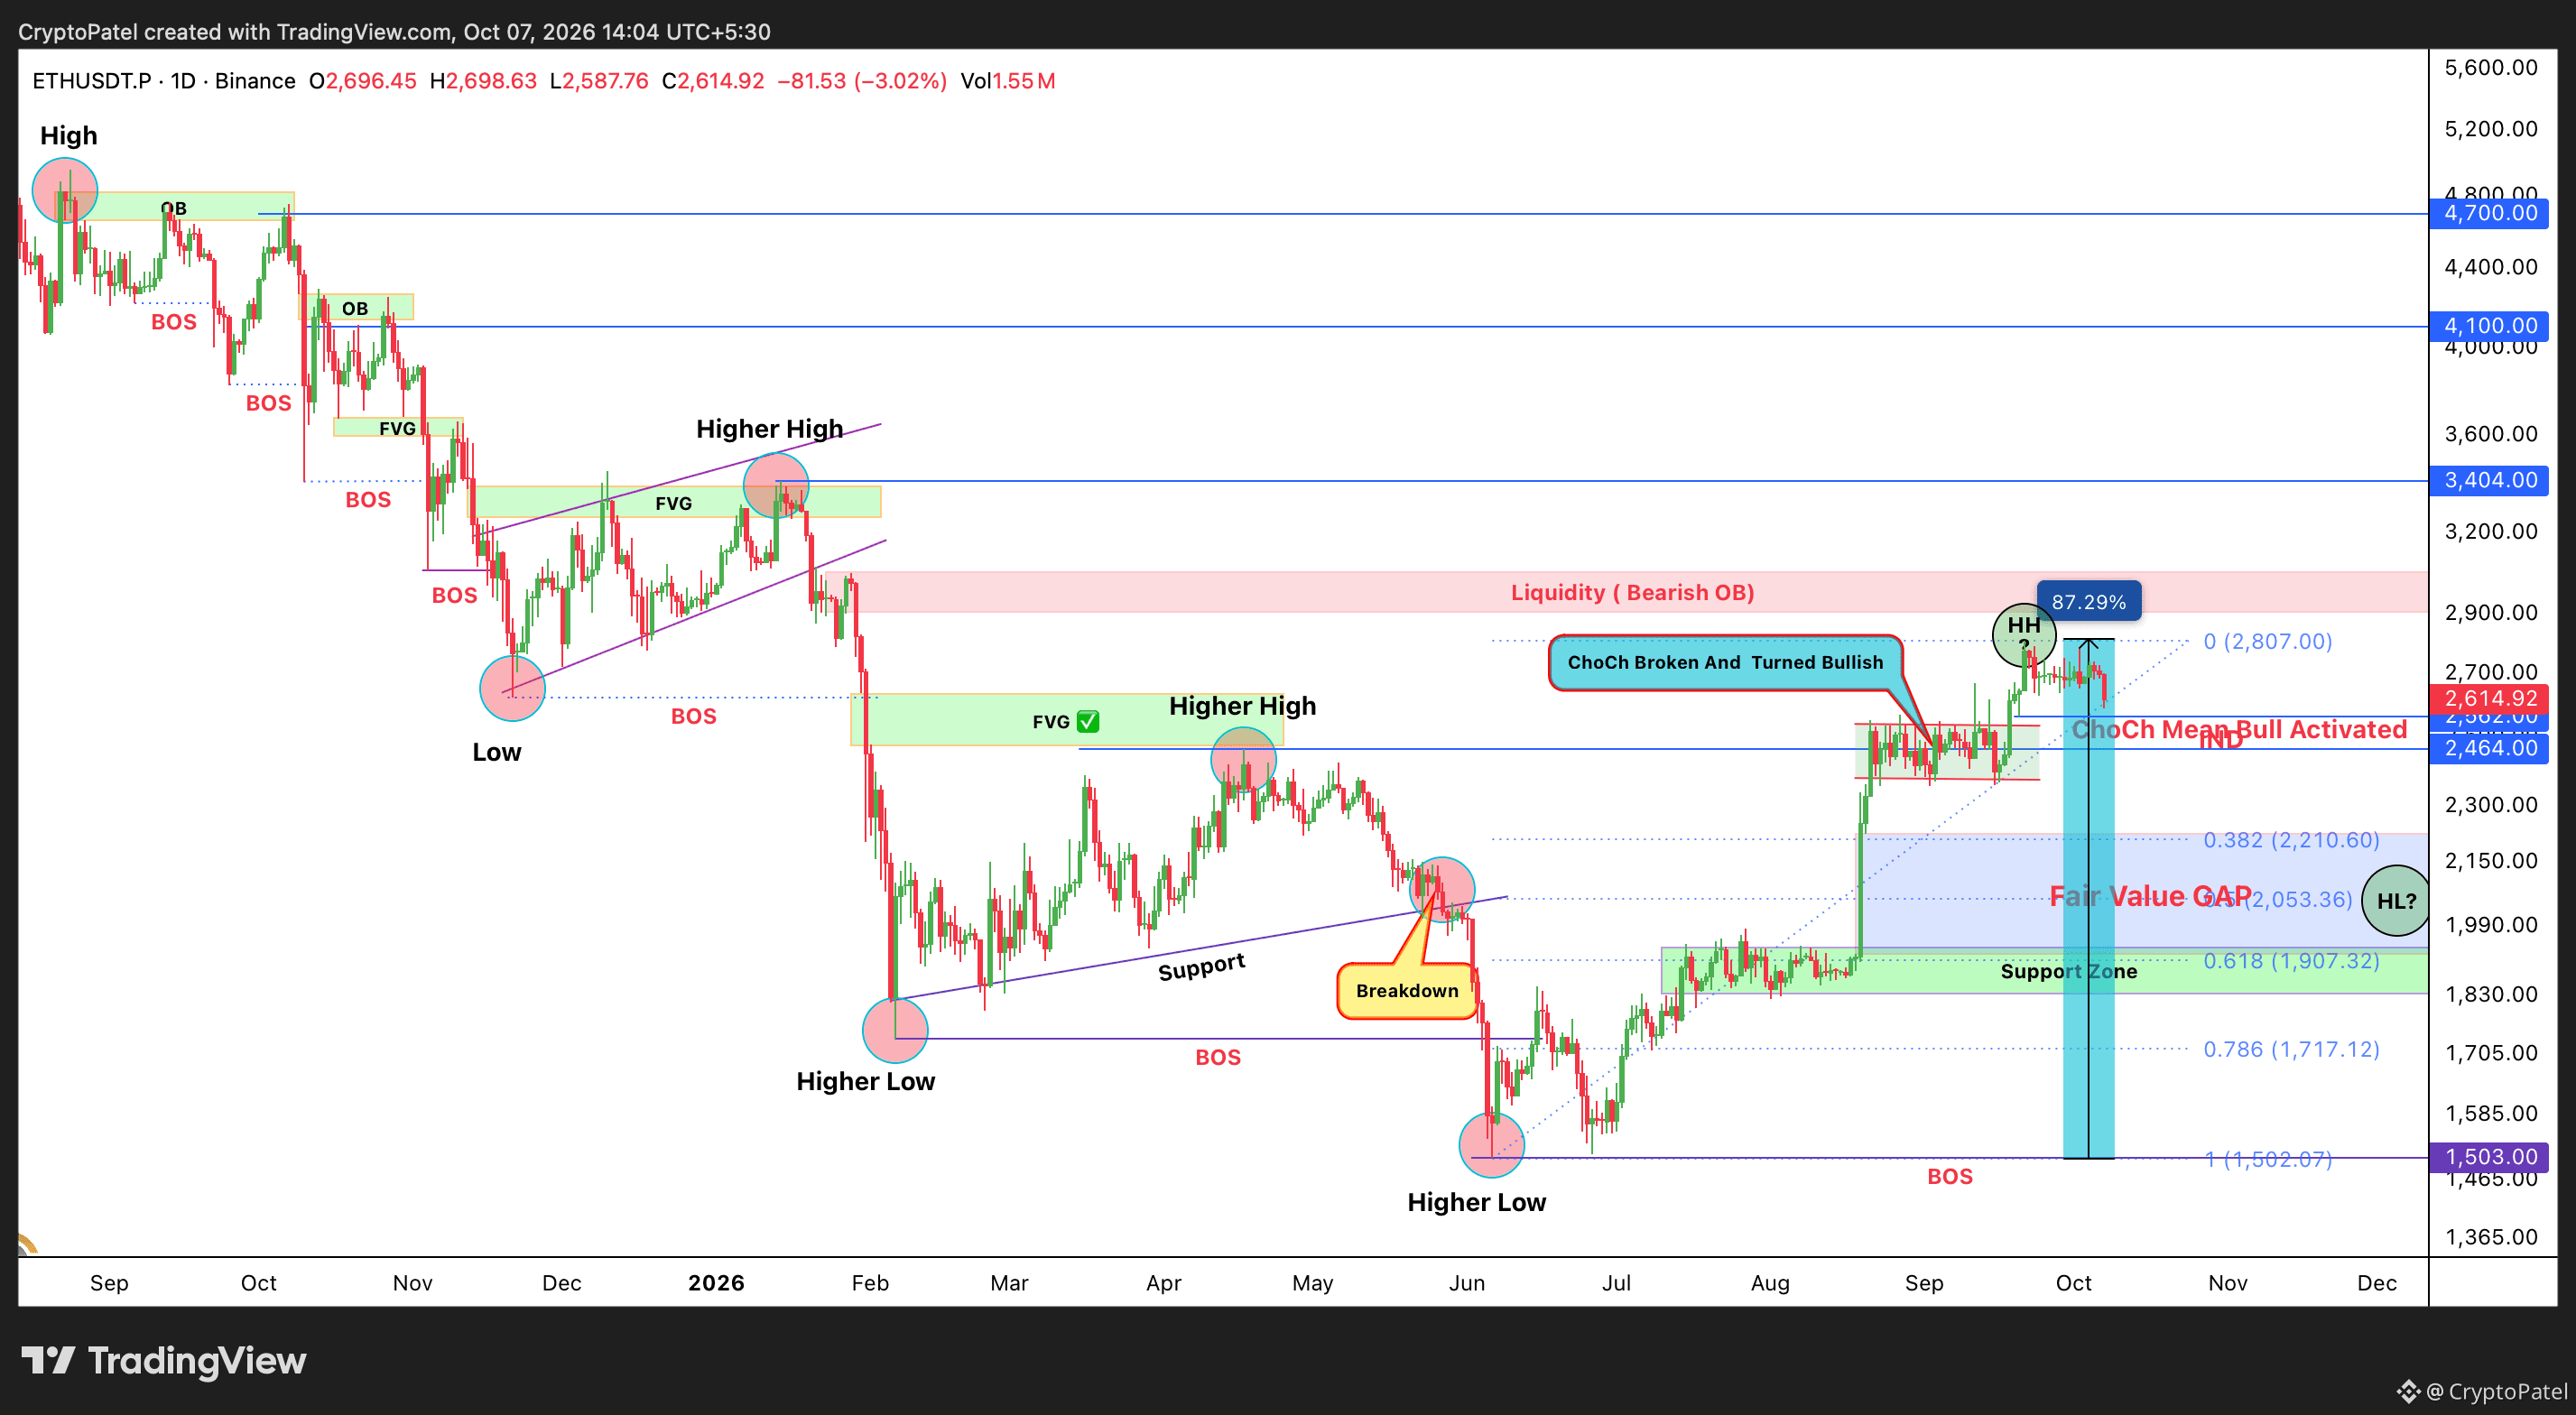
يقترب #ETH من منطقة قرار حرجة في SMC. يُظهر الرسم البياني أن $2,562 مستوى استدراج رئيسي. إذا كسرته الشمعة اليومية وأغلقت دونه، فسأحوّل تركيزي إلى القاع الأعلى التالي بدلًا من ملاحقة السعر.
منطقة تجميعي لـ ETH: سأراقب عن كثب نطاق $2,053–$1,868، حيث قد تتلاقى عدة عوامل:
→ تصحيح فيبوناتشي 0.5–0.618
→ فجوة القيمة العادلة (FVG)
→ كتلة أوامر صاعدة
→ تشكّل قاع أعلى
→ دعم فيبوناتشي
إذا دخل ETH هذه المنطقة وأكد تحوّلًا/كسرًا في بنية السوق صعودًا (MSS/BOS)، فسأعتبرها منطقة محتملة للتجميع على المدى الطويل استعدادًا للتوسع الرئيسي التالي.
أهداف ETH طويلة الأجل: $5,000 | $10,000+
ذيل هابط حاد محتمل: أراقب أيضًا مستوى فيبوناتشي 0.786 قرب $1,717.
قد تستهدف العملات الرقمية أحيانًا سيولة عميقة بذيل حاد قبل أن تنعكس بقوة. لذلك، سأضع أمر شراء إضافيًا صغيرًا حول $1,717 تحسبًا لذيل هبوط ناتج عن الاستسلام.
الخطة:
كسر $2,562 → انتظار قاع أعلى → منطقة FVG/OB وفيبوناتشي بين $2,053 و$1,868 → تأكيد صعودي → تجميع → استهداف $5K/$10K+.
لا أحاول التنبؤ بكل شمعة لـ ETH.
أراقب أين تُسحب السيولة، وأين قد يظهر طلب الأموال الذكية، وأين تصبح نسبة المخاطرة إلى العائد غير متكافئة.
ليست نصيحة مالية. أجرِ بحثك بنفسك.
{future}(ETHUSDT)
تنبيه سعر إيثيريوم: قد يحدد $2,562 الحركة الرئيسية التالية $ETH
يقترب #ETH من منطقة قرار حرجة في SMC. يُظهر الرسم البياني أن $2,562 مستوى استدراج رئيسي. إذا كسرته الشمعة اليومية وأغلقت دونه، فسأحوّل تركيزي إلى القاع الأعلى التالي بدلًا من ملاحقة السعر.
منطقة تجميعي لـ ETH: سأراقب عن كثب نطاق $2,053–$1,868، حيث قد تتلاقى عدة عوامل:
→ تصحيح فيبوناتشي 0.5–0.618
→ فجوة القيمة العادلة (FVG)
→ كتلة أوامر صاعدة
→ تشكّل قاع أعلى
→ دعم فيبوناتشي
إذا دخل ETH هذه المنطقة وأكد تحوّلًا/كسرًا في بنية السوق صعودًا (MSS/BOS)، فسأعتبرها منطقة محتملة للتجميع على المدى الطويل استعدادًا للتوسع الرئيسي التالي.
أهداف ETH طويلة الأجل: $5,000 | $10,000+
ذيل هابط حاد محتمل: أراقب أيضًا مستوى فيبوناتشي 0.786 قرب $1,717.
قد تستهدف العملات الرقمية أحيانًا سيولة عميقة بذيل حاد قبل أن تنعكس بقوة. لذلك، سأضع أمر شراء إضافيًا صغيرًا حول $1,717 تحسبًا لذيل هبوط ناتج عن الاستسلام.
الخطة:
كسر $2,562 → انتظار قاع أعلى → منطقة FVG/OB وفيبوناتشي بين $2,053 و$1,868 → تأكيد صعودي → تجميع → استهداف $5K/$10K+.
لا أحاول التنبؤ بكل شمعة لـ ETH.
أراقب أين تُسحب السيولة، وأين قد يظهر طلب الأموال الذكية، وأين تصبح نسبة المخاطرة إلى العائد غير متكافئة.
ليست نصيحة مالية. أجرِ بحثك بنفسك.
يقترب #ETH من منطقة قرار حرجة في SMC. يُظهر الرسم البياني أن $2,562 مستوى استدراج رئيسي. إذا كسرته الشمعة اليومية وأغلقت دونه، فسأحوّل تركيزي إلى القاع الأعلى التالي بدلًا من ملاحقة السعر.
منطقة تجميعي لـ ETH: سأراقب عن كثب نطاق $2,053–$1,868، حيث قد تتلاقى عدة عوامل:
→ تصحيح فيبوناتشي 0.5–0.618
→ فجوة القيمة العادلة (FVG)
→ كتلة أوامر صاعدة
→ تشكّل قاع أعلى
→ دعم فيبوناتشي
إذا دخل ETH هذه المنطقة وأكد تحوّلًا/كسرًا في بنية السوق صعودًا (MSS/BOS)، فسأعتبرها منطقة محتملة للتجميع على المدى الطويل استعدادًا للتوسع الرئيسي التالي.
أهداف ETH طويلة الأجل: $5,000 | $10,000+
ذيل هابط حاد محتمل: أراقب أيضًا مستوى فيبوناتشي 0.786 قرب $1,717.
قد تستهدف العملات الرقمية أحيانًا سيولة عميقة بذيل حاد قبل أن تنعكس بقوة. لذلك، سأضع أمر شراء إضافيًا صغيرًا حول $1,717 تحسبًا لذيل هبوط ناتج عن الاستسلام.
الخطة:
كسر $2,562 → انتظار قاع أعلى → منطقة FVG/OB وفيبوناتشي بين $2,053 و$1,868 → تأكيد صعودي → تجميع → استهداف $5K/$10K+.
لا أحاول التنبؤ بكل شمعة لـ ETH.
أراقب أين تُسحب السيولة، وأين قد يظهر طلب الأموال الذكية، وأين تصبح نسبة المخاطرة إلى العائد غير متكافئة.
ليست نصيحة مالية. أجرِ بحثك بنفسك.
139
·
--
هابط
$BTC عند مستوى حاسم: 80,180 دولارًا ستحدد الحركة الهبوطية الكبيرة التالية
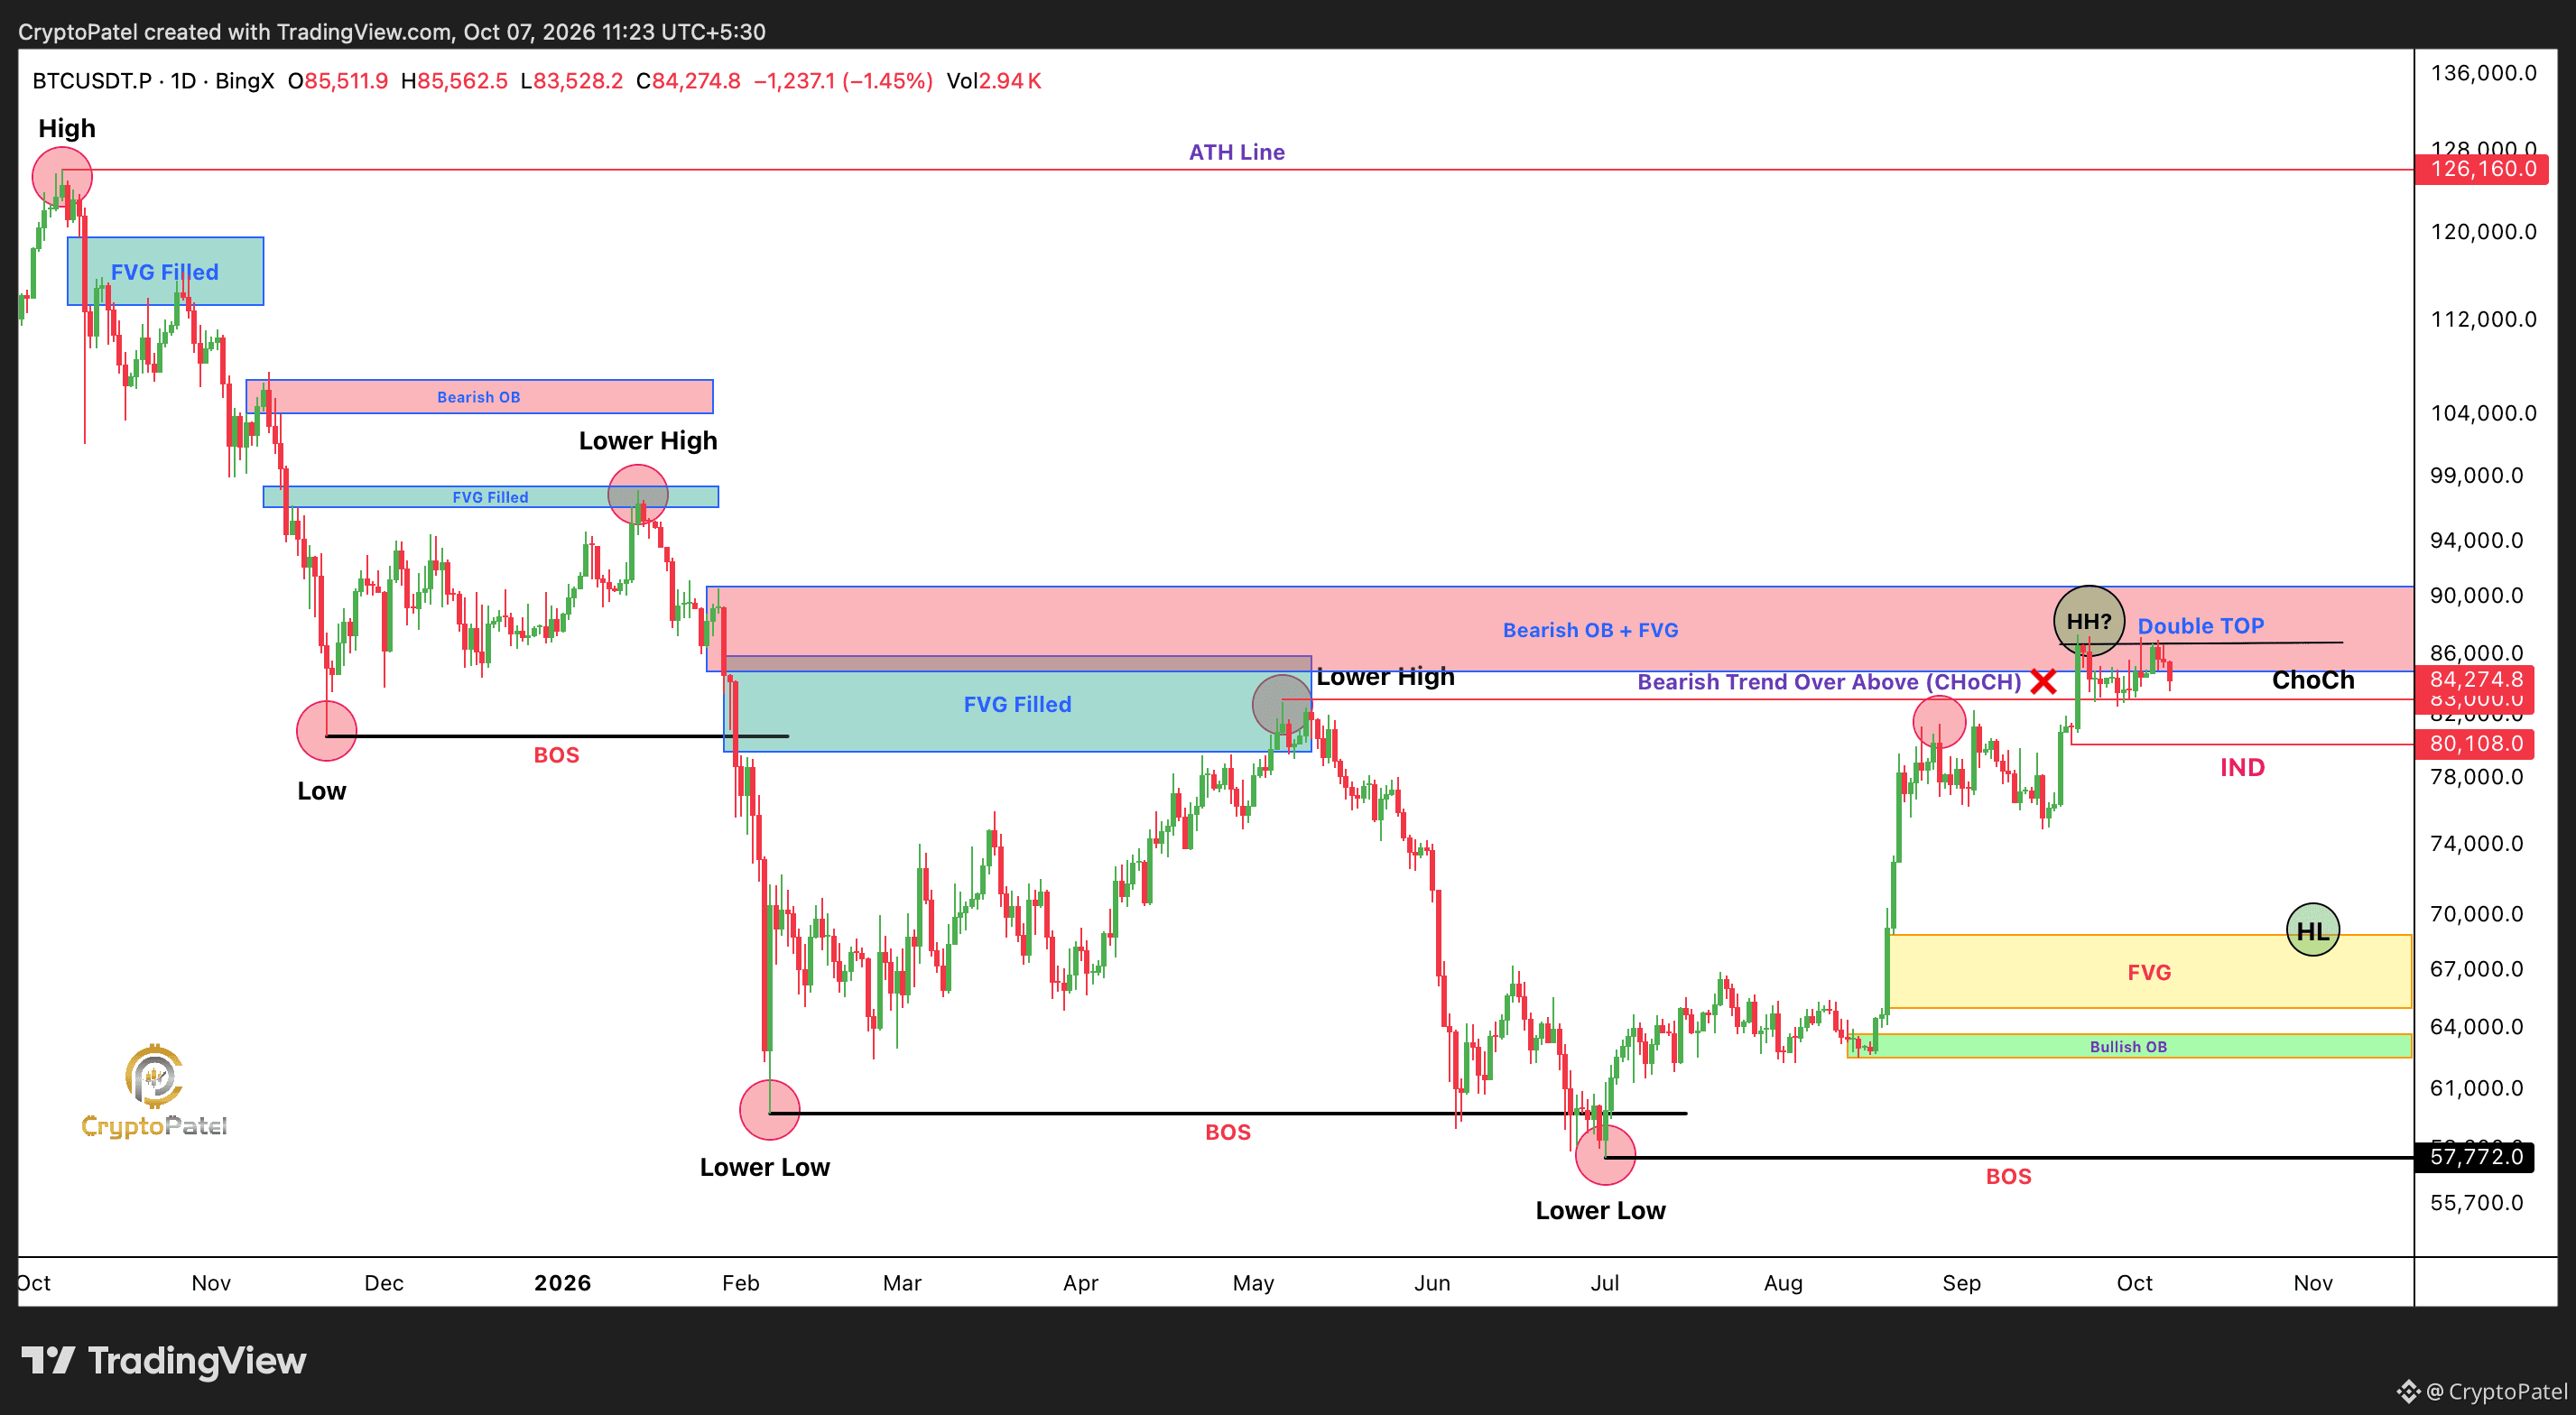
يجب أن يكسر #BTC مستوى 80,180 دولارًا لتأكيد تشكّل بنية جديدة من قمة أعلى وقاع أعلى.
إذا كُسر مستوى 80,180 دولارًا هبوطًا، فستصبح 87,368 دولارًا القمة الأعلى المؤكدة، وسأستهدف القاع الأعلى التالي قرب فجوة القيمة العادلة / كتلة الأوامر الصاعدة، في نطاق 69 ألفًا إلى 63 ألف دولار.
إذا صمدت كتلة الأوامر الصاعدة، فقد يمهّد هذا التراجع للحركة التالية باتجاه أكثر من 100 ألف دولار.
{future}(BTCUSDT)
$BTC عند مستوى حاسم: 80,180 دولارًا ستحدد الحركة الهبوطية الكبيرة التالية
يجب أن يكسر #BTC مستوى 80,180 دولارًا لتأكيد تشكّل بنية جديدة من قمة أعلى وقاع أعلى.
إذا كُسر مستوى 80,180 دولارًا هبوطًا، فستصبح 87,368 دولارًا القمة الأعلى المؤكدة، وسأستهدف القاع الأعلى التالي قرب فجوة القيمة العادلة / كتلة الأوامر الصاعدة، في نطاق 69 ألفًا إلى 63 ألف دولار.
إذا صمدت كتلة الأوامر الصاعدة، فقد يمهّد هذا التراجع للحركة التالية باتجاه أكثر من 100 ألف دولار.
يجب أن يكسر #BTC مستوى 80,180 دولارًا لتأكيد تشكّل بنية جديدة من قمة أعلى وقاع أعلى.
إذا كُسر مستوى 80,180 دولارًا هبوطًا، فستصبح 87,368 دولارًا القمة الأعلى المؤكدة، وسأستهدف القاع الأعلى التالي قرب فجوة القيمة العادلة / كتلة الأوامر الصاعدة، في نطاق 69 ألفًا إلى 63 ألف دولار.
إذا صمدت كتلة الأوامر الصاعدة، فقد يمهّد هذا التراجع للحركة التالية باتجاه أكثر من 100 ألف دولار.
186
·
--
الحكومة الأمريكية تنقل 103 ملايين دولار من العملات المشفرة | تحذير من بيع البيتكوين؟
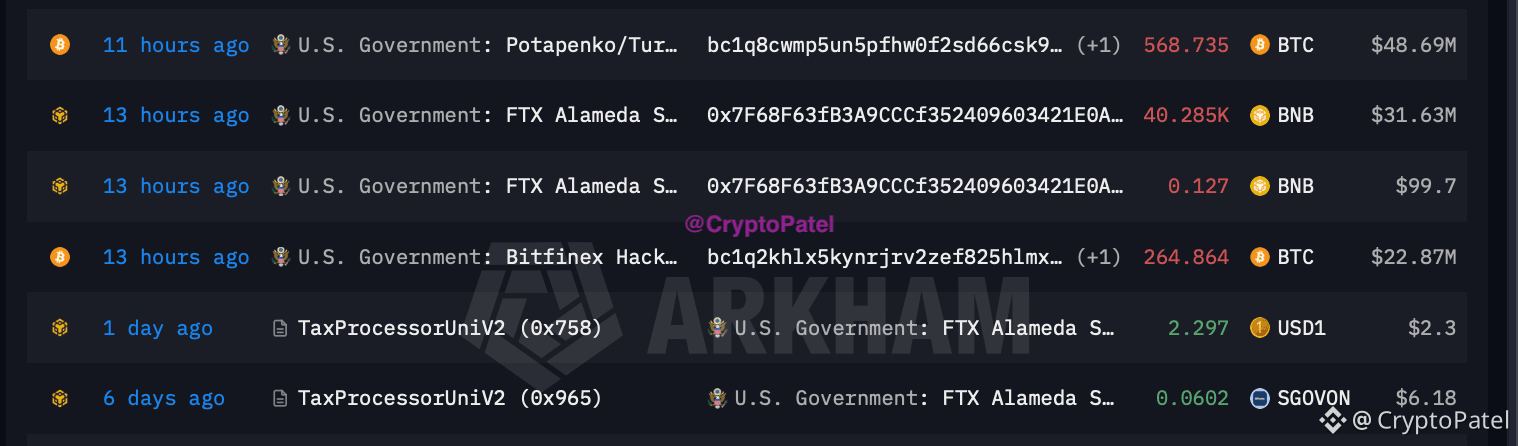
نقلت الحكومة الأمريكية للتوّ دفعة أخرى من العملات المشفرة بقيمة 103.19 مليون دولار:
▶️ 833.6 $BTC → 71.56 مليون دولار
▶️ 40,285 $BNB → 31.63 مليون دولار
أُودِعت جميع وحدات البيتكوين الـ834 في Coinbase Prime.
فهل هذا مجرد تحويل إلى جهة حفظ، أم أن الولايات المتحدة تستعد لبيع بيتكوين آخر؟
الحكومة الأمريكية تنقل 103 ملايين دولار من العملات المشفرة | تحذير من بيع البيتكوين؟
نقلت الحكومة الأمريكية للتوّ دفعة أخرى من العملات المشفرة بقيمة 103.19 مليون دولار:
▶️ 833.6 $BTC → 71.56 مليون دولار
▶️ 40,285 $BNB → 31.63 مليون دولار
أُودِعت جميع وحدات البيتكوين الـ834 في Coinbase Prime.
فهل هذا مجرد تحويل إلى جهة حفظ، أم أن الولايات المتحدة تستعد لبيع بيتكوين آخر؟
نقلت الحكومة الأمريكية للتوّ دفعة أخرى من العملات المشفرة بقيمة 103.19 مليون دولار:
▶️ 833.6 $BTC → 71.56 مليون دولار
▶️ 40,285 $BNB → 31.63 مليون دولار
أُودِعت جميع وحدات البيتكوين الـ834 في Coinbase Prime.
فهل هذا مجرد تحويل إلى جهة حفظ، أم أن الولايات المتحدة تستعد لبيع بيتكوين آخر؟
214
·
--
هابط
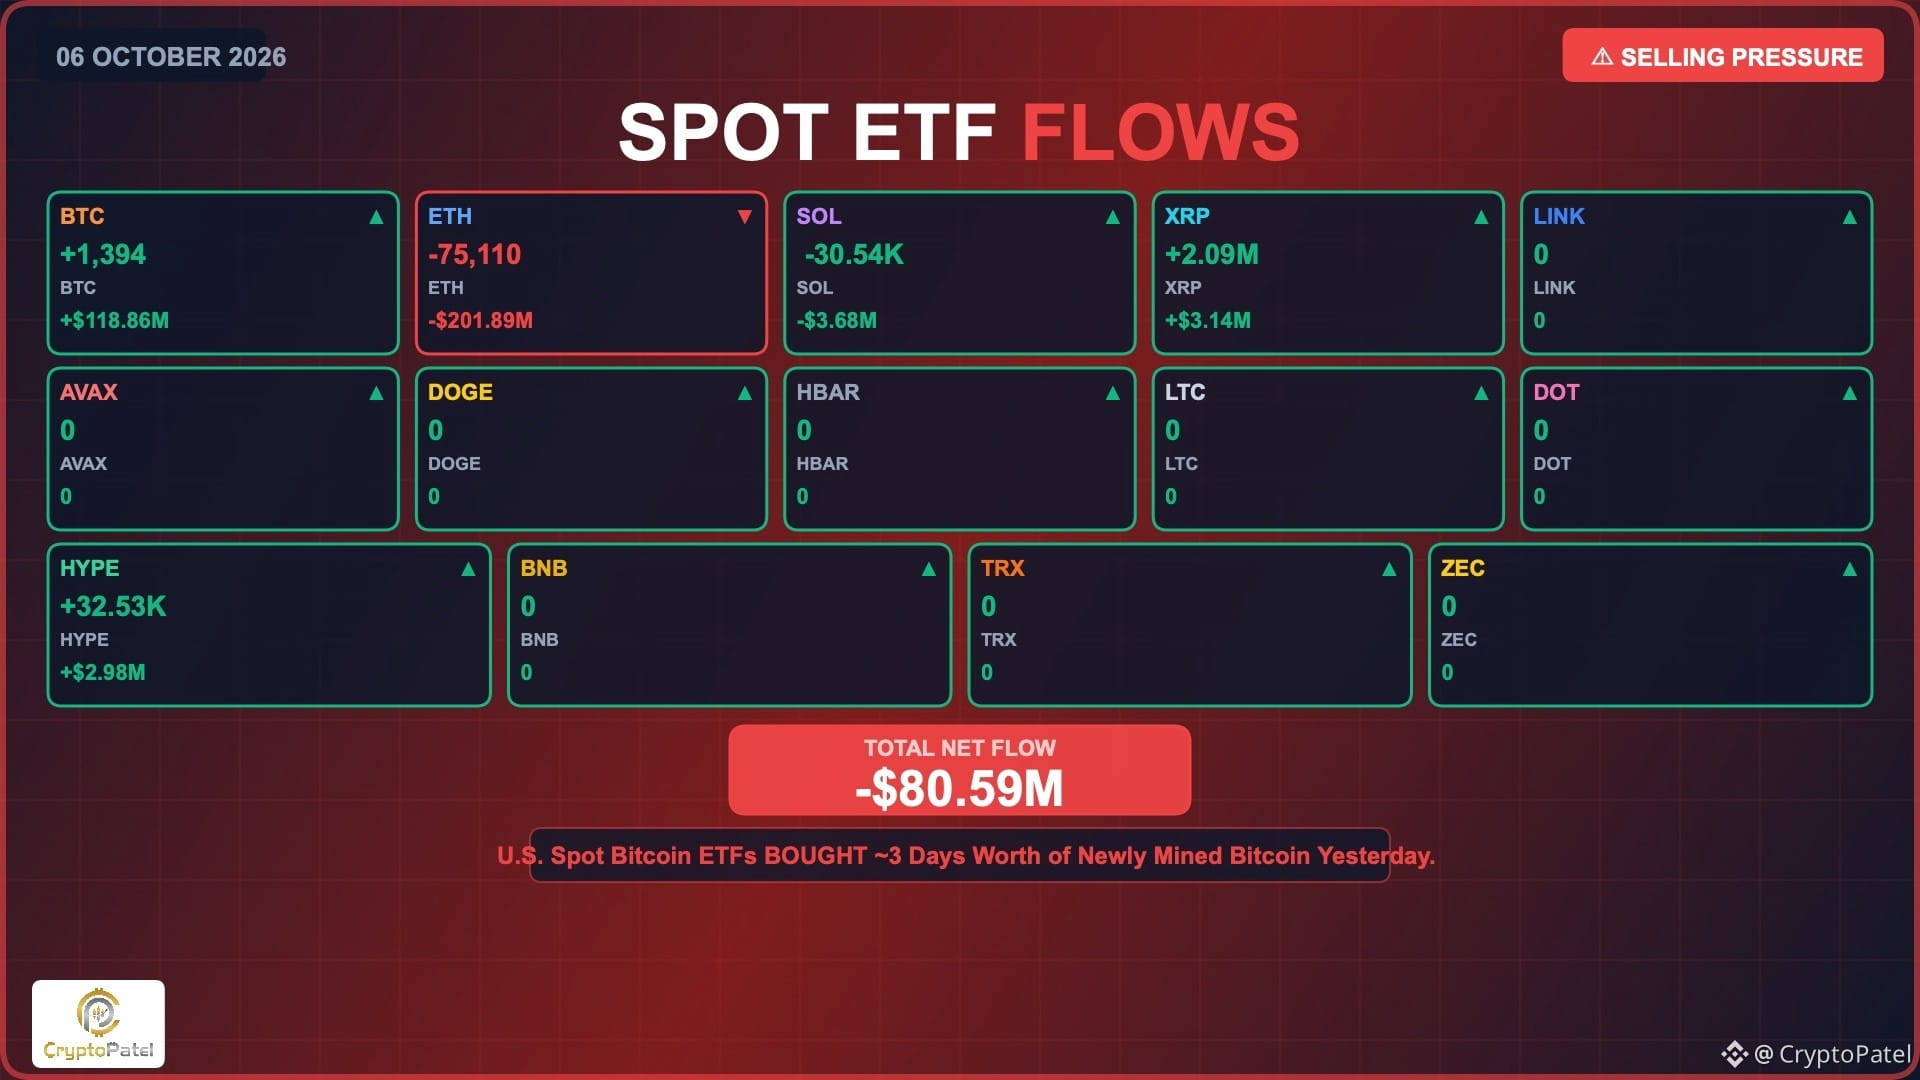
تدفقات صناديق ETF: تحديث بيانات تدفقات صناديق ETF الفورية للعملات المشفرة في الولايات المتحدة (06-10-2026) أمس
🟩 صناديق Bitcoin ETF: +1,394 $BTC (+$118.86M)
🟥 صناديق Ethereum ETF: -75,110 $ETH (-$201.89M)
🟥 صناديق SOLANA ETF: -30.54K $SOL (-$3.68M)
🟩 صناديق XRP ETF: +2.09M $XRP (+$3.14M)
🟩 صناديق HYPE ETF: +32.53K $HYPE (+$2.98M)
🟩 لم تسجل تدفقات $BNB و$DOT و$TRX و$LTC و$DOGE و$LINK و$AVAX و$HBAR و$NEAR و$ZEC أي تغيير.
إجمالي التدفقات الخارجة من صناديق ETF الفورية للعملات المشفرة في الولايات المتحدة: ≈ -$80.59M
اشترت صناديق Bitcoin ETF الفورية الأمريكية نحو 1,394 BTC بقيمة $118.86M
🇺🇸 اشترى صندوق ETF التابع لـ BlackRock عدد 1,430 BTC مقابل $122M، وباع 75,110 ETH مقابل $201.89M
🇺🇸 باع صندوق ETF التابع لـ Grayscale عدد 128 BTC مقابل $10.97M
🇺🇸 اشترى صندوق ETF التابع لـ Morgan Stanley عدد 92 BTC مقابل $7.84M
اشترى عملاء BlackRock عدد 1,430 BTC بقيمة 122 مليون دولار، وباعوا 75,110 BTC بقيمة 201.89 مليون دولار.
معلومة: اشترت صناديق Bitcoin ETF الفورية الأمريكية أمس ما يعادل نحو 3 أيام من كمية البيتكوين المستخرجة حديثًا.
تدفقات صناديق ETF: تحديث بيانات تدفقات صناديق ETF الفورية للعملات المشفرة في الولايات المتحدة (06-10-2026) أمس
🟩 صناديق Bitcoin ETF: +1,394 $BTC (+$118.86M)
🟥 صناديق Ethereum ETF: -75,110 $ETH (-$201.89M)
🟥 صناديق SOLANA ETF: -30.54K $SOL (-$3.68M)
🟩 صناديق XRP ETF: +2.09M $XRP (+$3.14M)
🟩 صناديق HYPE ETF: +32.53K $HYPE (+$2.98M)
🟩 لم تسجل تدفقات $BNB و$DOT و$TRX و$LTC و$DOGE و$LINK و$AVAX و$HBAR و$NEAR و$ZEC أي تغيير.
إجمالي التدفقات الخارجة من صناديق ETF الفورية للعملات المشفرة في الولايات المتحدة: ≈ -$80.59M
اشترت صناديق Bitcoin ETF الفورية الأمريكية نحو 1,394 BTC بقيمة $118.86M
🇺🇸 اشترى صندوق ETF التابع لـ BlackRock عدد 1,430 BTC مقابل $122M، وباع 75,110 ETH مقابل $201.89M
🇺🇸 باع صندوق ETF التابع لـ Grayscale عدد 128 BTC مقابل $10.97M
🇺🇸 اشترى صندوق ETF التابع لـ Morgan Stanley عدد 92 BTC مقابل $7.84M
اشترى عملاء BlackRock عدد 1,430 BTC بقيمة 122 مليون دولار، وباعوا 75,110 BTC بقيمة 201.89 مليون دولار.
معلومة: اشترت صناديق Bitcoin ETF الفورية الأمريكية أمس ما يعادل نحو 3 أيام من كمية البيتكوين المستخرجة حديثًا.
🟩 صناديق Bitcoin ETF: +1,394 $BTC (+$118.86M)
🟥 صناديق Ethereum ETF: -75,110 $ETH (-$201.89M)
🟥 صناديق SOLANA ETF: -30.54K $SOL (-$3.68M)
🟩 صناديق XRP ETF: +2.09M $XRP (+$3.14M)
🟩 صناديق HYPE ETF: +32.53K $HYPE (+$2.98M)
🟩 لم تسجل تدفقات $BNB و$DOT و$TRX و$LTC و$DOGE و$LINK و$AVAX و$HBAR و$NEAR و$ZEC أي تغيير.
إجمالي التدفقات الخارجة من صناديق ETF الفورية للعملات المشفرة في الولايات المتحدة: ≈ -$80.59M
اشترت صناديق Bitcoin ETF الفورية الأمريكية نحو 1,394 BTC بقيمة $118.86M
🇺🇸 اشترى صندوق ETF التابع لـ BlackRock عدد 1,430 BTC مقابل $122M، وباع 75,110 ETH مقابل $201.89M
🇺🇸 باع صندوق ETF التابع لـ Grayscale عدد 128 BTC مقابل $10.97M
🇺🇸 اشترى صندوق ETF التابع لـ Morgan Stanley عدد 92 BTC مقابل $7.84M
اشترى عملاء BlackRock عدد 1,430 BTC بقيمة 122 مليون دولار، وباعوا 75,110 BTC بقيمة 201.89 مليون دولار.
معلومة: اشترت صناديق Bitcoin ETF الفورية الأمريكية أمس ما يعادل نحو 3 أيام من كمية البيتكوين المستخرجة حديثًا.
128
·
--
صاعد
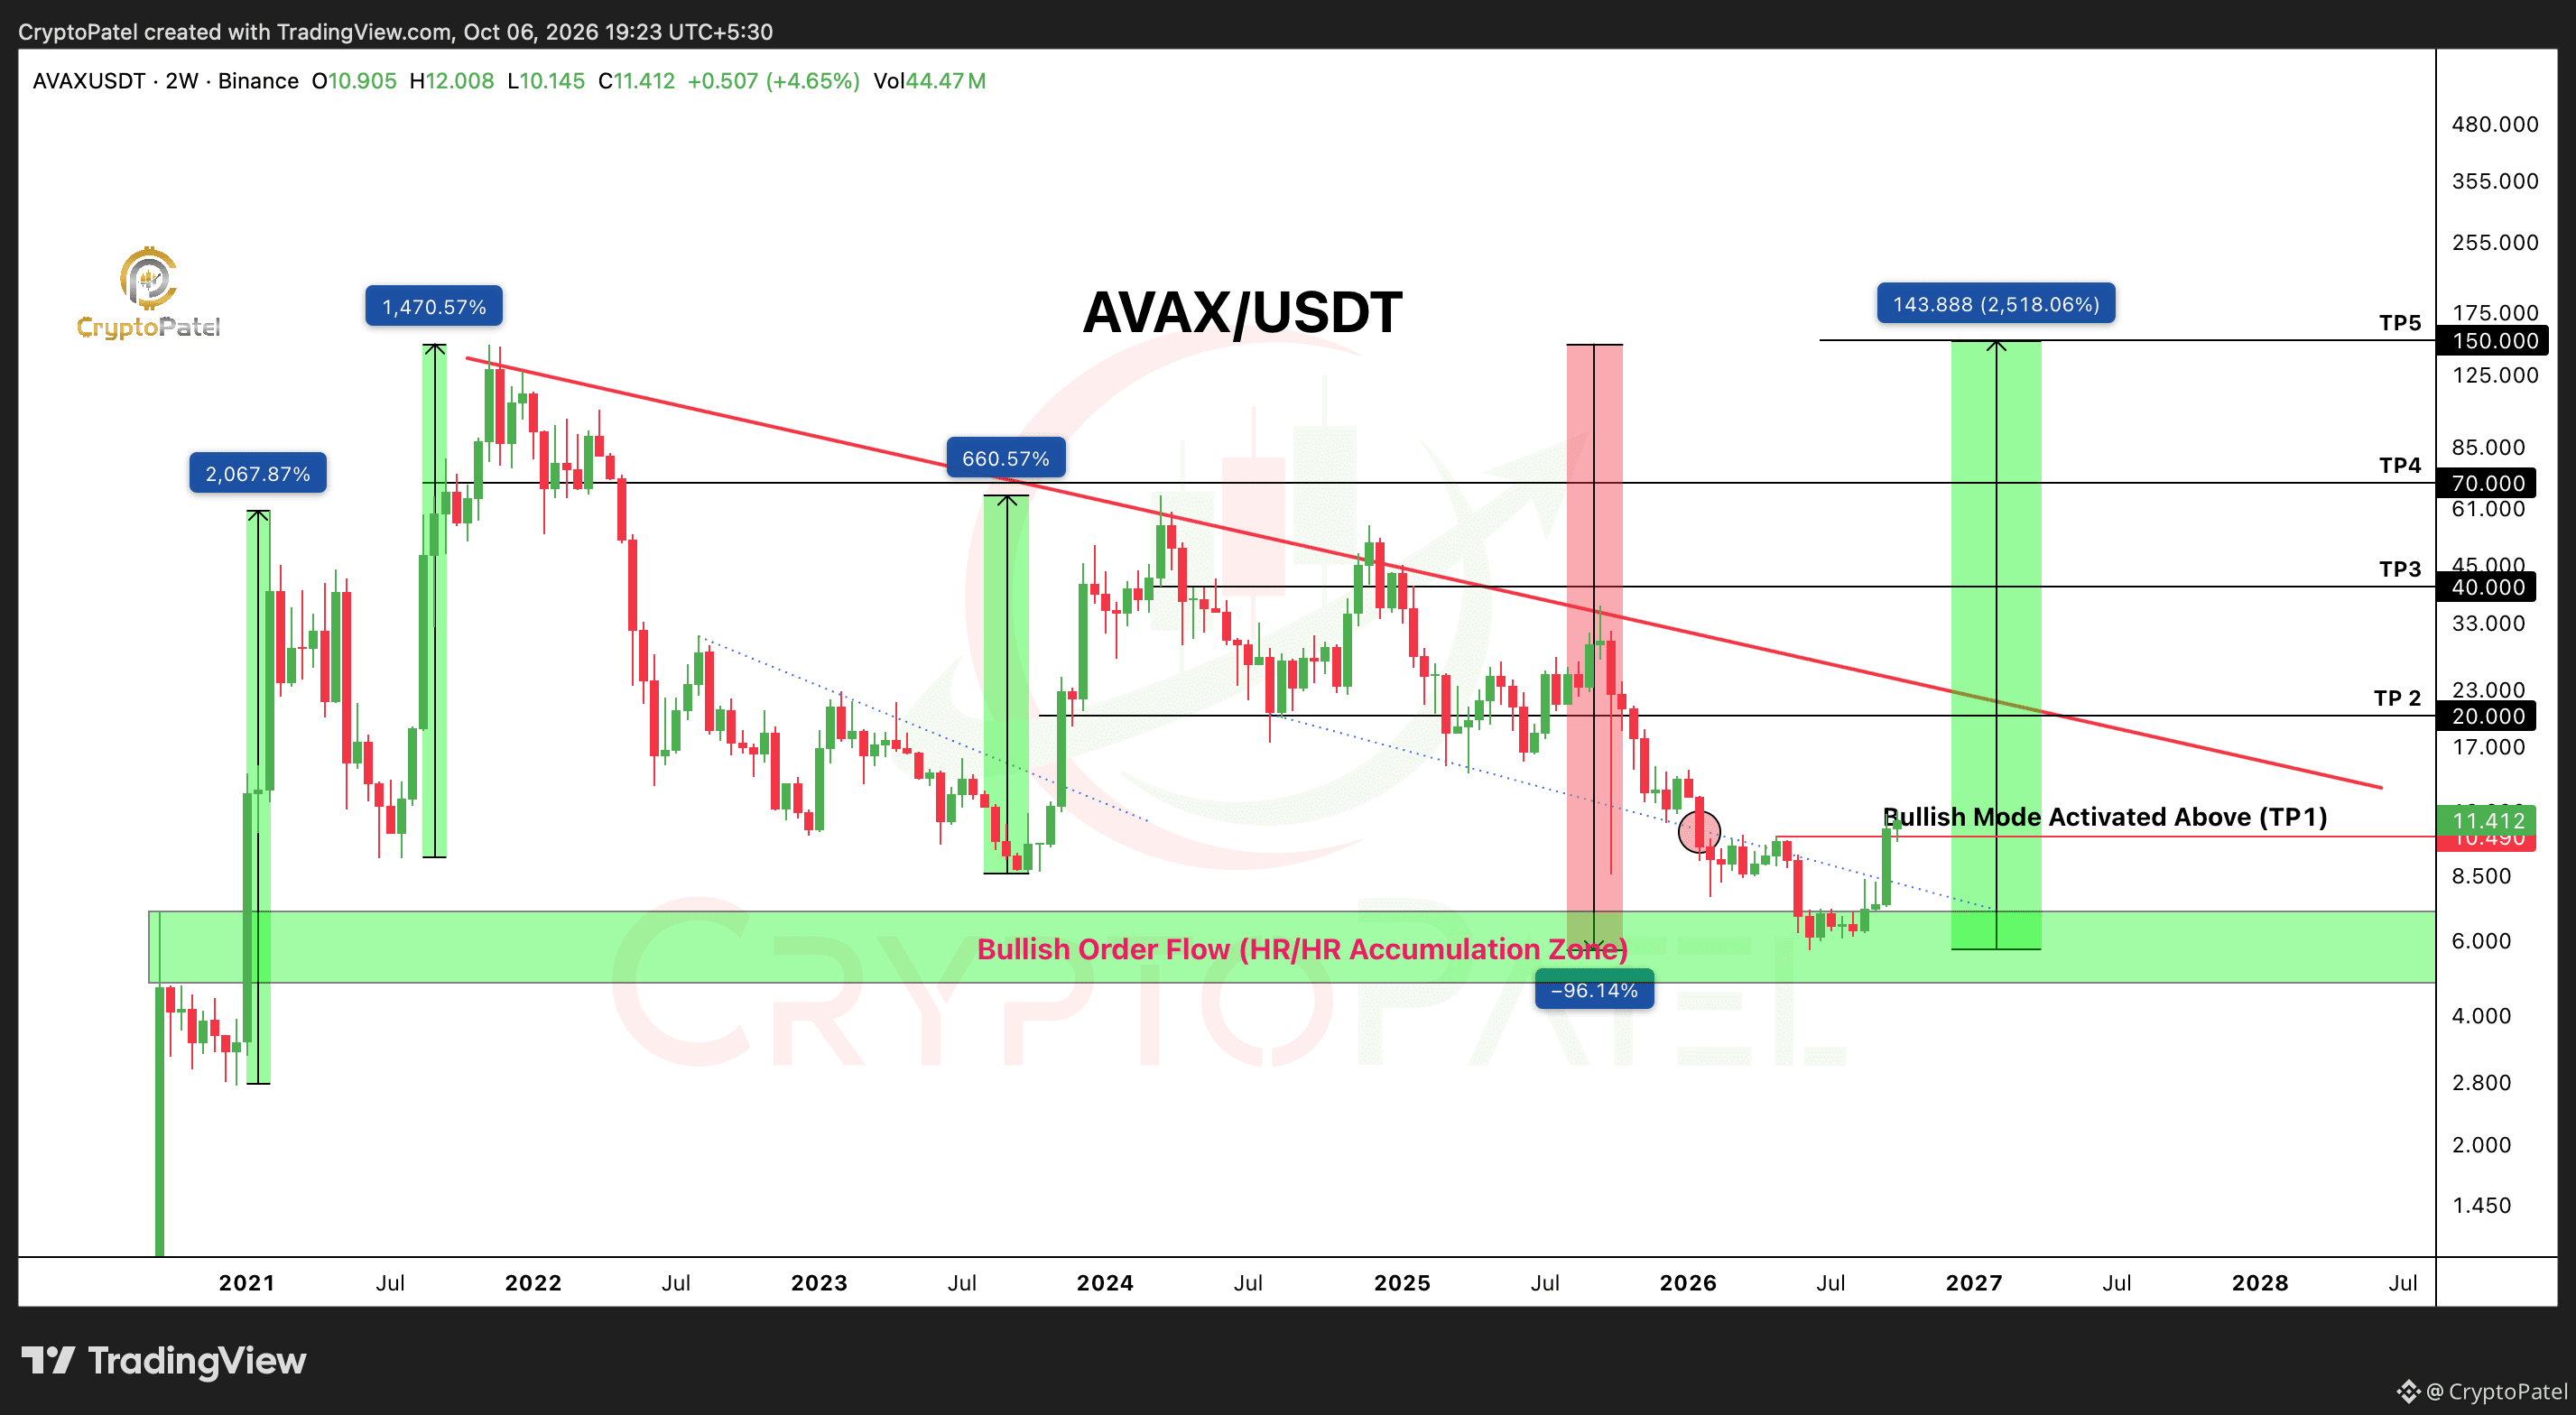
$AVAX هل تحوّل للتو إلى الاتجاه الصعودي؟ هل الحركة التالية بمقدار 10X–13X؟
قد يكون #AVAX على وشك انعكاس هائل طويل الأمد.
بعد تراجع قاسٍ بنحو 96%، استعاد AVAX منطقة التفعيل الصعودي عند 11.40 دولارًا.
أترقب الآن اختراق خط الاتجاه الهابط على الإطار الزمني الأعلى.
الأهداف: 20 دولارًا | 40 دولارًا | 70 دولارًا | 150 دولارًا
قد يؤدي الاختراق إلى انطلاق موجة صعود كبرى لـ $AVAX .
هل يمكن أن تكون AVAX العملة البديلة التالية التي تحقق ارتفاعًا بمقدار 10 أضعاف؟ 🚀
هذه ليست نصيحة مالية. أجرِ بحثك بنفسك.
{future}(AVAXUSDT)
$AVAX هل تحوّل للتو إلى الاتجاه الصعودي؟ هل الحركة التالية بمقدار 10X–13X؟
قد يكون #AVAX على وشك انعكاس هائل طويل الأمد.
بعد تراجع قاسٍ بنحو 96%، استعاد AVAX منطقة التفعيل الصعودي عند 11.40 دولارًا.
أترقب الآن اختراق خط الاتجاه الهابط على الإطار الزمني الأعلى.
الأهداف: 20 دولارًا | 40 دولارًا | 70 دولارًا | 150 دولارًا
قد يؤدي الاختراق إلى انطلاق موجة صعود كبرى لـ $AVAX .
هل يمكن أن تكون AVAX العملة البديلة التالية التي تحقق ارتفاعًا بمقدار 10 أضعاف؟ 🚀
هذه ليست نصيحة مالية. أجرِ بحثك بنفسك.
قد يكون #AVAX على وشك انعكاس هائل طويل الأمد.
بعد تراجع قاسٍ بنحو 96%، استعاد AVAX منطقة التفعيل الصعودي عند 11.40 دولارًا.
أترقب الآن اختراق خط الاتجاه الهابط على الإطار الزمني الأعلى.
الأهداف: 20 دولارًا | 40 دولارًا | 70 دولارًا | 150 دولارًا
قد يؤدي الاختراق إلى انطلاق موجة صعود كبرى لـ $AVAX .
هل يمكن أن تكون AVAX العملة البديلة التالية التي تحقق ارتفاعًا بمقدار 10 أضعاف؟ 🚀
هذه ليست نصيحة مالية. أجرِ بحثك بنفسك.
119
·
--
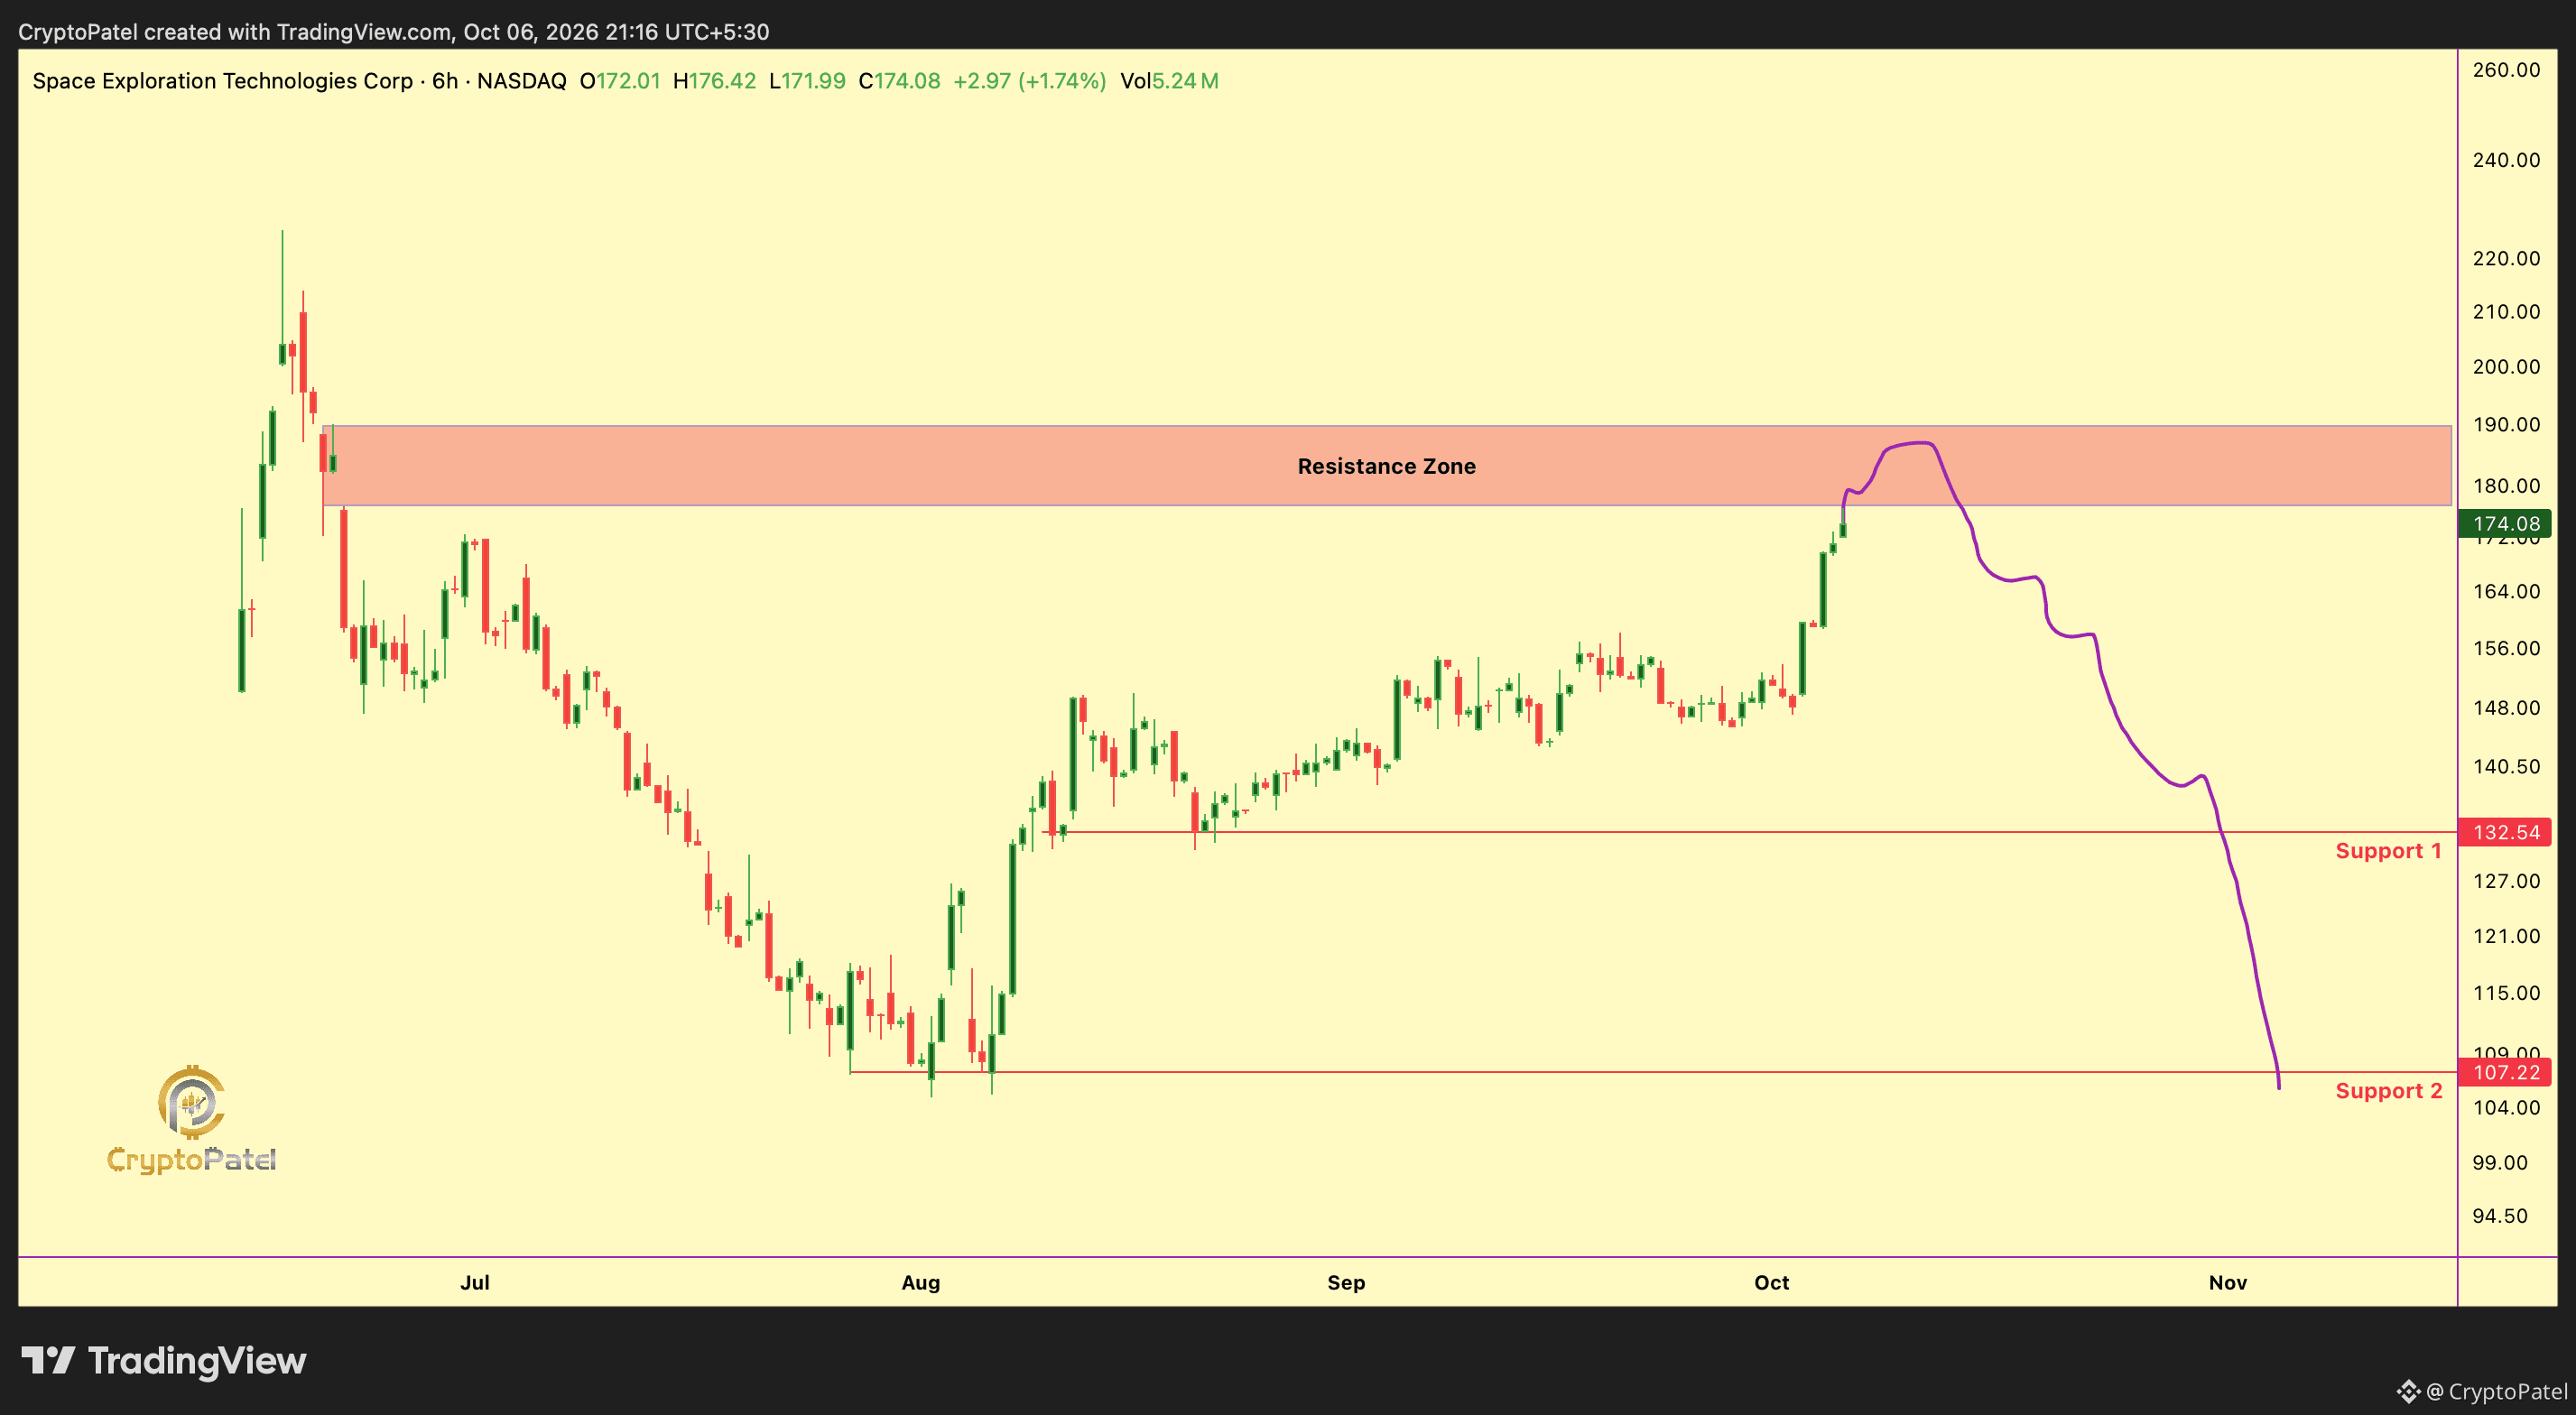
$SPCX قد يهبط دون 100 دولار إذا فشل مستوى 190 دولارًا
إليك السيناريو ببساطة: يقترب $SPCX من منطقة مقاومة رئيسية بين 175 و190 دولارًا.
إذا فشل السعر في اختراق مستوى 190 دولارًا والثبات فوقه، فستزداد مخاطر الانعكاس الحاد بشكل ملحوظ.
الدعم 1: 132 دولارًا
الدعم 2: 107 دولارات
دون 107 دولارات ← يصبح الهبوط إلى ما دون 100 دولار احتمالًا واردًا.
لكن الاختراق الواضح والثبات فوق 190 دولارًا قد يُبطل هذا السيناريو الهبوطي تمامًا.
ليست نصيحة مالية. أجرِ بحثك بنفسك.
{future}(SPCXUSDT)
$SPCX قد يهبط دون 100 دولار إذا فشل مستوى 190 دولارًا
إليك السيناريو ببساطة: يقترب $SPCX من منطقة مقاومة رئيسية بين 175 و190 دولارًا.
إذا فشل السعر في اختراق مستوى 190 دولارًا والثبات فوقه، فستزداد مخاطر الانعكاس الحاد بشكل ملحوظ.
الدعم 1: 132 دولارًا
الدعم 2: 107 دولارات
دون 107 دولارات ← يصبح الهبوط إلى ما دون 100 دولار احتمالًا واردًا.
لكن الاختراق الواضح والثبات فوق 190 دولارًا قد يُبطل هذا السيناريو الهبوطي تمامًا.
ليست نصيحة مالية. أجرِ بحثك بنفسك.
إليك السيناريو ببساطة: يقترب $SPCX من منطقة مقاومة رئيسية بين 175 و190 دولارًا.
إذا فشل السعر في اختراق مستوى 190 دولارًا والثبات فوقه، فستزداد مخاطر الانعكاس الحاد بشكل ملحوظ.
الدعم 1: 132 دولارًا
الدعم 2: 107 دولارات
دون 107 دولارات ← يصبح الهبوط إلى ما دون 100 دولار احتمالًا واردًا.
لكن الاختراق الواضح والثبات فوق 190 دولارًا قد يُبطل هذا السيناريو الهبوطي تمامًا.
ليست نصيحة مالية. أجرِ بحثك بنفسك.
258
·
--
هابط
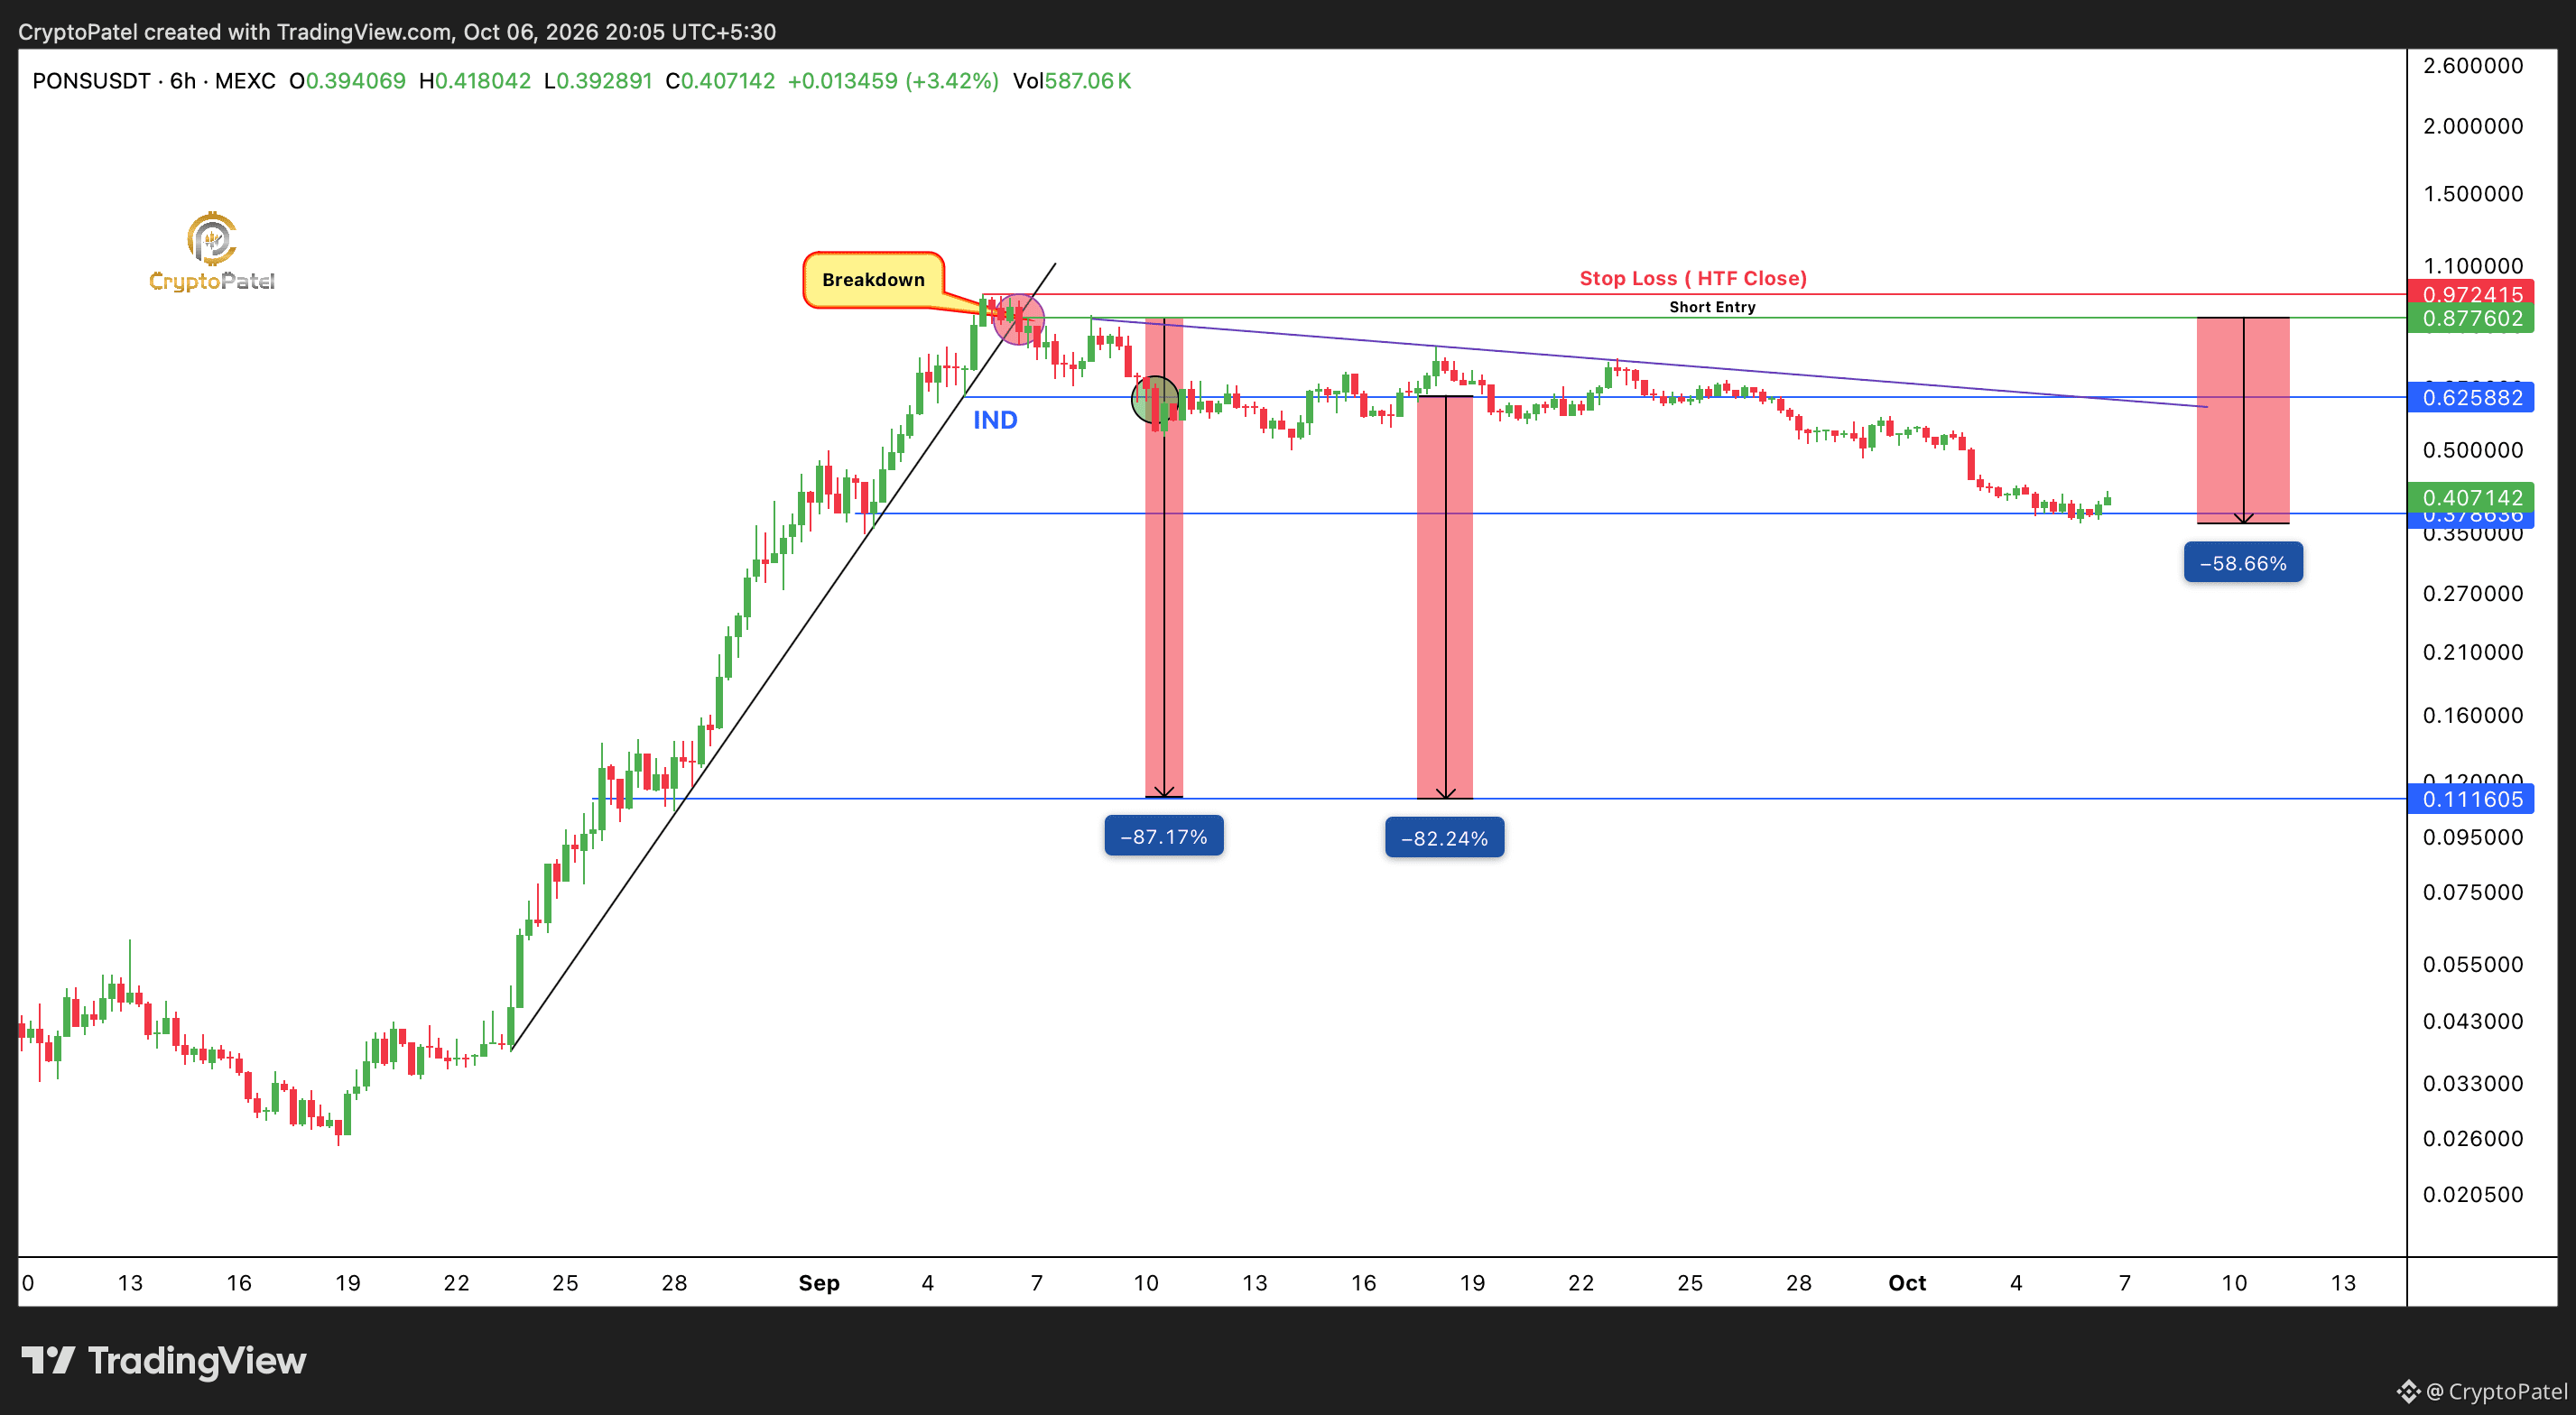
$PONS انهار للتو بنسبة 58%| صفقة البيع على المكشوف تحقق أرباحًا
حذّرتك من ملاحقة السعر $PONS عند القمم التاريخية.
صفقة البيع على المكشوف التي دخلناها عند نحو 0.88 دولار أصبحت الآن رابحة بنحو 58%، مع هبوط السعر إلى نحو 0.036 دولار.
القمة التاريخية في سبتمبر: نحو 0.97 دولار
سعر الدخول في صفقة البيع: نحو 0.88 دولار
السعر الحالي: نحو 0.036 دولار 🤯
أطروحة SMC الهبوطية تتحقق.
الأهداف كما هي، لكن لا تدع الطمع يسيطر عليك.
🔻 جَنِ بعض الأرباح جزئيًا
🔻 أمِّن بعض المكاسب
🔻 دع الجزء المتبقي من الصفقة يستمر
تحرك بنسبة +58% إنجاز هائل بالفعل. إدارة المخاطر > الخوف من تفويت الفرصة.
NFA. DYOR.
{future}(PONSUSDT)
$PONS انهار للتو بنسبة 58%| صفقة البيع على المكشوف تحقق أرباحًا
حذّرتك من ملاحقة السعر $PONS عند القمم التاريخية.
صفقة البيع على المكشوف التي دخلناها عند نحو 0.88 دولار أصبحت الآن رابحة بنحو 58%، مع هبوط السعر إلى نحو 0.036 دولار.
القمة التاريخية في سبتمبر: نحو 0.97 دولار
سعر الدخول في صفقة البيع: نحو 0.88 دولار
السعر الحالي: نحو 0.036 دولار 🤯
أطروحة SMC الهبوطية تتحقق.
الأهداف كما هي، لكن لا تدع الطمع يسيطر عليك.
🔻 جَنِ بعض الأرباح جزئيًا
🔻 أمِّن بعض المكاسب
🔻 دع الجزء المتبقي من الصفقة يستمر
تحرك بنسبة +58% إنجاز هائل بالفعل. إدارة المخاطر > الخوف من تفويت الفرصة.
NFA. DYOR.
حذّرتك من ملاحقة السعر $PONS عند القمم التاريخية.
صفقة البيع على المكشوف التي دخلناها عند نحو 0.88 دولار أصبحت الآن رابحة بنحو 58%، مع هبوط السعر إلى نحو 0.036 دولار.
القمة التاريخية في سبتمبر: نحو 0.97 دولار
سعر الدخول في صفقة البيع: نحو 0.88 دولار
السعر الحالي: نحو 0.036 دولار 🤯
أطروحة SMC الهبوطية تتحقق.
الأهداف كما هي، لكن لا تدع الطمع يسيطر عليك.
🔻 جَنِ بعض الأرباح جزئيًا
🔻 أمِّن بعض المكاسب
🔻 دع الجزء المتبقي من الصفقة يستمر
تحرك بنسبة +58% إنجاز هائل بالفعل. إدارة المخاطر > الخوف من تفويت الفرصة.
NFA. DYOR.
CryptoPatel
·
--
هابط$PONS تحديث | 40% هبوط من دخولنا
#PONS لقد قام الآن بتفريغ حوالي 40% من مستوى دخولنا الهبوطي. آمل أنك استمتعت بالحركة وحققت بعض الأرباح القوية.
والأهم من ذلك، تم الآن كسر منطقة التحفيز/الدعم عند $0.6258، مما يؤكد المزيد من الضغط الهبوطي.
توقعي التالي:
40–80% تراجع إضافي
المنطقة الرئيسية الأولى: $0.3786
الهدف الأعمق: $0.10
ما زلت أتوقع أن #PONS يمكن أن يعاود التراجع في النهاية نحو منطقة $0.10 إذا استمر الزخم الهبوطي.
طالما أن السعر يبقى تحت منطقة الإبطال الرئيسية، سأظل هبوطيًا.
#PONS لقد قام الآن بتفريغ حوالي 40% من مستوى دخولنا الهبوطي. آمل أنك استمتعت بالحركة وحققت بعض الأرباح القوية.
والأهم من ذلك، تم الآن كسر منطقة التحفيز/الدعم عند $0.6258، مما يؤكد المزيد من الضغط الهبوطي.
توقعي التالي:
40–80% تراجع إضافي
المنطقة الرئيسية الأولى: $0.3786
الهدف الأعمق: $0.10
ما زلت أتوقع أن #PONS يمكن أن يعاود التراجع في النهاية نحو منطقة $0.10 إذا استمر الزخم الهبوطي.
طالما أن السعر يبقى تحت منطقة الإبطال الرئيسية، سأظل هبوطيًا.
855
·
--
صاعد
$ORCA توقعات السعر: هل توجد إمكانية للارتفاع 30 ضعفًا؟ | اختراق مستوى 3 دولارات قد يغيّر كل شيء
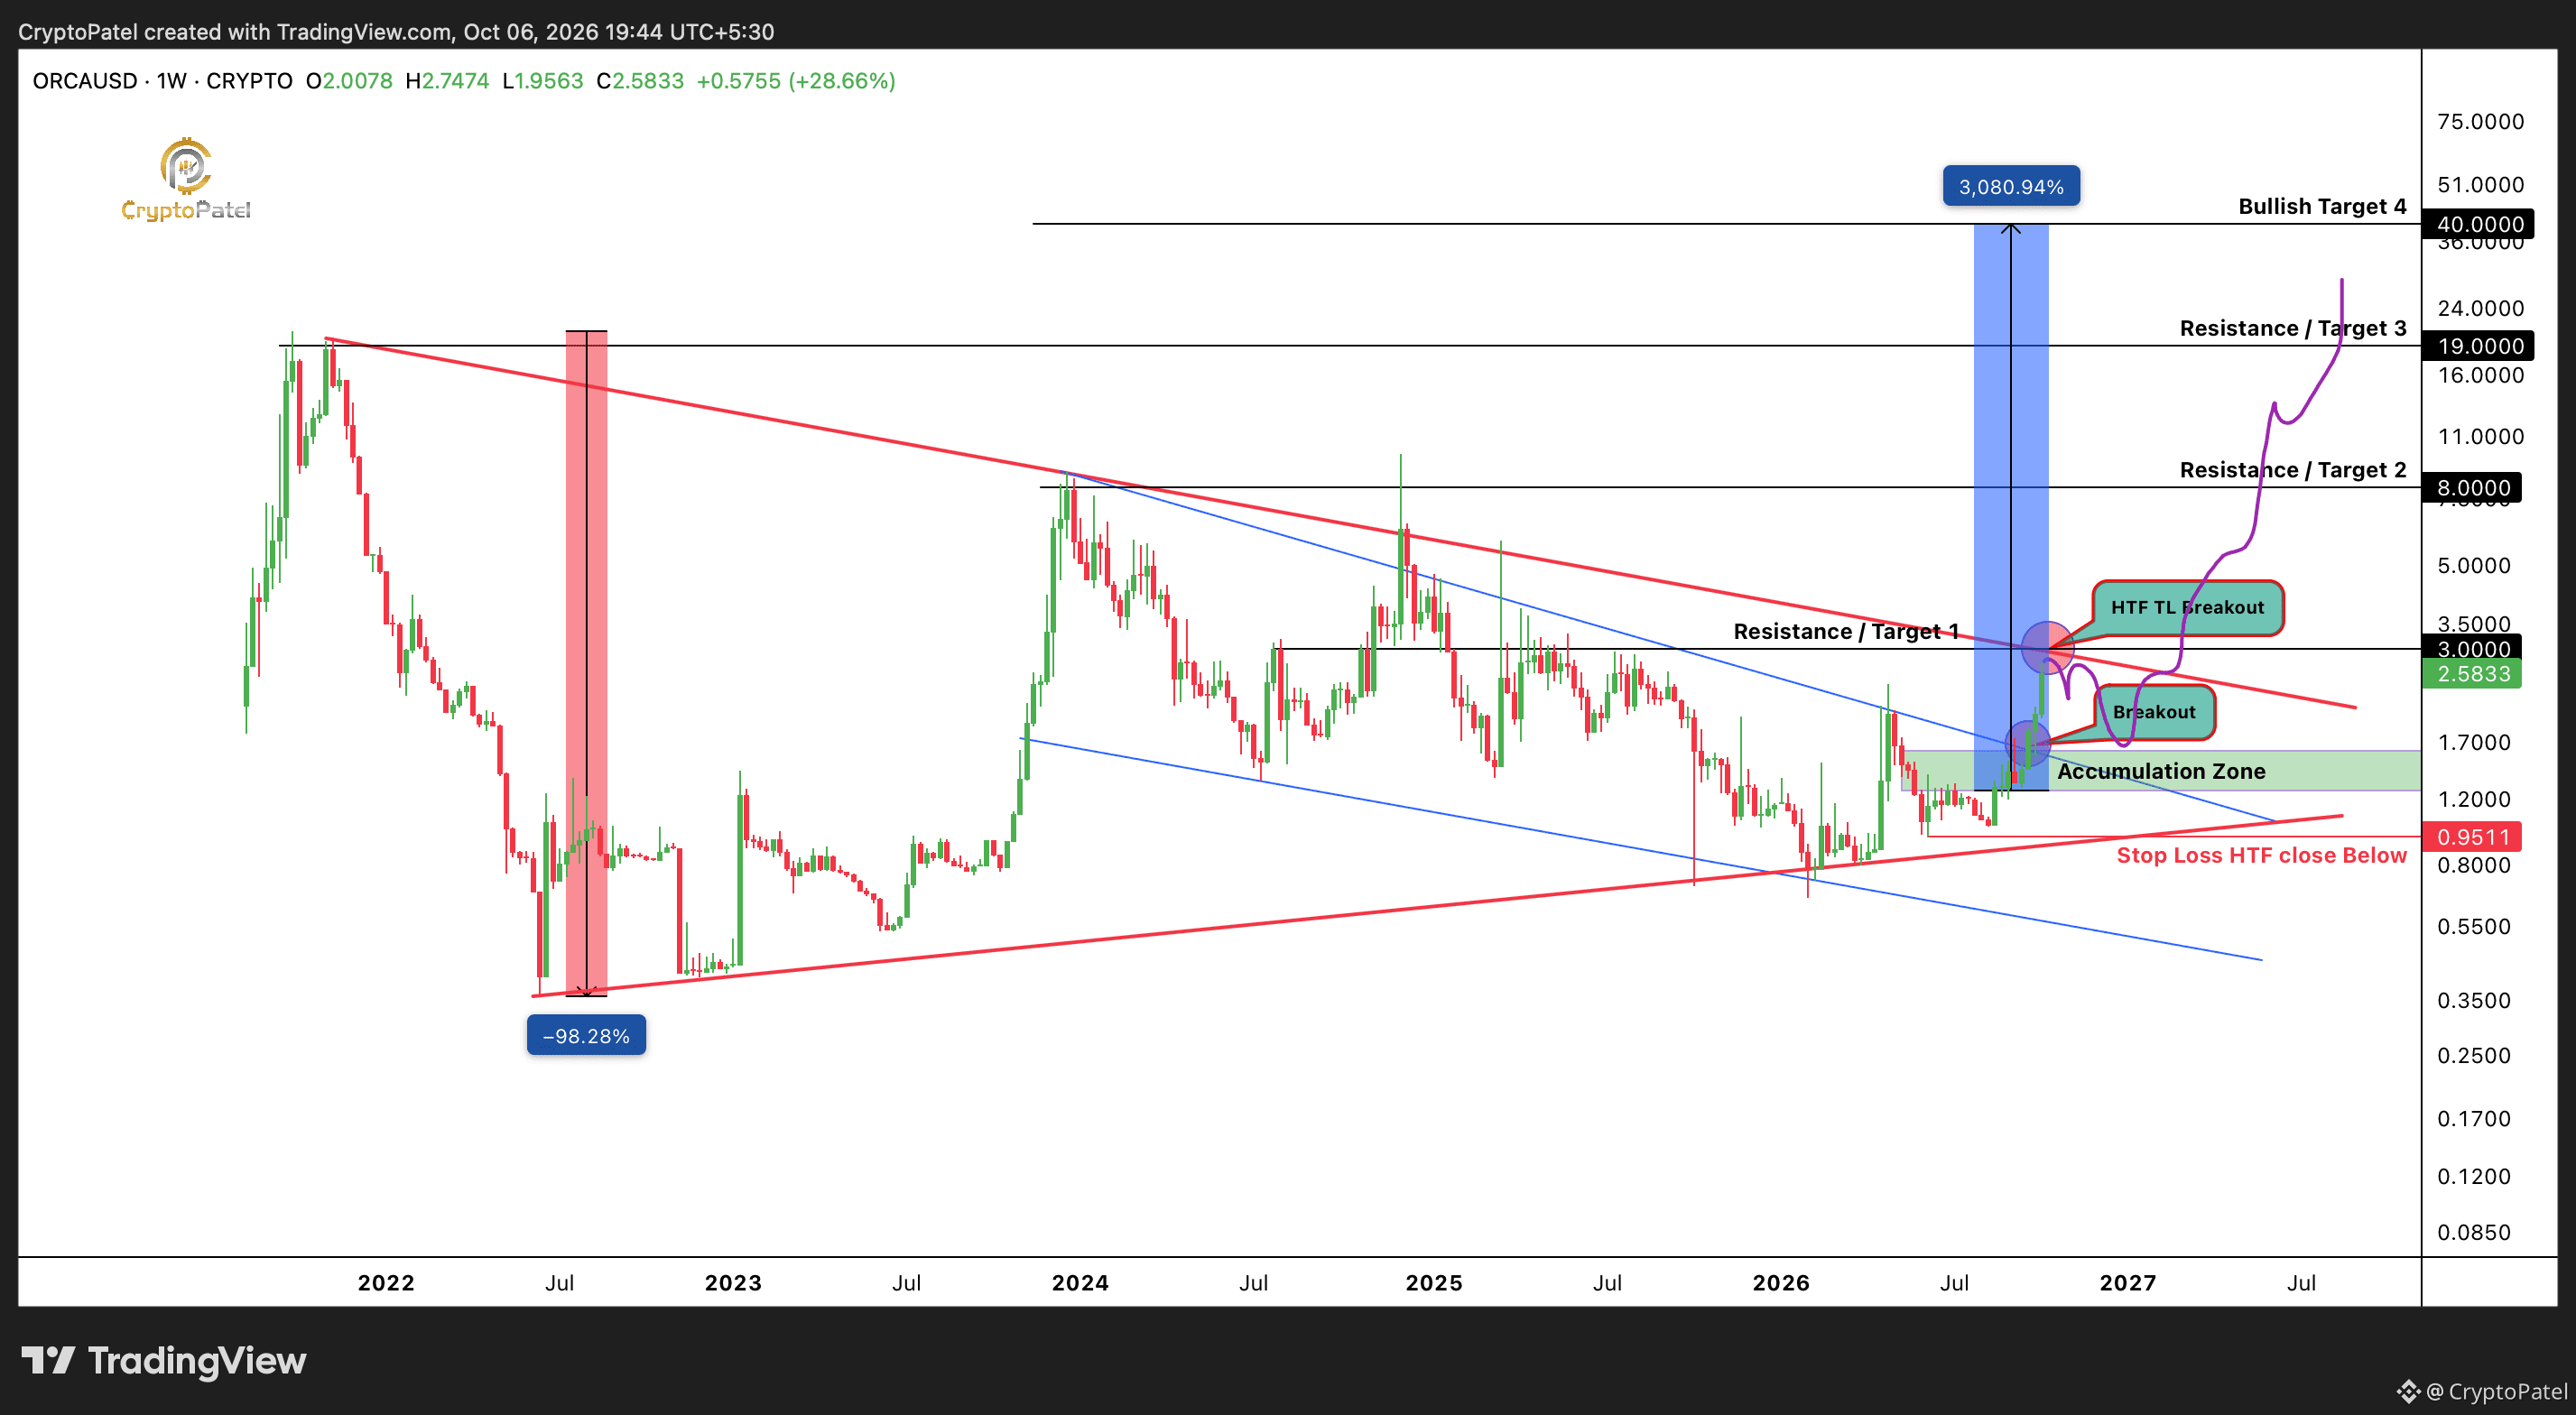
#ORCA ارتفع بالفعل بنحو 320% من أدنى مستوى له في فبراير 2026، عند 0.6534 دولار، إلى أعلى مستوى سجله اليوم، عند 2.7474 دولار. لكن رغم هذا التعافي الكبير، قد يظل الهيكل على الإطار الزمني الأعلى (HTF) مهيأً لمزيد من التوسع.
اخترق خط الاتجاه الهابط على الإطار الزمني الأدنى (LTF) بالفعل قرب 1.65 دولار، ويحافظ السعر على مستواه فوق منطقة الاختراق.
والآن يأتي الاختبار الأكبر: مقاومة HTF الممتدة لعدة سنوات قرب 3 دولارات.
قد يؤدي اختراق أسبوعي مؤكد والثبات فوق 3 دولارات إلى انعكاس كبير في الاتجاه ويفتح الطريق نحو:
الأهداف: 3 دولارات → 8 دولارات → 19 دولارًا → 40 دولارًا
إذا تراجع ORCA، فسأراقب منطقة التجميع بين 1.60 و1.22 دولار. فالانتقال من 1.22 إلى 40 دولارًا سيمثل إمكانية صعود بنحو 30 ضعفًا.
مستوى إبطال HTF: إغلاق أسبوعي دون 0.95 دولار.
العوامل الأساسية:
جمعت ORCA نحو 18 مليون دولار، وكان سعر جولة التأسيس قرابة 1.87 دولار، مقارنةً بسعر طرح IEO البالغ 14.60 دولارًا. وعند نحو 2.58 دولار، لا يزال سعر ORCA أقل بنحو 82% من سعر طرحها عبر IEO.
من أبرز الداعمين: Polychain Capital وPlaceholder وThree Arrows Capital وCoinbase Ventures وJump Capital وSolana Ventures وDeFiance Capital وRyze Labs وZee Prime Capital.
إن اجتماع التجميع الممتد لعدة سنوات، واختراق خط الاتجاه، والخصم التاريخي في التقييم، والدعم القوي من جهات راسخة في عالم العملات المشفرة، يجعل ORCA/USDT رسمًا بيانيًا يستحق المتابعة عن كثب.
اختراق مستوى 3 دولارات والثبات فوقه → قد يبدأ التوسع على الإطار الزمني الكلي.
هذه ليست نصيحة مالية. أجرِ بحثك الخاص. أدر المخاطر.
@Orca_so
{future}(ORCAUSDT)
$ORCA توقعات السعر: هل توجد إمكانية للارتفاع 30 ضعفًا؟ | اختراق مستوى 3 دولارات قد يغيّر كل شيء
#ORCA ارتفع بالفعل بنحو 320% من أدنى مستوى له في فبراير 2026، عند 0.6534 دولار، إلى أعلى مستوى سجله اليوم، عند 2.7474 دولار. لكن رغم هذا التعافي الكبير، قد يظل الهيكل على الإطار الزمني الأعلى (HTF) مهيأً لمزيد من التوسع.
اخترق خط الاتجاه الهابط على الإطار الزمني الأدنى (LTF) بالفعل قرب 1.65 دولار، ويحافظ السعر على مستواه فوق منطقة الاختراق.
والآن يأتي الاختبار الأكبر: مقاومة HTF الممتدة لعدة سنوات قرب 3 دولارات.
قد يؤدي اختراق أسبوعي مؤكد والثبات فوق 3 دولارات إلى انعكاس كبير في الاتجاه ويفتح الطريق نحو:
الأهداف: 3 دولارات → 8 دولارات → 19 دولارًا → 40 دولارًا
إذا تراجع ORCA، فسأراقب منطقة التجميع بين 1.60 و1.22 دولار. فالانتقال من 1.22 إلى 40 دولارًا سيمثل إمكانية صعود بنحو 30 ضعفًا.
مستوى إبطال HTF: إغلاق أسبوعي دون 0.95 دولار.
العوامل الأساسية:
جمعت ORCA نحو 18 مليون دولار، وكان سعر جولة التأسيس قرابة 1.87 دولار، مقارنةً بسعر طرح IEO البالغ 14.60 دولارًا. وعند نحو 2.58 دولار، لا يزال سعر ORCA أقل بنحو 82% من سعر طرحها عبر IEO.
من أبرز الداعمين: Polychain Capital وPlaceholder وThree Arrows Capital وCoinbase Ventures وJump Capital وSolana Ventures وDeFiance Capital وRyze Labs وZee Prime Capital.
إن اجتماع التجميع الممتد لعدة سنوات، واختراق خط الاتجاه، والخصم التاريخي في التقييم، والدعم القوي من جهات راسخة في عالم العملات المشفرة، يجعل ORCA/USDT رسمًا بيانيًا يستحق المتابعة عن كثب.
اختراق مستوى 3 دولارات والثبات فوقه → قد يبدأ التوسع على الإطار الزمني الكلي.
هذه ليست نصيحة مالية. أجرِ بحثك الخاص. أدر المخاطر.
@Orca_so
#ORCA ارتفع بالفعل بنحو 320% من أدنى مستوى له في فبراير 2026، عند 0.6534 دولار، إلى أعلى مستوى سجله اليوم، عند 2.7474 دولار. لكن رغم هذا التعافي الكبير، قد يظل الهيكل على الإطار الزمني الأعلى (HTF) مهيأً لمزيد من التوسع.
اخترق خط الاتجاه الهابط على الإطار الزمني الأدنى (LTF) بالفعل قرب 1.65 دولار، ويحافظ السعر على مستواه فوق منطقة الاختراق.
والآن يأتي الاختبار الأكبر: مقاومة HTF الممتدة لعدة سنوات قرب 3 دولارات.
قد يؤدي اختراق أسبوعي مؤكد والثبات فوق 3 دولارات إلى انعكاس كبير في الاتجاه ويفتح الطريق نحو:
الأهداف: 3 دولارات → 8 دولارات → 19 دولارًا → 40 دولارًا
إذا تراجع ORCA، فسأراقب منطقة التجميع بين 1.60 و1.22 دولار. فالانتقال من 1.22 إلى 40 دولارًا سيمثل إمكانية صعود بنحو 30 ضعفًا.
مستوى إبطال HTF: إغلاق أسبوعي دون 0.95 دولار.
العوامل الأساسية:
جمعت ORCA نحو 18 مليون دولار، وكان سعر جولة التأسيس قرابة 1.87 دولار، مقارنةً بسعر طرح IEO البالغ 14.60 دولارًا. وعند نحو 2.58 دولار، لا يزال سعر ORCA أقل بنحو 82% من سعر طرحها عبر IEO.
من أبرز الداعمين: Polychain Capital وPlaceholder وThree Arrows Capital وCoinbase Ventures وJump Capital وSolana Ventures وDeFiance Capital وRyze Labs وZee Prime Capital.
إن اجتماع التجميع الممتد لعدة سنوات، واختراق خط الاتجاه، والخصم التاريخي في التقييم، والدعم القوي من جهات راسخة في عالم العملات المشفرة، يجعل ORCA/USDT رسمًا بيانيًا يستحق المتابعة عن كثب.
اختراق مستوى 3 دولارات والثبات فوقه → قد يبدأ التوسع على الإطار الزمني الكلي.
هذه ليست نصيحة مالية. أجرِ بحثك الخاص. أدر المخاطر.
@Orca_so
197
·
--
صاعد
$TRUMP هل تحوّل للتو إلى الاتجاه الصعودي؟ منخفض بنسبة 97% عن أعلى مستوى تاريخي | هل هذه فرصة لتحقيق عائد من 5 إلى 20 ضعفًا؟
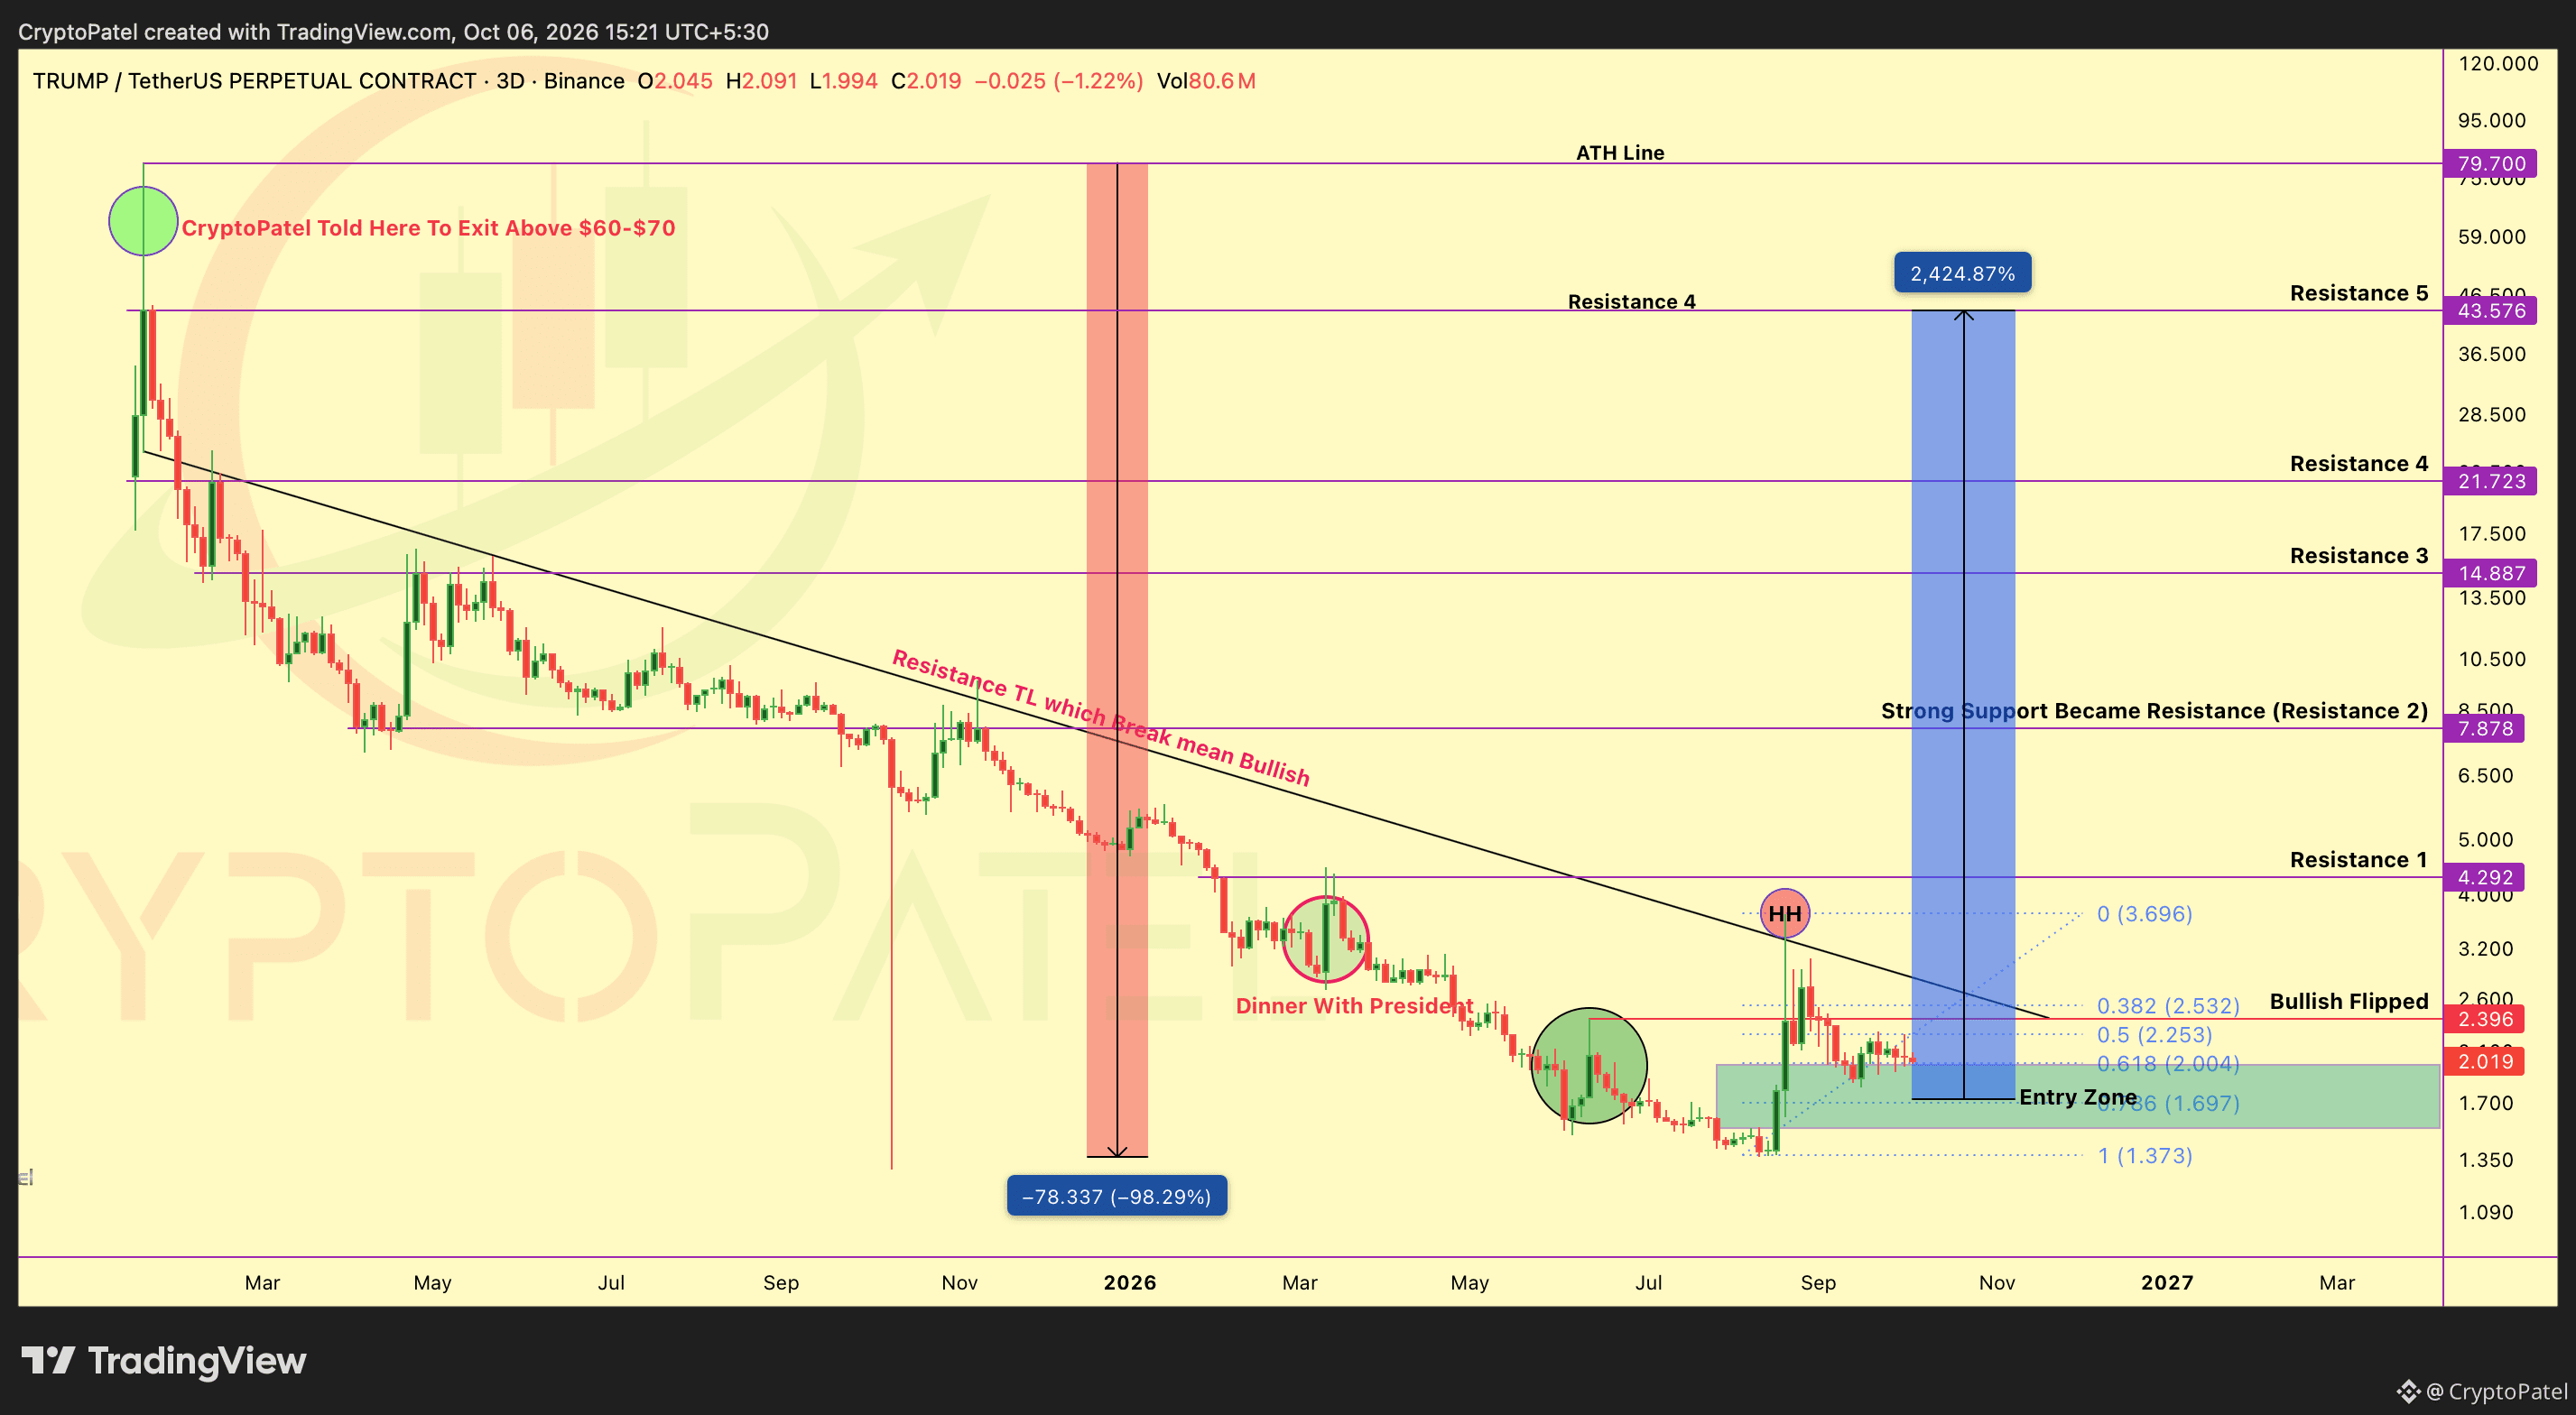
#TRUMP لا يزال منخفضًا بنحو 97% عن أعلى مستوى تاريخي له عند $79.70.
حذّرتُ عند مستوى $60-$70 من ضرورة الخروج، وكررتُ التنبيه إلى خطر انهياره إلى ما دون $10. وفي النهاية، وصل السعر إلى $1.36.
والآن، بدأ الهيكل يتغير أخيرًا.
للمرة الأولى منذ أعلى مستوى تاريخي في يناير 2025، أصبحتُ متفائلًا بشأن $TRUMP.
لماذا؟
➤ منطقة التجميع لدي: $1.50-$2
➤ $1.70 — مستوى فيبوناتشي 0.786 | $2 — مستوى فيبوناتشي 0.618
➤ تغيير في السلوك / استعادة الاتجاه الصعودي: $2.396
➤ نقطة اختراق خط الاتجاه الرئيسي: $3
➤ الأهداف على الإطار الزمني الأعلى: $15 → $30 → $50 → $70
ارتفع TRUMP/USDT بنحو 170% من $1.36 إلى $3.68، قبل أن يتراجع بنحو 45%.
ولا يعني هذا التصحيح بالضرورة أن الاتجاه هبوطي.
الأهم الآن هو ما إذا كان السعر قادرًا على تكوين قاع أعلى من $1.36.
وأهم تغيير هيكلي هو استعادة مستوى $2.396.
يمثل هذا المستوى تغييرًا في السلوك على مخططي، وهو أول إشارة رئيسية إلى احتمال تحوّل هيكل السوق الهابط طويل الأمد.
أراقب الآن ما يلي:
→ الثبات فوق $2
→ تكوين قاع أعلى
→ اختراق $3.69 واستعادة المستوى لتأكيد أقوى
→ اختراق خط الاتجاه الهابط والثبات فوقه
منطقة التجميع لدي: $2.00-$1.50
مستوى إبطال الفرضية: أي إغلاق على إطار زمني أعلى دون $1.36.
إذا صمد مستوى $1.36 ووصلت دورة التوسع التالية لعملات الميم، فقد تتمتع TRUMP/USDT بإمكانات كبيرة لتحقيق عوائد غير متماثلة من 5 إلى 20 ضعفًا انطلاقًا من الهيكل الحالي.
لكن تذكر: $TRUMP عملة ميم.
تحقيق عائد من 5 إلى 20 ضعفًا سيناريو عالي المخاطر، وليس توقعًا مضمونًا.
بالنسبة لي، تحوّلت الفرصة الآن من «بيع الارتفاعات» إلى «تجميع الأصول وفقًا للهيكل»، ما دام القاع الكلي عند $1.36 صامدًا.
ليست نصيحة مالية. أجرِ أبحاثك بنفسك.
{future}(TRUMPUSDT)
$TRUMP هل تحوّل للتو إلى الاتجاه الصعودي؟ منخفض بنسبة 97% عن أعلى مستوى تاريخي | هل هذه فرصة لتحقيق عائد من 5 إلى 20 ضعفًا؟
#TRUMP لا يزال منخفضًا بنحو 97% عن أعلى مستوى تاريخي له عند $79.70.
حذّرتُ عند مستوى $60-$70 من ضرورة الخروج، وكررتُ التنبيه إلى خطر انهياره إلى ما دون $10. وفي النهاية، وصل السعر إلى $1.36.
والآن، بدأ الهيكل يتغير أخيرًا.
للمرة الأولى منذ أعلى مستوى تاريخي في يناير 2025، أصبحتُ متفائلًا بشأن $TRUMP .
لماذا؟
➤ منطقة التجميع لدي: $1.50-$2
➤ $1.70 — مستوى فيبوناتشي 0.786 | $2 — مستوى فيبوناتشي 0.618
➤ تغيير في السلوك / استعادة الاتجاه الصعودي: $2.396
➤ نقطة اختراق خط الاتجاه الرئيسي: $3
➤ الأهداف على الإطار الزمني الأعلى: $15 → $30 → $50 → $70
ارتفع TRUMP/USDT بنحو 170% من $1.36 إلى $3.68، قبل أن يتراجع بنحو 45%.
ولا يعني هذا التصحيح بالضرورة أن الاتجاه هبوطي.
الأهم الآن هو ما إذا كان السعر قادرًا على تكوين قاع أعلى من $1.36.
وأهم تغيير هيكلي هو استعادة مستوى $2.396.
يمثل هذا المستوى تغييرًا في السلوك على مخططي، وهو أول إشارة رئيسية إلى احتمال تحوّل هيكل السوق الهابط طويل الأمد.
أراقب الآن ما يلي:
→ الثبات فوق $2
→ تكوين قاع أعلى
→ اختراق $3.69 واستعادة المستوى لتأكيد أقوى
→ اختراق خط الاتجاه الهابط والثبات فوقه
منطقة التجميع لدي: $2.00-$1.50
مستوى إبطال الفرضية: أي إغلاق على إطار زمني أعلى دون $1.36.
إذا صمد مستوى $1.36 ووصلت دورة التوسع التالية لعملات الميم، فقد تتمتع TRUMP/USDT بإمكانات كبيرة لتحقيق عوائد غير متماثلة من 5 إلى 20 ضعفًا انطلاقًا من الهيكل الحالي.
لكن تذكر: $TRUMP عملة ميم.
تحقيق عائد من 5 إلى 20 ضعفًا سيناريو عالي المخاطر، وليس توقعًا مضمونًا.
بالنسبة لي، تحوّلت الفرصة الآن من «بيع الارتفاعات» إلى «تجميع الأصول وفقًا للهيكل»، ما دام القاع الكلي عند $1.36 صامدًا.
ليست نصيحة مالية. أجرِ أبحاثك بنفسك.
#TRUMP لا يزال منخفضًا بنحو 97% عن أعلى مستوى تاريخي له عند $79.70.
حذّرتُ عند مستوى $60-$70 من ضرورة الخروج، وكررتُ التنبيه إلى خطر انهياره إلى ما دون $10. وفي النهاية، وصل السعر إلى $1.36.
والآن، بدأ الهيكل يتغير أخيرًا.
للمرة الأولى منذ أعلى مستوى تاريخي في يناير 2025، أصبحتُ متفائلًا بشأن $TRUMP .
لماذا؟
➤ منطقة التجميع لدي: $1.50-$2
➤ $1.70 — مستوى فيبوناتشي 0.786 | $2 — مستوى فيبوناتشي 0.618
➤ تغيير في السلوك / استعادة الاتجاه الصعودي: $2.396
➤ نقطة اختراق خط الاتجاه الرئيسي: $3
➤ الأهداف على الإطار الزمني الأعلى: $15 → $30 → $50 → $70
ارتفع TRUMP/USDT بنحو 170% من $1.36 إلى $3.68، قبل أن يتراجع بنحو 45%.
ولا يعني هذا التصحيح بالضرورة أن الاتجاه هبوطي.
الأهم الآن هو ما إذا كان السعر قادرًا على تكوين قاع أعلى من $1.36.
وأهم تغيير هيكلي هو استعادة مستوى $2.396.
يمثل هذا المستوى تغييرًا في السلوك على مخططي، وهو أول إشارة رئيسية إلى احتمال تحوّل هيكل السوق الهابط طويل الأمد.
أراقب الآن ما يلي:
→ الثبات فوق $2
→ تكوين قاع أعلى
→ اختراق $3.69 واستعادة المستوى لتأكيد أقوى
→ اختراق خط الاتجاه الهابط والثبات فوقه
منطقة التجميع لدي: $2.00-$1.50
مستوى إبطال الفرضية: أي إغلاق على إطار زمني أعلى دون $1.36.
إذا صمد مستوى $1.36 ووصلت دورة التوسع التالية لعملات الميم، فقد تتمتع TRUMP/USDT بإمكانات كبيرة لتحقيق عوائد غير متماثلة من 5 إلى 20 ضعفًا انطلاقًا من الهيكل الحالي.
لكن تذكر: $TRUMP عملة ميم.
تحقيق عائد من 5 إلى 20 ضعفًا سيناريو عالي المخاطر، وليس توقعًا مضمونًا.
بالنسبة لي، تحوّلت الفرصة الآن من «بيع الارتفاعات» إلى «تجميع الأصول وفقًا للهيكل»، ما دام القاع الكلي عند $1.36 صامدًا.
ليست نصيحة مالية. أجرِ أبحاثك بنفسك.
127
·
--
هابط
$USELESS هبوط بنسبة 40% من منطقة المقاومة الدقيقة التي حذّرتك منها
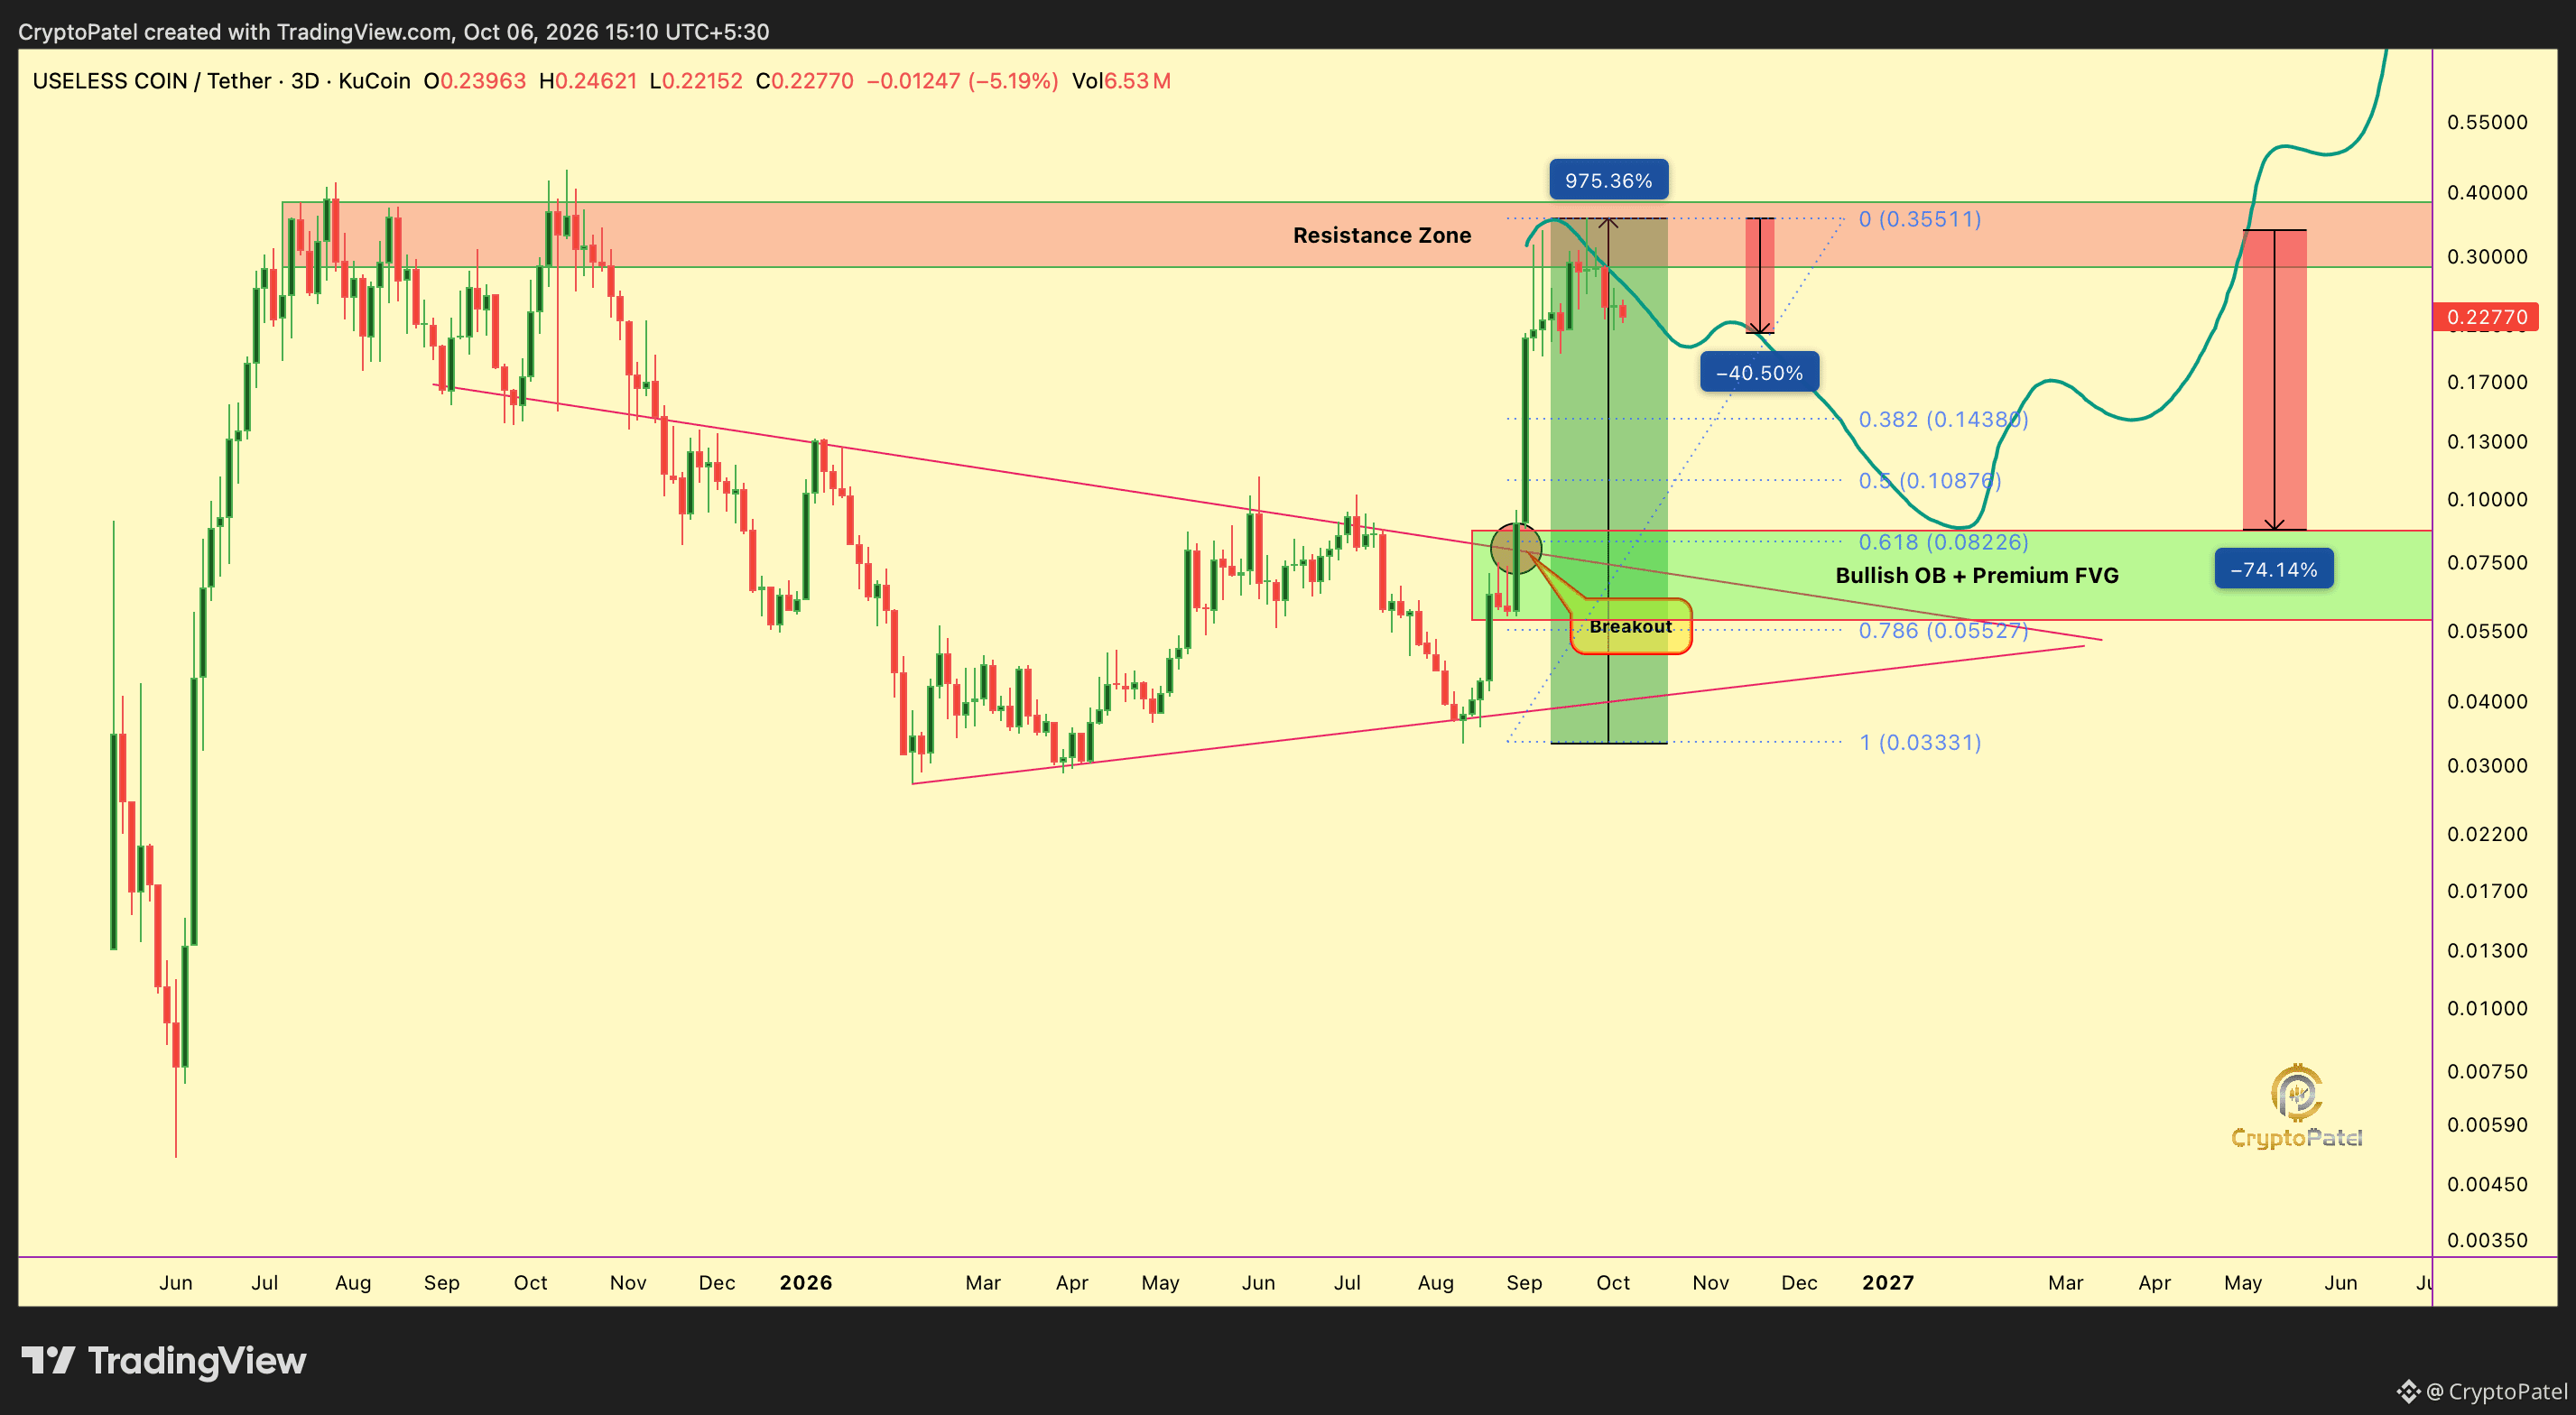
حذّرتك من مطاردة #USELESS قرب قمته التاريخية السابقة + كتلة الأوامر الهبوطية على الإطار الزمني الأعلى، بعد ارتفاع هائل بنحو 975%.
رفض السعر هذه المنطقة، وهو الآن أقل بنحو 40%.
ما يزال السيناريو الهبوطي قائماً ما دام السعر دون هذه المقاومة.
لماذا ما زلت حذراً:
➜ ارتفاع بنحو 975% في شهر واحد فقط
➜ لم يحدث أي تصحيح كبير تقريباً
➜ لم يُعِد السعر اختبار منطقة الاختراق كما ينبغي
➜ رفض عند القمة التاريخية السابقة + كتلة أوامر هبوطية
➜ مخاطر مرتفعة لحدوث تصحيح عميق على الإطار الزمني الأعلى
من القمة الأخيرة، ما زلت أترقب احتمال هبوط يصل إلى نحو 70%.
ومن المستويات الحالية، يظل هبوط بنحو 60% ممكناً إذا استمر فشل البنية.
منطقة التجميع الرئيسية لدي: $0.086–$0.058
إذا اخترق زوج USELESS/USDT كتلة الأوامر الهبوطية وثبت فوقها، فسيُلغى هذا السيناريو.
لهذا السبب لا تطارد الارتفاعات عند المقاومة.
قد تدفع الضجة السعر إلى الصعود.
إدارة المخاطر تحمي رأس المال.
ما رأيك | هل يتجه $USELESS نحو منطقة التجميع؟
{future}(USELESSUSDT)
$USELESS هبوط بنسبة 40% من منطقة المقاومة الدقيقة التي حذّرتك منها
حذّرتك من مطاردة #USELESS قرب قمته التاريخية السابقة + كتلة الأوامر الهبوطية على الإطار الزمني الأعلى، بعد ارتفاع هائل بنحو 975%.
رفض السعر هذه المنطقة، وهو الآن أقل بنحو 40%.
ما يزال السيناريو الهبوطي قائماً ما دام السعر دون هذه المقاومة.
لماذا ما زلت حذراً:
➜ ارتفاع بنحو 975% في شهر واحد فقط
➜ لم يحدث أي تصحيح كبير تقريباً
➜ لم يُعِد السعر اختبار منطقة الاختراق كما ينبغي
➜ رفض عند القمة التاريخية السابقة + كتلة أوامر هبوطية
➜ مخاطر مرتفعة لحدوث تصحيح عميق على الإطار الزمني الأعلى
من القمة الأخيرة، ما زلت أترقب احتمال هبوط يصل إلى نحو 70%.
ومن المستويات الحالية، يظل هبوط بنحو 60% ممكناً إذا استمر فشل البنية.
منطقة التجميع الرئيسية لدي: $0.086–$0.058
إذا اخترق زوج USELESS/USDT كتلة الأوامر الهبوطية وثبت فوقها، فسيُلغى هذا السيناريو.
لهذا السبب لا تطارد الارتفاعات عند المقاومة.
قد تدفع الضجة السعر إلى الصعود.
إدارة المخاطر تحمي رأس المال.
ما رأيك | هل يتجه $USELESS نحو منطقة التجميع؟
حذّرتك من مطاردة #USELESS قرب قمته التاريخية السابقة + كتلة الأوامر الهبوطية على الإطار الزمني الأعلى، بعد ارتفاع هائل بنحو 975%.
رفض السعر هذه المنطقة، وهو الآن أقل بنحو 40%.
ما يزال السيناريو الهبوطي قائماً ما دام السعر دون هذه المقاومة.
لماذا ما زلت حذراً:
➜ ارتفاع بنحو 975% في شهر واحد فقط
➜ لم يحدث أي تصحيح كبير تقريباً
➜ لم يُعِد السعر اختبار منطقة الاختراق كما ينبغي
➜ رفض عند القمة التاريخية السابقة + كتلة أوامر هبوطية
➜ مخاطر مرتفعة لحدوث تصحيح عميق على الإطار الزمني الأعلى
من القمة الأخيرة، ما زلت أترقب احتمال هبوط يصل إلى نحو 70%.
ومن المستويات الحالية، يظل هبوط بنحو 60% ممكناً إذا استمر فشل البنية.
منطقة التجميع الرئيسية لدي: $0.086–$0.058
إذا اخترق زوج USELESS/USDT كتلة الأوامر الهبوطية وثبت فوقها، فسيُلغى هذا السيناريو.
لهذا السبب لا تطارد الارتفاعات عند المقاومة.
قد تدفع الضجة السعر إلى الصعود.
إدارة المخاطر تحمي رأس المال.
ما رأيك | هل يتجه $USELESS نحو منطقة التجميع؟
CryptoPatel
·
--
صاعد$USELESS ارتفع 768%… هل ستكون هناك هبطة بنسبة 70% قريبًا؟
#USELESS بالتأكيد لا يبدو “عديم الفائدة” على الرسم البياني. 😄
الرمز ارتفع بالفعل بنحو ~768% خلال 23 يومًا فقط، لكن الموقع الحالي هو المكان الذي سأصبح فيه حذرًا بدلًا من الاندفاع.
المقاومة الرئيسية: $0.28–$0.38:
السعر يقترب من منطقة مقاومة تاريخية رئيسية. قد تؤدي هذه المنطقة إلى جني أرباح قوي ورفض للسعر.
إذا تم رفض USELESS/USDT هنا، فالتراجع بنسبة 40–70% ممكن تقنيًا. هذا سيناريو، وليس توقعًا مضمونًا.
منطقة التجميع الرئيسية: $0.056–$0.086:
يُظهر الرسم كتلة أوامر صعودية + فجوة قيمة عادلة Premium FVG حول هذه المنطقة.
إذا تراجع السعر إلى هذه المنطقة وأظهر استجابة صعودية صحيحة، فسأعتبرها منطقة أكثر إثارة للاهتمام للمتابعة من مطاردة الحركة الحالية.
رأيي: لا أنصح بشراء USELESS/USDT بعد حركة صعودية بنسبة 768% مباشرة إلى مقاومة رئيسية.
النهج الأفضل هو الانتظار لأحد الخيارين:
→ اختراق ناجح + إعادة اختبار ناجحة فوق المقاومة
أو
→ تراجع عميق إلى منطقة الطلب $0.056–$0.086 + تأكيد
لا تطارد القمم التاريخية. ابحث عن نقاط دخول ذات مخاطرة/عائد مناسبة في مناطق التجميع.
دائمًا قم ببحثك الخاص. التحليل الفني يقدم سيناريوهات، وليس ضمانات.
#USELESS بالتأكيد لا يبدو “عديم الفائدة” على الرسم البياني. 😄
الرمز ارتفع بالفعل بنحو ~768% خلال 23 يومًا فقط، لكن الموقع الحالي هو المكان الذي سأصبح فيه حذرًا بدلًا من الاندفاع.
المقاومة الرئيسية: $0.28–$0.38:
السعر يقترب من منطقة مقاومة تاريخية رئيسية. قد تؤدي هذه المنطقة إلى جني أرباح قوي ورفض للسعر.
إذا تم رفض USELESS/USDT هنا، فالتراجع بنسبة 40–70% ممكن تقنيًا. هذا سيناريو، وليس توقعًا مضمونًا.
منطقة التجميع الرئيسية: $0.056–$0.086:
يُظهر الرسم كتلة أوامر صعودية + فجوة قيمة عادلة Premium FVG حول هذه المنطقة.
إذا تراجع السعر إلى هذه المنطقة وأظهر استجابة صعودية صحيحة، فسأعتبرها منطقة أكثر إثارة للاهتمام للمتابعة من مطاردة الحركة الحالية.
رأيي: لا أنصح بشراء USELESS/USDT بعد حركة صعودية بنسبة 768% مباشرة إلى مقاومة رئيسية.
النهج الأفضل هو الانتظار لأحد الخيارين:
→ اختراق ناجح + إعادة اختبار ناجحة فوق المقاومة
أو
→ تراجع عميق إلى منطقة الطلب $0.056–$0.086 + تأكيد
لا تطارد القمم التاريخية. ابحث عن نقاط دخول ذات مخاطرة/عائد مناسبة في مناطق التجميع.
دائمًا قم ببحثك الخاص. التحليل الفني يقدم سيناريوهات، وليس ضمانات.
440
·
--
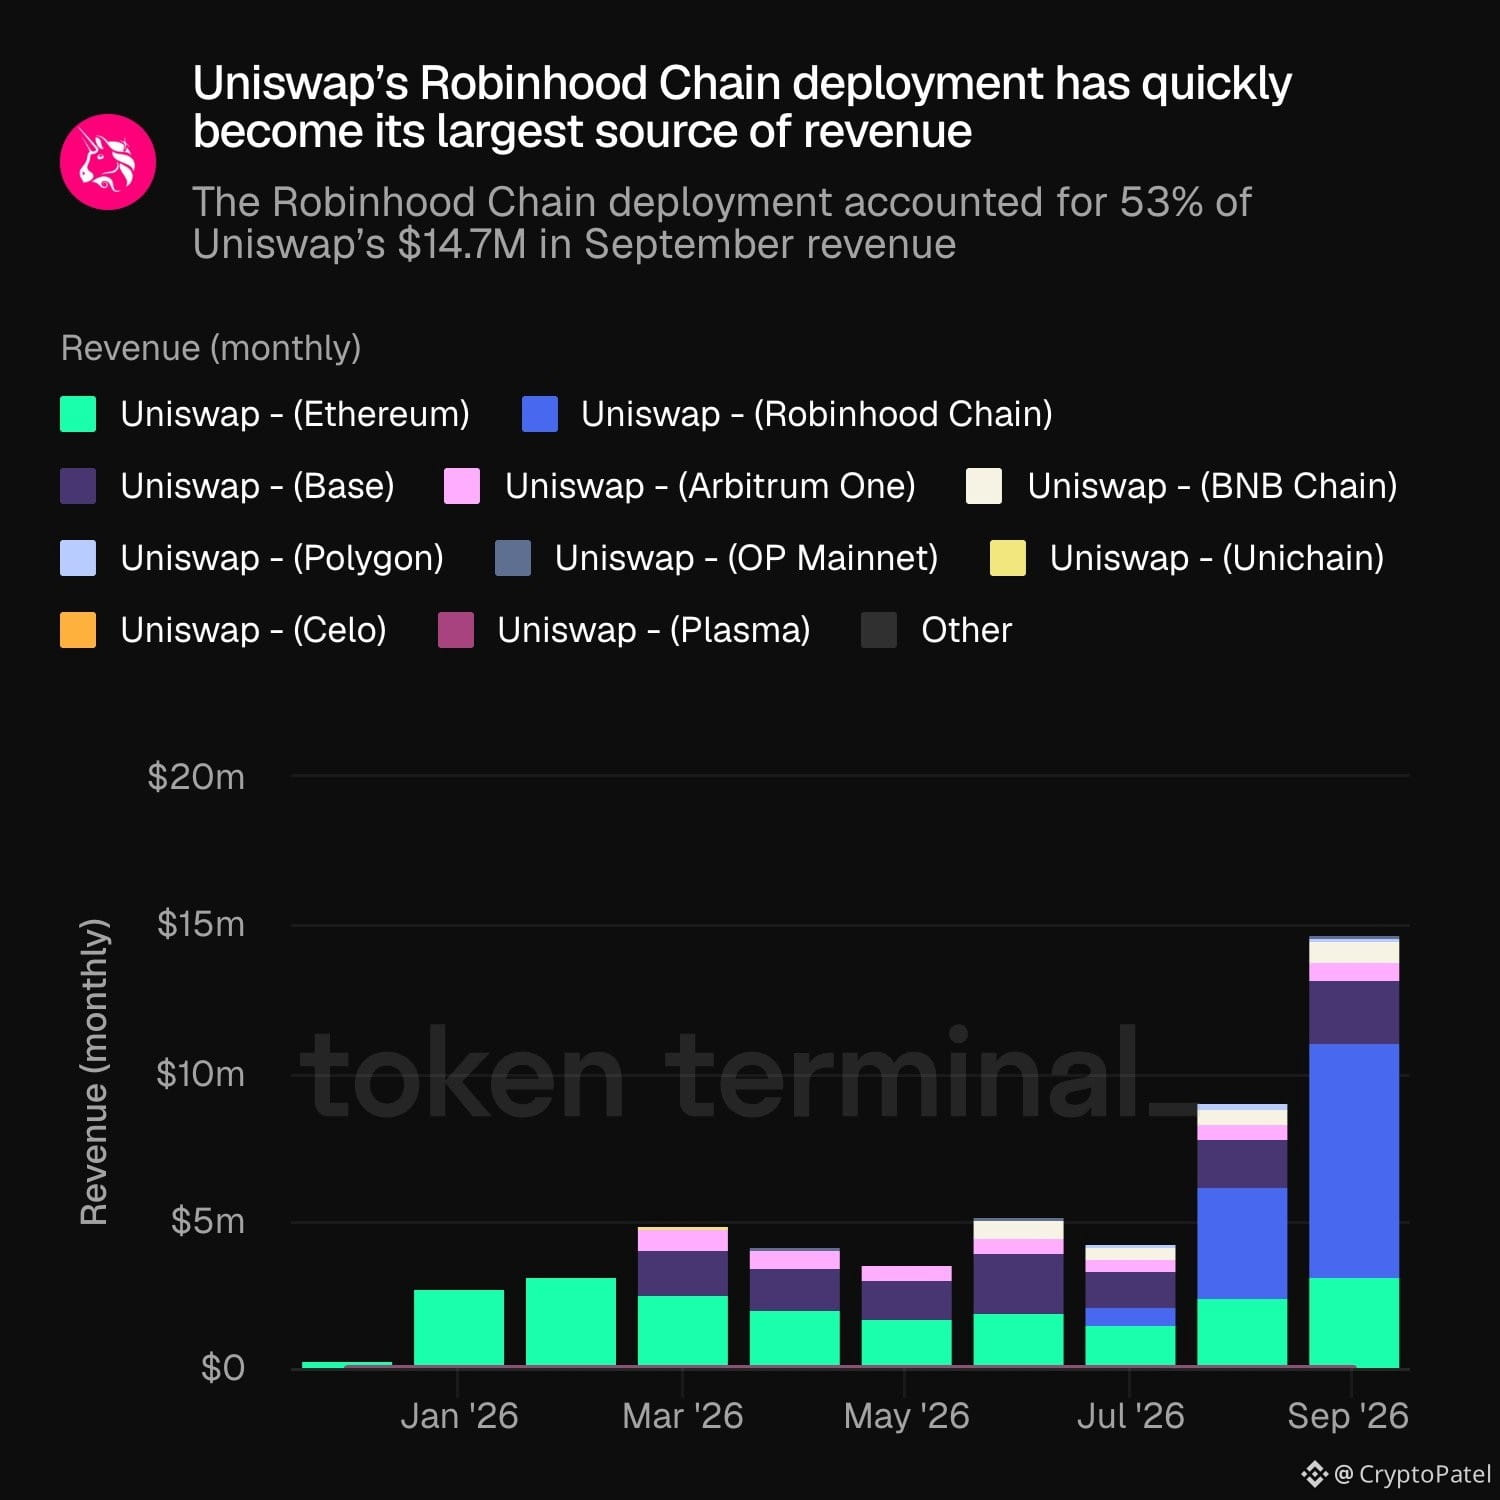
حقّق نشر Uniswap على Robinhood Chain نسبة 53% من إيراداتها في سبتمبر، البالغة 14.7 مليون دولار، أي ما يقارب 7.8 ملايين دولار.
وأصبح ذلك الآن أكبر مصدر لإيرادات Uniswap.
إذا استمر تبنّي Robinhood Chain في التسارع، فقد يكون أمام $UNI محفّز أساسي قوي.
حقّق نشر Uniswap على Robinhood Chain نسبة 53% من إيراداتها في سبتمبر، البالغة 14.7 مليون دولار، أي ما يقارب 7.8 ملايين دولار.
وأصبح ذلك الآن أكبر مصدر لإيرادات Uniswap.
إذا استمر تبنّي Robinhood Chain في التسارع، فقد يكون أمام $UNI محفّز أساسي قوي.
وأصبح ذلك الآن أكبر مصدر لإيرادات Uniswap.
إذا استمر تبنّي Robinhood Chain في التسارع، فقد يكون أمام $UNI محفّز أساسي قوي.
1
270
·
--
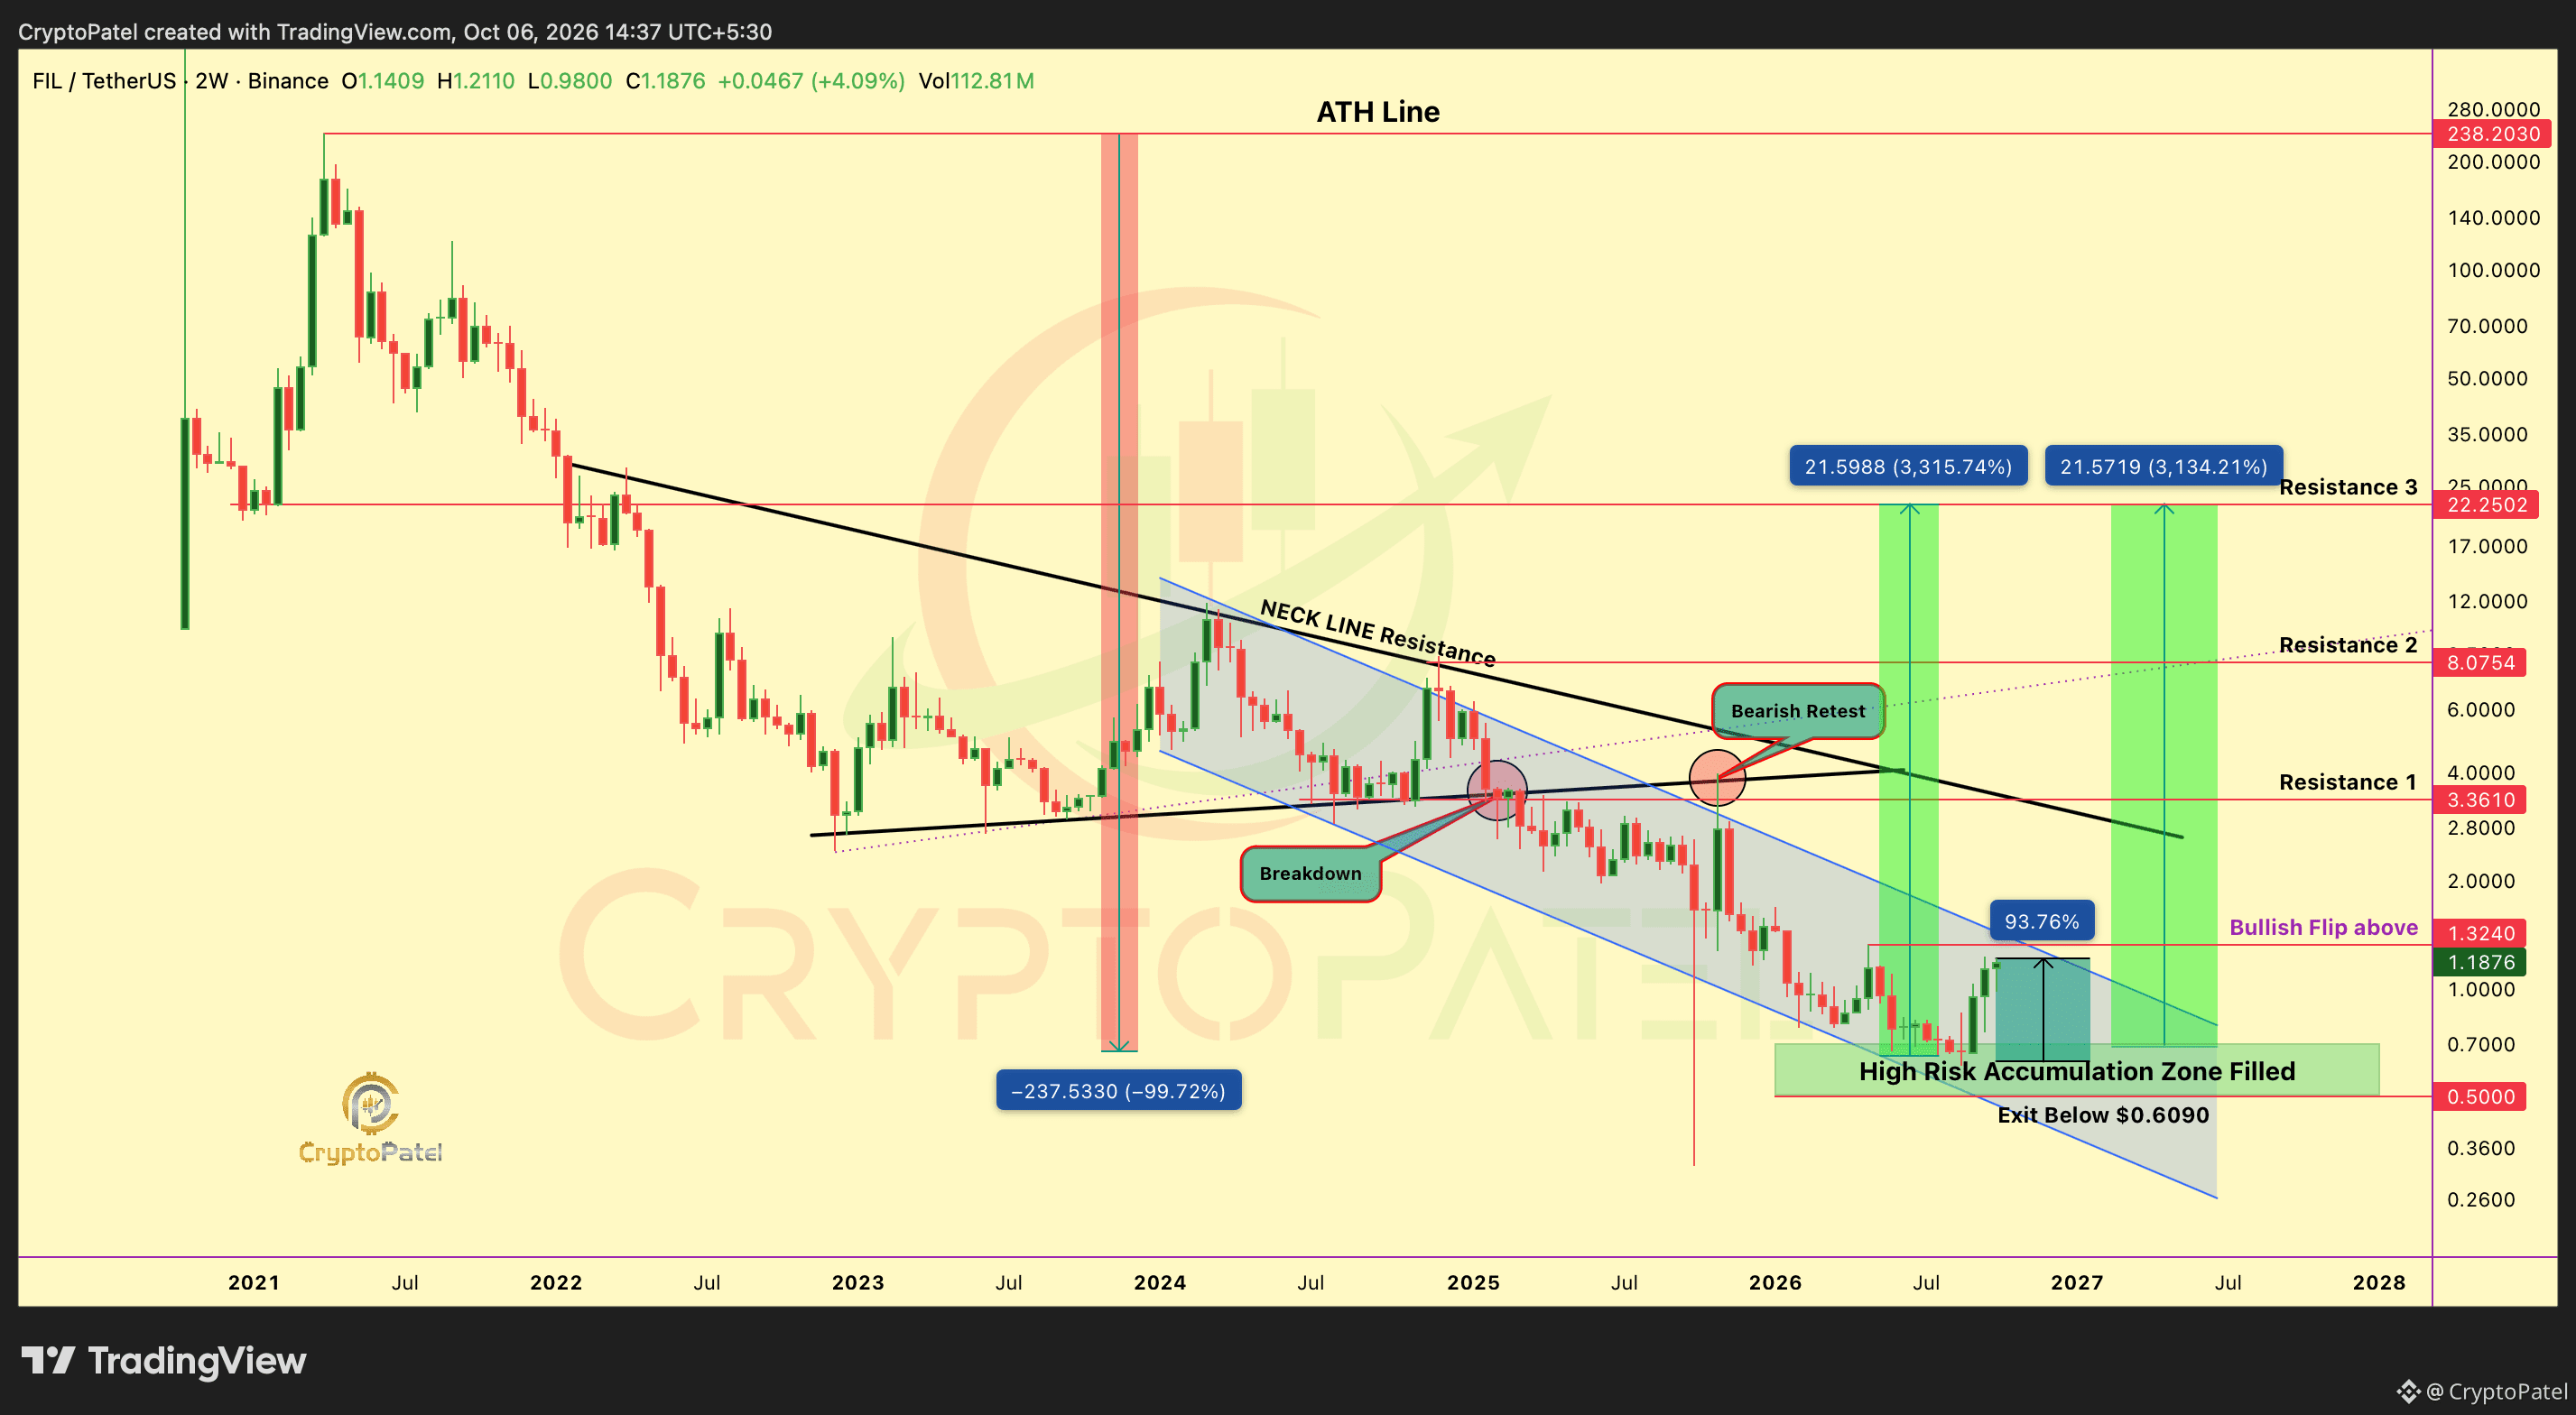
اتصلنا بـ $FIL قبل الزحام: ارتفاع بنسبة 94% من القاع | $3 → $8 → $15 → $30، هل التالي؟
في 15 أبريل، اتصلتُ بـ #FIL بشأن إحدى أكثر الفرص التي جرى تجاهلها قرب منطقة التجميع عند $0.80–$0.50.
ومنذ ذلك الحين، ارتفع FIL بنحو 94% من تلك المنطقة.
لكن قد تكون الحركة الكبرى ما زالت أمامنا.
يمثل $1.3240 المستوى الرئيسي الذي يجب مراقبته.
قد يؤدي الاختراق والثبات فوق $1.3240 إلى انعكاس كبير في البنية لصالح الاتجاه الصاعد، ويفتح الطريق نحو أهدافنا الأصلية:
الأهداف: $3 → $8 → $15 → $22 → $30
رفعتُ الآن مستوى وقف الخسارة: $0.50 → $0.6090
الإعداد + الأهداف لم تتغير.
تجاهل الجمهور FIL/USDT قرب القاع.
والآن بدأ Filecoin أخيرًا يستيقظ.
هل اغتنمت فرصة التجميع قبل الانطلاقة؟
@Filecoin
{future}(FILUSDT)
اتصلنا بـ $FIL قبل الزحام: ارتفاع بنسبة 94% من القاع | $3 → $8 → $15 → $30، هل التالي؟
في 15 أبريل، اتصلتُ بـ #FIL بشأن إحدى أكثر الفرص التي جرى تجاهلها قرب منطقة التجميع عند $0.80–$0.50.
ومنذ ذلك الحين، ارتفع FIL بنحو 94% من تلك المنطقة.
لكن قد تكون الحركة الكبرى ما زالت أمامنا.
يمثل $1.3240 المستوى الرئيسي الذي يجب مراقبته.
قد يؤدي الاختراق والثبات فوق $1.3240 إلى انعكاس كبير في البنية لصالح الاتجاه الصاعد، ويفتح الطريق نحو أهدافنا الأصلية:
الأهداف: $3 → $8 → $15 → $22 → $30
رفعتُ الآن مستوى وقف الخسارة: $0.50 → $0.6090
الإعداد + الأهداف لم تتغير.
تجاهل الجمهور FIL/USDT قرب القاع.
والآن بدأ Filecoin أخيرًا يستيقظ.
هل اغتنمت فرصة التجميع قبل الانطلاقة؟
@Filecoin
في 15 أبريل، اتصلتُ بـ #FIL بشأن إحدى أكثر الفرص التي جرى تجاهلها قرب منطقة التجميع عند $0.80–$0.50.
ومنذ ذلك الحين، ارتفع FIL بنحو 94% من تلك المنطقة.
لكن قد تكون الحركة الكبرى ما زالت أمامنا.
يمثل $1.3240 المستوى الرئيسي الذي يجب مراقبته.
قد يؤدي الاختراق والثبات فوق $1.3240 إلى انعكاس كبير في البنية لصالح الاتجاه الصاعد، ويفتح الطريق نحو أهدافنا الأصلية:
الأهداف: $3 → $8 → $15 → $22 → $30
رفعتُ الآن مستوى وقف الخسارة: $0.50 → $0.6090
الإعداد + الأهداف لم تتغير.
تجاهل الجمهور FIL/USDT قرب القاع.
والآن بدأ Filecoin أخيرًا يستيقظ.
هل اغتنمت فرصة التجميع قبل الانطلاقة؟
@Filecoin
CryptoPatel
·
--
هابطإذا كنت استثمرت 100,000 دولار في $FIL في أعلى مستوى قياسي لها في مارس 2021... اليوم سيكون لديك فقط 282 دولارًا
القمة (ATH): 238+ دولارًا
اليوم: ~0.67 دولار
إجمالي الخسارة: 99,718 دولارًا (-99.72%)
واحدة من أكبر عمليات تدمير الثروات في تاريخ العملات المشفرة.
درسٌ مكلف يجب أن يتعلمه كل مستثمر؟
القمة (ATH): 238+ دولارًا
اليوم: ~0.67 دولار
إجمالي الخسارة: 99,718 دولارًا (-99.72%)
واحدة من أكبر عمليات تدمير الثروات في تاريخ العملات المشفرة.
درسٌ مكلف يجب أن يتعلمه كل مستثمر؟
1
394
·
--
صاعد
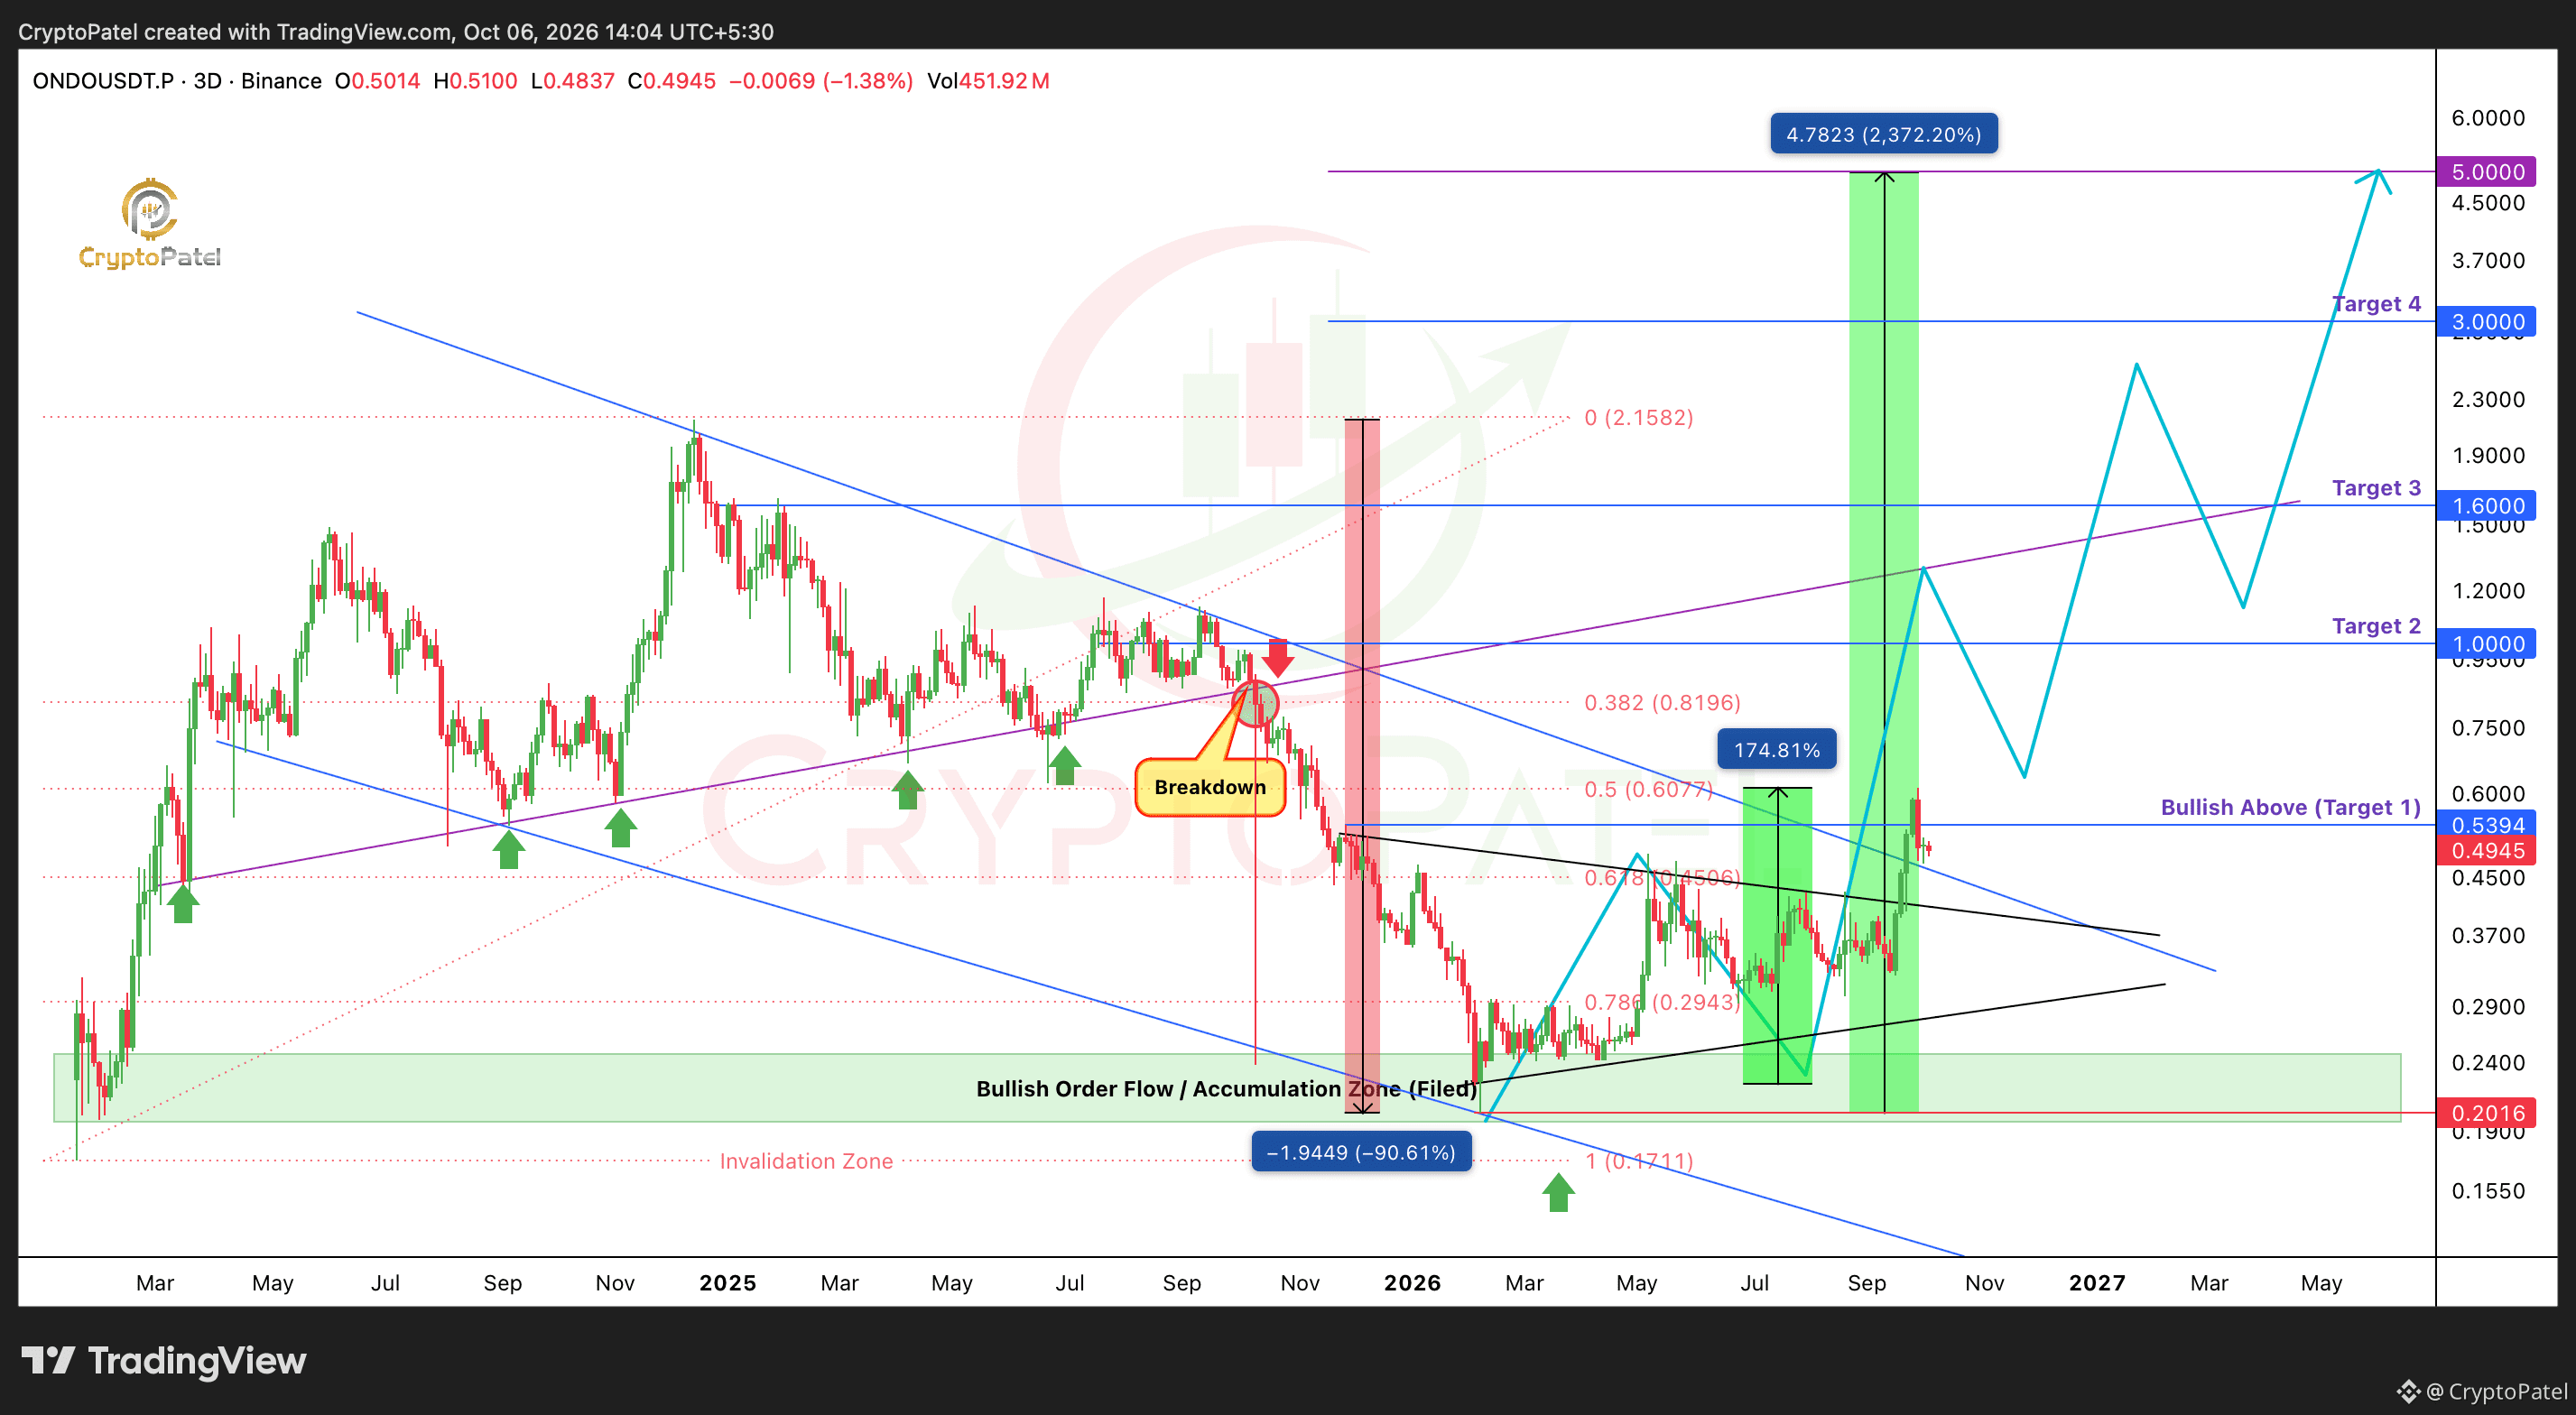
$ONDO توقعات السعر: ربما تكون الحركة التالية نحو 5 دولارات قد بدأت للتو
توقعت وصول #ONDO إلى نحو 0.20 دولار.
والآن وصل ONDO/USDT إلى 0.61 دولار، بارتفاع 175% عن منطقة دخولنا، أي ما يقارب ثلاثة أضعاف.
لكن الأهم الآن:
تحوّل ONDO أخيرًا إلى اتجاه صعودي على الإطار الزمني العالي (HTF)، بعد الإغلاق فوق 0.5394 دولار، مؤكّدًا اختراق البنية الذي كنت أنتظره.
من هنا، أراقب:
➜ إعادة التجميع: 0.32–0.39 دولار
➜ منطقة إعادة اختبار تدفق الأوامر الصعودي
➜ قد تصبح التراجعات إلى هذه المنطقة فرصًا للشراء إذا صمدت البنية
➜ يظل الميل الصعودي على الإطار الزمني العالي قائمًا فوق 0.5394 دولار
الأهداف الأصلية لا تزال كما هي: 1 دولار → 2.15 دولار → 5 دولارات
وقد حققت الموجة الأولى بالفعل ما يقارب ثلاثة أضعاف.
والآن السؤال هو: هل سيبدأ ONDO/USDT موجته الصعودية المكافئة التالية؟
أراقب منطقة 0.32–0.39 دولار عن كثب.
ليست نصيحة مالية | أجرِ بحثك الخاص
❤️ أعجبني + أعد النشر + أضف إلى المفضلة إذا كنت تتابع هذا الإعداد على ONDO/USDT.
{future}(ONDOUSDT)
$ONDO توقعات السعر: ربما تكون الحركة التالية نحو 5 دولارات قد بدأت للتو
توقعت وصول #ONDO إلى نحو 0.20 دولار.
والآن وصل ONDO/USDT إلى 0.61 دولار، بارتفاع 175% عن منطقة دخولنا، أي ما يقارب ثلاثة أضعاف.
لكن الأهم الآن:
تحوّل ONDO أخيرًا إلى اتجاه صعودي على الإطار الزمني العالي (HTF)، بعد الإغلاق فوق 0.5394 دولار، مؤكّدًا اختراق البنية الذي كنت أنتظره.
من هنا، أراقب:
➜ إعادة التجميع: 0.32–0.39 دولار
➜ منطقة إعادة اختبار تدفق الأوامر الصعودي
➜ قد تصبح التراجعات إلى هذه المنطقة فرصًا للشراء إذا صمدت البنية
➜ يظل الميل الصعودي على الإطار الزمني العالي قائمًا فوق 0.5394 دولار
الأهداف الأصلية لا تزال كما هي: 1 دولار → 2.15 دولار → 5 دولارات
وقد حققت الموجة الأولى بالفعل ما يقارب ثلاثة أضعاف.
والآن السؤال هو: هل سيبدأ ONDO/USDT موجته الصعودية المكافئة التالية؟
أراقب منطقة 0.32–0.39 دولار عن كثب.
ليست نصيحة مالية | أجرِ بحثك الخاص
❤️ أعجبني + أعد النشر + أضف إلى المفضلة إذا كنت تتابع هذا الإعداد على ONDO/USDT.
توقعت وصول #ONDO إلى نحو 0.20 دولار.
والآن وصل ONDO/USDT إلى 0.61 دولار، بارتفاع 175% عن منطقة دخولنا، أي ما يقارب ثلاثة أضعاف.
لكن الأهم الآن:
تحوّل ONDO أخيرًا إلى اتجاه صعودي على الإطار الزمني العالي (HTF)، بعد الإغلاق فوق 0.5394 دولار، مؤكّدًا اختراق البنية الذي كنت أنتظره.
من هنا، أراقب:
➜ إعادة التجميع: 0.32–0.39 دولار
➜ منطقة إعادة اختبار تدفق الأوامر الصعودي
➜ قد تصبح التراجعات إلى هذه المنطقة فرصًا للشراء إذا صمدت البنية
➜ يظل الميل الصعودي على الإطار الزمني العالي قائمًا فوق 0.5394 دولار
الأهداف الأصلية لا تزال كما هي: 1 دولار → 2.15 دولار → 5 دولارات
وقد حققت الموجة الأولى بالفعل ما يقارب ثلاثة أضعاف.
والآن السؤال هو: هل سيبدأ ONDO/USDT موجته الصعودية المكافئة التالية؟
أراقب منطقة 0.32–0.39 دولار عن كثب.
ليست نصيحة مالية | أجرِ بحثك الخاص
❤️ أعجبني + أعد النشر + أضف إلى المفضلة إذا كنت تتابع هذا الإعداد على ONDO/USDT.
CryptoPatel
·
--
صاعد$ONDO يمكنك 24x من هنا - قائد RWA الذي لا يشتريه أحد بخصم 90%
1️⃣ تراجع عميق إلى منطقة طلب فيبوناتشي HTF ($0.25-$0.18) مع تداخل OB صاعد + تراكم وايكوف عند الدعم
2️⃣ ميزة المحترفين: اشترت WLFI الخاصة بترامب #ONDO بسعر $1.374 - أنت تحصل عليه ~85% أقل من دخولهم. تم استثمار $470K مقابل ~342K توكنز
3️⃣ تأكيد: يجب أن يتحول إلى الصعود فوق منطقة تحويل الهيكل $0.47. هيكل HTF صالح فوق $0.17
الأهداف: $1.00/$2.15/$5.00+
إبطال: الانهيار تحت $0.171
قائد السرد RWA في منطقة طلب عالية التداخل. فيبوناتشي + OB صاعد + دعم HTF جميعها تتكدس. هنا حيث تُصنع المدخلات الجيلية، وليس حيث تنتهي.
تحليل تقني بحت | ليس نصيحة مالية | قم بأبحاثك الخاصة
@Ondo Finance #CryptoPatel
1️⃣ تراجع عميق إلى منطقة طلب فيبوناتشي HTF ($0.25-$0.18) مع تداخل OB صاعد + تراكم وايكوف عند الدعم
2️⃣ ميزة المحترفين: اشترت WLFI الخاصة بترامب #ONDO بسعر $1.374 - أنت تحصل عليه ~85% أقل من دخولهم. تم استثمار $470K مقابل ~342K توكنز
3️⃣ تأكيد: يجب أن يتحول إلى الصعود فوق منطقة تحويل الهيكل $0.47. هيكل HTF صالح فوق $0.17
الأهداف: $1.00/$2.15/$5.00+
إبطال: الانهيار تحت $0.171
قائد السرد RWA في منطقة طلب عالية التداخل. فيبوناتشي + OB صاعد + دعم HTF جميعها تتكدس. هنا حيث تُصنع المدخلات الجيلية، وليس حيث تنتهي.
تحليل تقني بحت | ليس نصيحة مالية | قم بأبحاثك الخاصة
@Ondo Finance #CryptoPatel
1
394
سجّل الدخول لاستكشاف المزيد من المُحتوى
انضم إلى مُستخدمي العملات الرقمية حول العالم على Binance Square
⚡️ احصل على أحدث المعلومات المفيدة عن العملات الرقمية.
💬 موثوقة من قبل أكبر منصّة لتداول العملات الرقمية في العالم.
👍 اكتشف الرؤى الحقيقية من صنّاع المُحتوى الموثوقين.
البريد الإلكتروني / رقم الهاتف
المواضيع الرائجة
FedMinutesFocusOnOctoberPause
281,639 مشاهدات
1,711 يقومون بالنقاش
🚨 قد يكون الاحتياطي الفيدرالي المحفّز الكبير التالي لبيتكوين 👀
Al-Sanani
·12 إعجاب
·18.6k مشاهدات
IMFGrantsWaiverForElSalvadorBitcoinBreach
1,237 مشاهدات
61 يقومون بالنقاش
BinanceLaunchesBinanceIntelligence
1.2M مشاهدات
6,846 يقومون بالنقاش