
Callistemon
553 منشورات

Callistemon
إبلاغ
حظر المُستخدم
Investor/Trader/Architect
153 تتابع
4.1K+ المتابعون
7.4K+ إعجاب
منشورات
الكل
اقتباسات
مقاطع فيديو
·
--
صاعد
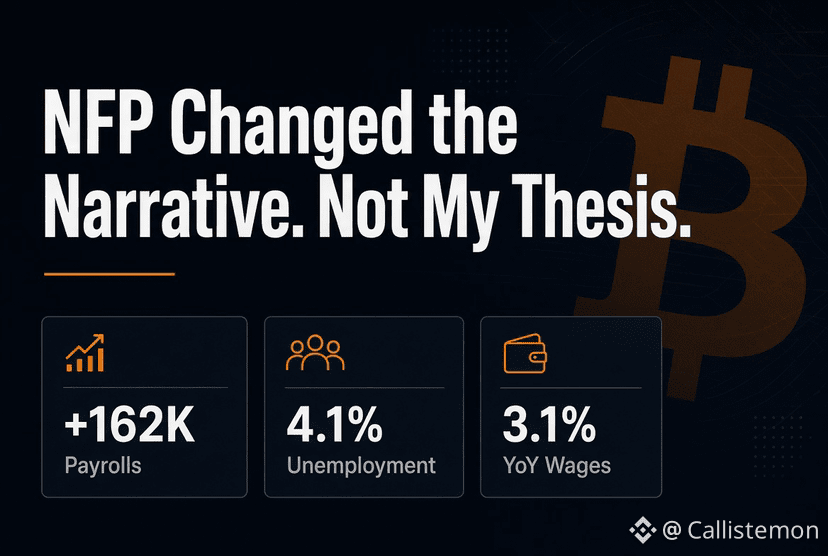
لقد غيّر تقرير الوظائف غير الزراعية السرد. وليس أطروحتي.
توقفت عن Binance Square لمدة شهر.
تحرك السوق.
لكن أطروحتي لم تتحرك.
جاءت وظائف أغسطس عند +162 ألف. ظلّ معدل البطالة عند 4.1%. وبقي نمو الأجور محدودًا عند 3.1% على أساس سنوي.
نعم، القراءة تميل إلى التشدد بالنسبة للاحتياطي الفيدرالي.
لا، لا أرى اقتصادًا منهارًا.
أرى سوق عمل ما زال صامدًا بينما تظل ضغوط الأجور قابلة للإدارة. وهذا مهم.
لم تكن فرضية الصعود تتطلب أن تأتي كل الأرقام الكلية بنبرة تيسيرية.
هي تتطلب أن يظل الاقتصاد قويًا بما يكفي لتجنب الركود، بينما يمنح التضخم في النهاية الفيدرالي مجالًا للتيسير.
حاليًا:
النمو مرن.
سوق العمل مرن.
أما السيولة فهي لا تزال السؤال الأكبر.
ما زلت في المكان نفسه. متفائلًا.
السؤال لم يعد ما إذا كانت الدورة يمكن أن تستمر.
بل إلى أي مدى يمكن للسوق أن يمتص الضغط الكلي قبل التوسع التالي.
ما قراءتك أنت؟
دورة صعودية أم فخّ أواخر الدورة؟
#NFP #macro $BTC
{future}(BTCUSDT)
لقد غيّر تقرير الوظائف غير الزراعية السرد. وليس أطروحتي.
توقفت عن Binance Square لمدة شهر.
تحرك السوق.
لكن أطروحتي لم تتحرك.
جاءت وظائف أغسطس عند +162 ألف. ظلّ معدل البطالة عند 4.1%. وبقي نمو الأجور محدودًا عند 3.1% على أساس سنوي.
نعم، القراءة تميل إلى التشدد بالنسبة للاحتياطي الفيدرالي.
لا، لا أرى اقتصادًا منهارًا.
أرى سوق عمل ما زال صامدًا بينما تظل ضغوط الأجور قابلة للإدارة. وهذا مهم.
لم تكن فرضية الصعود تتطلب أن تأتي كل الأرقام الكلية بنبرة تيسيرية.
هي تتطلب أن يظل الاقتصاد قويًا بما يكفي لتجنب الركود، بينما يمنح التضخم في النهاية الفيدرالي مجالًا للتيسير.
حاليًا:
النمو مرن.
سوق العمل مرن.
أما السيولة فهي لا تزال السؤال الأكبر.
ما زلت في المكان نفسه. متفائلًا.
السؤال لم يعد ما إذا كانت الدورة يمكن أن تستمر.
بل إلى أي مدى يمكن للسوق أن يمتص الضغط الكلي قبل التوسع التالي.
ما قراءتك أنت؟
دورة صعودية أم فخّ أواخر الدورة؟
#NFP #macro $BTC
توقفت عن Binance Square لمدة شهر.
تحرك السوق.
لكن أطروحتي لم تتحرك.
جاءت وظائف أغسطس عند +162 ألف. ظلّ معدل البطالة عند 4.1%. وبقي نمو الأجور محدودًا عند 3.1% على أساس سنوي.
نعم، القراءة تميل إلى التشدد بالنسبة للاحتياطي الفيدرالي.
لا، لا أرى اقتصادًا منهارًا.
أرى سوق عمل ما زال صامدًا بينما تظل ضغوط الأجور قابلة للإدارة. وهذا مهم.
لم تكن فرضية الصعود تتطلب أن تأتي كل الأرقام الكلية بنبرة تيسيرية.
هي تتطلب أن يظل الاقتصاد قويًا بما يكفي لتجنب الركود، بينما يمنح التضخم في النهاية الفيدرالي مجالًا للتيسير.
حاليًا:
النمو مرن.
سوق العمل مرن.
أما السيولة فهي لا تزال السؤال الأكبر.
ما زلت في المكان نفسه. متفائلًا.
السؤال لم يعد ما إذا كانت الدورة يمكن أن تستمر.
بل إلى أي مدى يمكن للسوق أن يمتص الضغط الكلي قبل التوسع التالي.
ما قراءتك أنت؟
دورة صعودية أم فخّ أواخر الدورة؟
#NFP #macro $BTC
1
98
·
--
صاعد
ONDO الإعداد يصبح أكثر إثارة للاهتمام
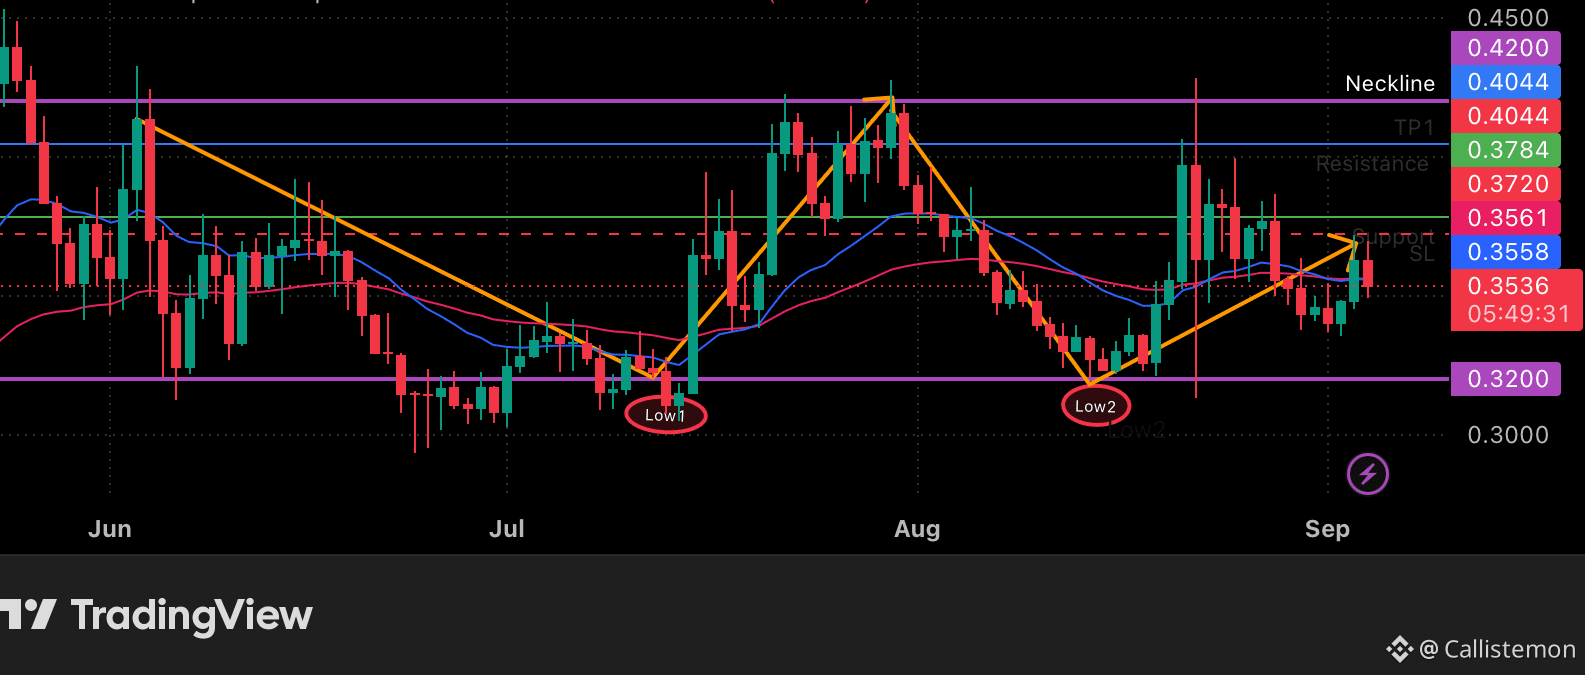
$ONDO يبني نمط قاع مزدوج محتمل على الرسم البياني اليومي.
تكوَّن القاع الأول حول 0.32$.
أمسك القاع الثاني بنفس المنطقة.
الآن يتحرك السعر حول 0.35$، مع المقاومة الرئيسية عند 0.3784$ وخط العنق عند 0.4044$.
البنية بسيطة:
0.32$: دعم القاع المزدوج
0.355–0.378$: منطقة التماسك / المقاومة الحالية
0.4044$: خط العنق
0.4200$: الهدف الصعودي الأول
الجزء المهم ليس النمط نفسه.
إنه التأكيد.
إغلاق يومي فوق 0.4044$ سيُكمل البنية وقد ينقل ONDO من مرحلة التجميع إلى مرحلة التوسع.
حتى ذلك الحين، إنه مجرد إعداد.
هل ستتداول الاختراق — أم تنتظر إعادة اختبار خط العنق؟
#ONDO #crypto
{future}(ONDOUSDT)
ONDO الإعداد يصبح أكثر إثارة للاهتمام
$ONDO يبني نمط قاع مزدوج محتمل على الرسم البياني اليومي.
تكوَّن القاع الأول حول 0.32$.
أمسك القاع الثاني بنفس المنطقة.
الآن يتحرك السعر حول 0.35$، مع المقاومة الرئيسية عند 0.3784$ وخط العنق عند 0.4044$.
البنية بسيطة:
0.32$: دعم القاع المزدوج
0.355–0.378$: منطقة التماسك / المقاومة الحالية
0.4044$: خط العنق
0.4200$: الهدف الصعودي الأول
الجزء المهم ليس النمط نفسه.
إنه التأكيد.
إغلاق يومي فوق 0.4044$ سيُكمل البنية وقد ينقل ONDO من مرحلة التجميع إلى مرحلة التوسع.
حتى ذلك الحين، إنه مجرد إعداد.
هل ستتداول الاختراق — أم تنتظر إعادة اختبار خط العنق؟
#ONDO #crypto
$ONDO يبني نمط قاع مزدوج محتمل على الرسم البياني اليومي.
تكوَّن القاع الأول حول 0.32$.
أمسك القاع الثاني بنفس المنطقة.
الآن يتحرك السعر حول 0.35$، مع المقاومة الرئيسية عند 0.3784$ وخط العنق عند 0.4044$.
البنية بسيطة:
0.32$: دعم القاع المزدوج
0.355–0.378$: منطقة التماسك / المقاومة الحالية
0.4044$: خط العنق
0.4200$: الهدف الصعودي الأول
الجزء المهم ليس النمط نفسه.
إنه التأكيد.
إغلاق يومي فوق 0.4044$ سيُكمل البنية وقد ينقل ONDO من مرحلة التجميع إلى مرحلة التوسع.
حتى ذلك الحين، إنه مجرد إعداد.
هل ستتداول الاختراق — أم تنتظر إعادة اختبار خط العنق؟
#ONDO #crypto
1
214
·
--
صاعد
LDO/USDT هناك شيء يتشكّل
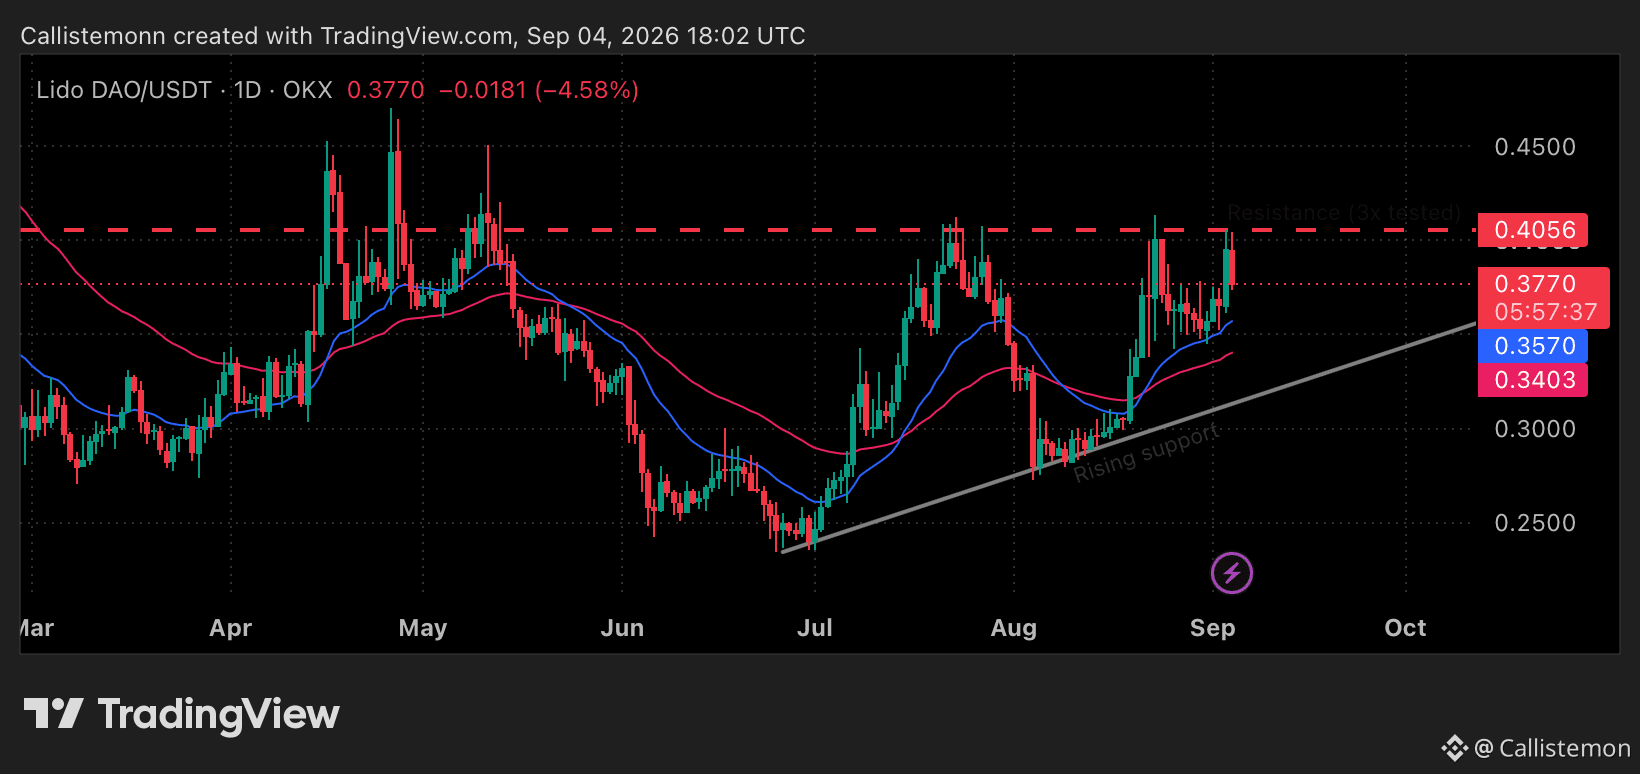
$LDO عاد عند $0.4056.
لقد رفضت هذه المقاومة السعر ثلاث مرات بالفعل.
لكن هناك تفصيل واحد أراقبه عن كثب:
كل رفضٍ رئيسي تَبِعه قاع أعلى.
والآن يتموضع السعر فوق:
المتوسط المتحرك 20 يومًا: $0.3570
المتوسط المتحرك 50 يومًا: $0.3403
خط اتجاه صاعد
وهذا يخلق انضغاطًا مثيرًا للاهتمام:
المقاومة تبقى ثابتة.
والدعم يواصل الارتفاع.
إذا تم كسر $0.4056 بإغلاق يومي قوي، فسيتغير الهيكل.
إذا رُفض مجددًا، فستصبح منطقة $0.3570 → $0.3403 هي المنطقة التي يجب مراقبتها.
فماذا سيحدث أولًا؟
الرفض الرابع أم الاختراق؟
أنا أراقب الإغلاق، لا الذيل.
#ldo #Crypto
{future}(LDOUSDT)
LDO/USDT هناك شيء يتشكّل
$LDO عاد عند $0.4056.
لقد رفضت هذه المقاومة السعر ثلاث مرات بالفعل.
لكن هناك تفصيل واحد أراقبه عن كثب:
كل رفضٍ رئيسي تَبِعه قاع أعلى.
والآن يتموضع السعر فوق:
المتوسط المتحرك 20 يومًا: $0.3570
المتوسط المتحرك 50 يومًا: $0.3403
خط اتجاه صاعد
وهذا يخلق انضغاطًا مثيرًا للاهتمام:
المقاومة تبقى ثابتة.
والدعم يواصل الارتفاع.
إذا تم كسر $0.4056 بإغلاق يومي قوي، فسيتغير الهيكل.
إذا رُفض مجددًا، فستصبح منطقة $0.3570 → $0.3403 هي المنطقة التي يجب مراقبتها.
فماذا سيحدث أولًا؟
الرفض الرابع أم الاختراق؟
أنا أراقب الإغلاق، لا الذيل.
#ldo #Crypto
$LDO عاد عند $0.4056.
لقد رفضت هذه المقاومة السعر ثلاث مرات بالفعل.
لكن هناك تفصيل واحد أراقبه عن كثب:
كل رفضٍ رئيسي تَبِعه قاع أعلى.
والآن يتموضع السعر فوق:
المتوسط المتحرك 20 يومًا: $0.3570
المتوسط المتحرك 50 يومًا: $0.3403
خط اتجاه صاعد
وهذا يخلق انضغاطًا مثيرًا للاهتمام:
المقاومة تبقى ثابتة.
والدعم يواصل الارتفاع.
إذا تم كسر $0.4056 بإغلاق يومي قوي، فسيتغير الهيكل.
إذا رُفض مجددًا، فستصبح منطقة $0.3570 → $0.3403 هي المنطقة التي يجب مراقبتها.
فماذا سيحدث أولًا؟
الرفض الرابع أم الاختراق؟
أنا أراقب الإغلاق، لا الذيل.
#ldo #Crypto
244
·
--
صاعد
📊 $TAO Setup: مرونة فئة الذكاء الاصطناعي
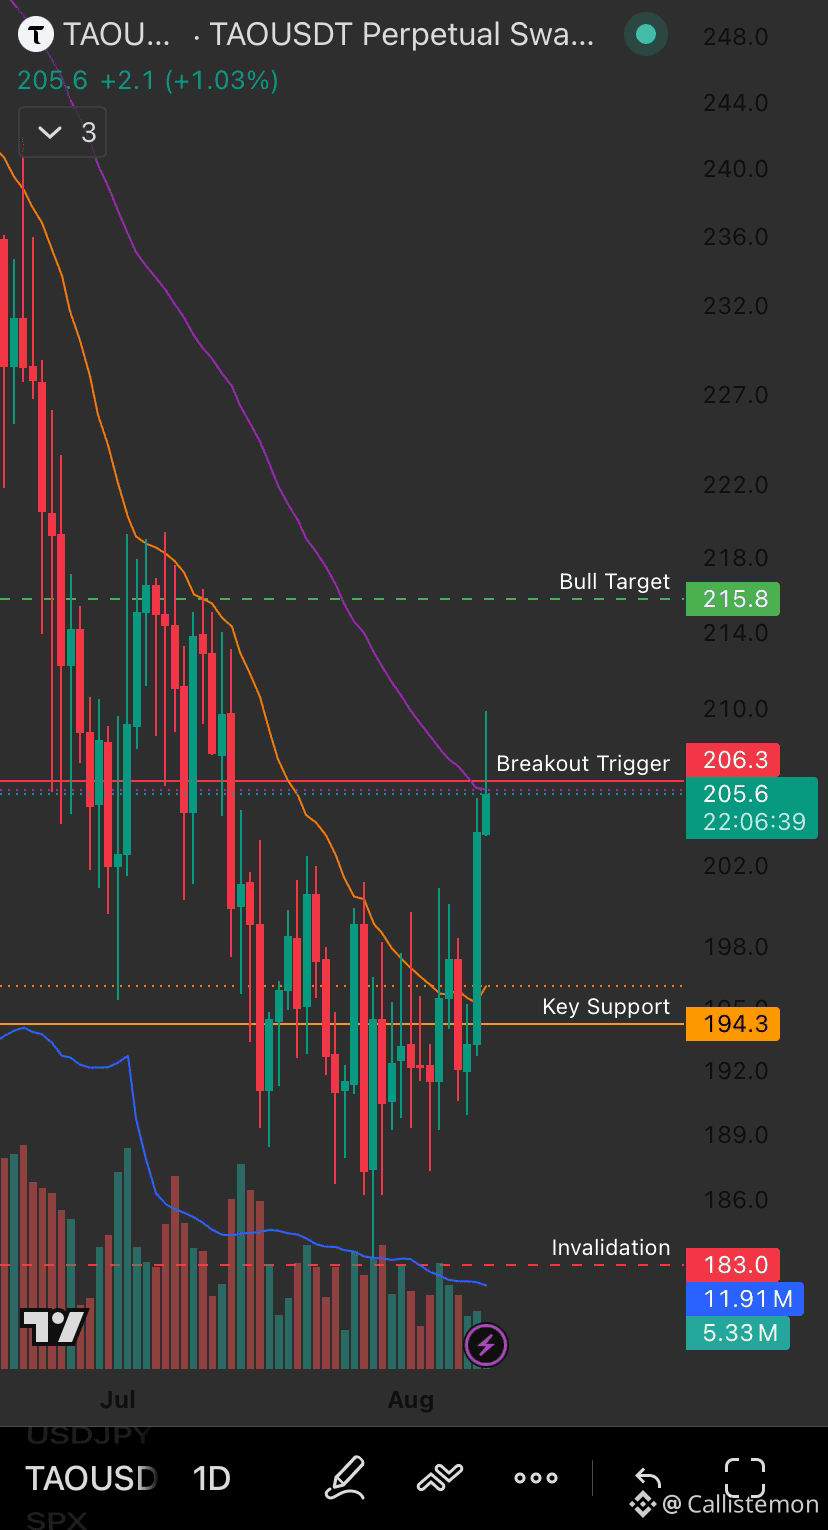
TAO قام للتو بواحد من أدق تحركاته خلال أسابيع: شمعة واحدة اندفعت من 183 دولارًا إلى 209.9 دولارًا، والآن يتداول في تماسك عند 205.7، ويقع تقريبًا تمامًا على متوسطه المتحرك لـ 50 يومًا (205.8)، وتحته مباشرة مقاومة عند 206.3.
هذه نقطة قرار حقيقية، وليست إعدادًا للانتظار:
🟢 المقاومة: 206.3—اختراق مؤكَّد بالحجم هنا يشير إلى استمرار الصعود، مع قيام EMA50 بالفعل بدور دعم تحت السعر
🔴 الدعم: 194.3—فقدانه سيُبطل بنية الاختراق الأخيرة
RSI عند 57.39 ويملك زخمًا ثابتًا دون أن يكون مُبالغًا فيه، ما يترك مجالًا للمضي للأعلى إذا ظل المشترون في السيطرة.
جدير بالتركيز على هذا في سياقه: بينما كانت العملات الكبرى متباينة هذا الأسبوع، فإن رموز سردية الذكاء الاصطناعي مثل TAO تُظهر قوة نسبية حقيقية. إذا كانت قصة دوران كريبتو القادمة هي "بنية الذكاء الاصطناعي"، فهذا من الأسماء التي تقودها.
نراقب لمعرفة ما إذا كان سيتم تجاوز 206.3 بوضوح. ليس نصيحة مالية، بحث/لا. هل أنتم أيضًا متمركزون هنا؟ 👇
{future}(TAOUSDT)
📊 $TAO Setup: مرونة فئة الذكاء الاصطناعي
TAO قام للتو بواحد من أدق تحركاته خلال أسابيع: شمعة واحدة اندفعت من 183 دولارًا إلى 209.9 دولارًا، والآن يتداول في تماسك عند 205.7، ويقع تقريبًا تمامًا على متوسطه المتحرك لـ 50 يومًا (205.8)، وتحته مباشرة مقاومة عند 206.3.
هذه نقطة قرار حقيقية، وليست إعدادًا للانتظار:
🟢 المقاومة: 206.3—اختراق مؤكَّد بالحجم هنا يشير إلى استمرار الصعود، مع قيام EMA50 بالفعل بدور دعم تحت السعر
🔴 الدعم: 194.3—فقدانه سيُبطل بنية الاختراق الأخيرة
RSI عند 57.39 ويملك زخمًا ثابتًا دون أن يكون مُبالغًا فيه، ما يترك مجالًا للمضي للأعلى إذا ظل المشترون في السيطرة.
جدير بالتركيز على هذا في سياقه: بينما كانت العملات الكبرى متباينة هذا الأسبوع، فإن رموز سردية الذكاء الاصطناعي مثل TAO تُظهر قوة نسبية حقيقية. إذا كانت قصة دوران كريبتو القادمة هي "بنية الذكاء الاصطناعي"، فهذا من الأسماء التي تقودها.
نراقب لمعرفة ما إذا كان سيتم تجاوز 206.3 بوضوح. ليس نصيحة مالية، بحث/لا. هل أنتم أيضًا متمركزون هنا؟ 👇
TAO قام للتو بواحد من أدق تحركاته خلال أسابيع: شمعة واحدة اندفعت من 183 دولارًا إلى 209.9 دولارًا، والآن يتداول في تماسك عند 205.7، ويقع تقريبًا تمامًا على متوسطه المتحرك لـ 50 يومًا (205.8)، وتحته مباشرة مقاومة عند 206.3.
هذه نقطة قرار حقيقية، وليست إعدادًا للانتظار:
🟢 المقاومة: 206.3—اختراق مؤكَّد بالحجم هنا يشير إلى استمرار الصعود، مع قيام EMA50 بالفعل بدور دعم تحت السعر
🔴 الدعم: 194.3—فقدانه سيُبطل بنية الاختراق الأخيرة
RSI عند 57.39 ويملك زخمًا ثابتًا دون أن يكون مُبالغًا فيه، ما يترك مجالًا للمضي للأعلى إذا ظل المشترون في السيطرة.
جدير بالتركيز على هذا في سياقه: بينما كانت العملات الكبرى متباينة هذا الأسبوع، فإن رموز سردية الذكاء الاصطناعي مثل TAO تُظهر قوة نسبية حقيقية. إذا كانت قصة دوران كريبتو القادمة هي "بنية الذكاء الاصطناعي"، فهذا من الأسماء التي تقودها.
نراقب لمعرفة ما إذا كان سيتم تجاوز 206.3 بوضوح. ليس نصيحة مالية، بحث/لا. هل أنتم أيضًا متمركزون هنا؟ 👇
3
270
·
--
صاعد
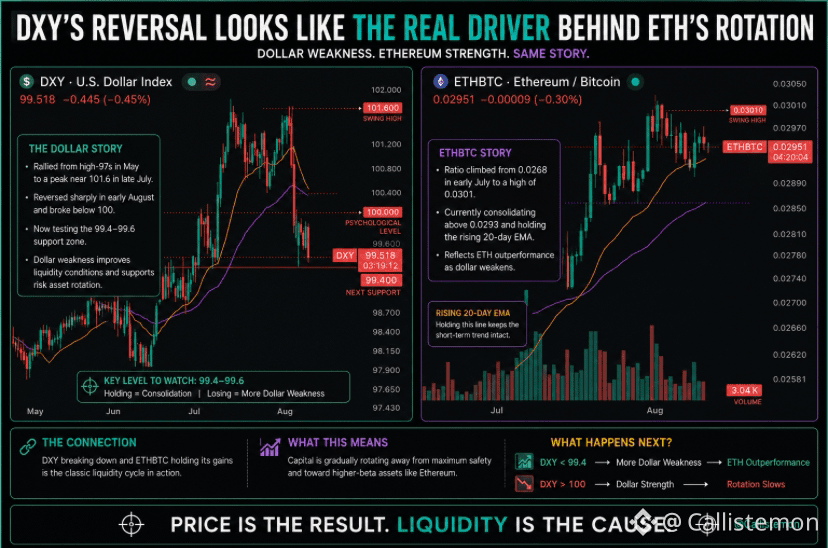
📊 انعكاس DXY هو القصة الحقيقية وراء التحوّل في ETH
كان تويتر كريبتو منشغلًا بـ DXY في الآونة الأخيرة، ومن خلال المخطط يتضح أن هذا الاهتمام في مكانه. ارتفع مؤشر الدولار بقوة من مايو حتى أواخر يوليو، مسجّلًا قمة قرب 101.6 دولار، ثم انعكس بشكل حاد في أوائل أغسطس ليهبط إلى 99.518، والآن يختبر نطاق دعم 99.4–99.6 مباشرة أسفل مستوى 100 دولار النفسي. هذه حركة حقيقية وقابلة للتداول وليست مجرد ضوضاء خلفية.
لنتابعها مقابل ETHBTC خلال الفترة نفسها: فقد تحرّك النِّسْب من 0.0268 في أوائل يوليو إلى قمة بلغت 0.0301، وهو يتداول حاليًا عند 0.02951 في نطاق تَجميع، مع الحفاظ على مستواه فوق متوسطه المتحرك لمدة 20 يومًا الصاعد. ضعف الدولار وتفوّق ETH يظهران في نفس النافذة التي يراقبها متداولو العملات الرقمية عادةً كارتباط عكسي كلاسيكي، ويتجسّد ذلك على أرض الواقع.
يرتبط هذا مباشرةً بقصة التحوّل التي أشرتُ إليها الأسبوع الماضي: يُظهر ملف Intesa للربع الثاني من 13F انتقالًا من التعرّض لـ BTC إلى ETH المُرهَن (staked)، وتشير حركة سعر اليوم لـ BTC/ETH في الاتجاه نفسه.
الجدير بالملاحظة هو ما إذا كان DXY سيحافظ على منطقة الدعم هذه أم سيكسرها إلى الأسفل؛ إذ من المرجّح أن ذلك سيحدّد الخطوة التالية لنِسْبة ETH/BTC أيضًا.#dxy #ETHBTC
📊 انعكاس DXY هو القصة الحقيقية وراء التحوّل في ETH
كان تويتر كريبتو منشغلًا بـ DXY في الآونة الأخيرة، ومن خلال المخطط يتضح أن هذا الاهتمام في مكانه. ارتفع مؤشر الدولار بقوة من مايو حتى أواخر يوليو، مسجّلًا قمة قرب 101.6 دولار، ثم انعكس بشكل حاد في أوائل أغسطس ليهبط إلى 99.518، والآن يختبر نطاق دعم 99.4–99.6 مباشرة أسفل مستوى 100 دولار النفسي. هذه حركة حقيقية وقابلة للتداول وليست مجرد ضوضاء خلفية.
لنتابعها مقابل ETHBTC خلال الفترة نفسها: فقد تحرّك النِّسْب من 0.0268 في أوائل يوليو إلى قمة بلغت 0.0301، وهو يتداول حاليًا عند 0.02951 في نطاق تَجميع، مع الحفاظ على مستواه فوق متوسطه المتحرك لمدة 20 يومًا الصاعد. ضعف الدولار وتفوّق ETH يظهران في نفس النافذة التي يراقبها متداولو العملات الرقمية عادةً كارتباط عكسي كلاسيكي، ويتجسّد ذلك على أرض الواقع.
يرتبط هذا مباشرةً بقصة التحوّل التي أشرتُ إليها الأسبوع الماضي: يُظهر ملف Intesa للربع الثاني من 13F انتقالًا من التعرّض لـ BTC إلى ETH المُرهَن (staked)، وتشير حركة سعر اليوم لـ BTC/ETH في الاتجاه نفسه.
الجدير بالملاحظة هو ما إذا كان DXY سيحافظ على منطقة الدعم هذه أم سيكسرها إلى الأسفل؛ إذ من المرجّح أن ذلك سيحدّد الخطوة التالية لنِسْبة ETH/BTC أيضًا.#dxy #ETHBTC
كان تويتر كريبتو منشغلًا بـ DXY في الآونة الأخيرة، ومن خلال المخطط يتضح أن هذا الاهتمام في مكانه. ارتفع مؤشر الدولار بقوة من مايو حتى أواخر يوليو، مسجّلًا قمة قرب 101.6 دولار، ثم انعكس بشكل حاد في أوائل أغسطس ليهبط إلى 99.518، والآن يختبر نطاق دعم 99.4–99.6 مباشرة أسفل مستوى 100 دولار النفسي. هذه حركة حقيقية وقابلة للتداول وليست مجرد ضوضاء خلفية.
لنتابعها مقابل ETHBTC خلال الفترة نفسها: فقد تحرّك النِّسْب من 0.0268 في أوائل يوليو إلى قمة بلغت 0.0301، وهو يتداول حاليًا عند 0.02951 في نطاق تَجميع، مع الحفاظ على مستواه فوق متوسطه المتحرك لمدة 20 يومًا الصاعد. ضعف الدولار وتفوّق ETH يظهران في نفس النافذة التي يراقبها متداولو العملات الرقمية عادةً كارتباط عكسي كلاسيكي، ويتجسّد ذلك على أرض الواقع.
يرتبط هذا مباشرةً بقصة التحوّل التي أشرتُ إليها الأسبوع الماضي: يُظهر ملف Intesa للربع الثاني من 13F انتقالًا من التعرّض لـ BTC إلى ETH المُرهَن (staked)، وتشير حركة سعر اليوم لـ BTC/ETH في الاتجاه نفسه.
الجدير بالملاحظة هو ما إذا كان DXY سيحافظ على منطقة الدعم هذه أم سيكسرها إلى الأسفل؛ إذ من المرجّح أن ذلك سيحدّد الخطوة التالية لنِسْبة ETH/BTC أيضًا.#dxy #ETHBTC
2
115
·
--
صاعد
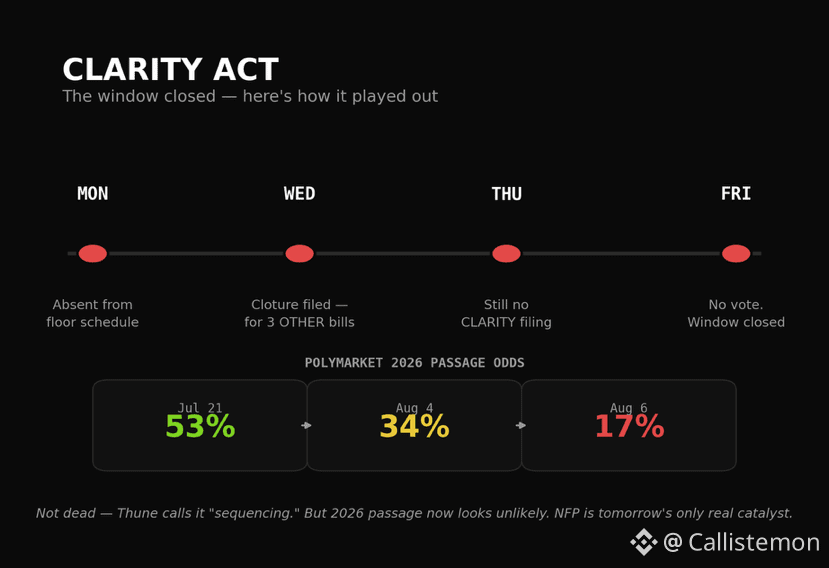
📉 الوضوح لم يلتزم بموعده—إليك ما حدث فعليًا
العدّ التنازلي الذي كنا نتابعه طوال الأسبوع انتهى، لكن ليس بالطريقة التي كان يتوقعها أي أحد. زعيم أغلبية مجلس الشيوخ ثون قدم يوم الأربعاء طلبات إغلاق (cloture) لثلاثة مشاريع قوانين أخرى: قانون حماية رياضة الجامعات، وأداة لتمويل الحكومة، وترشيح وزير العدل. الوضوح (CLARITY) لم يكن ضمن تلك القائمة. ولم تكن جدول يوم الخميس يتضمنه أيضًا.
السوق يعيد التسعير بسرعة بالفعل. انخفضت احتمالات Polymarket لتمريره في 2026 من 53% (21 يوليو) إلى 34% ثم إلى 17% الآن. كما تراجعت متابعة عقود Kalshi لتمريره قبل يوليو 2027 إلى 41%.
يقول ثون إنه ليس “ميتًا”—“نحن نُسلسله” (we're sequencing it)، وما زالت السناتور لوميس تدفع لإجراء تصويت قبل الإجازة (recess). لكن مع قيام مجلس الشيوخ بإعطاء الأولوية لتشريعات أخرى، ومع بقاء جوهر الخلافات (قيود الأخلاقيات، مكافآت العملات المستقرة، وأحكام التمويل غير المشروع) دون حسم، تبدو إمكانية إجراء تصويت في 2026 غير مرجحة بشكل متزايد.
ما الذي يعنيه ذلك ونحن نتجه إلى الغد: أصبح الوضوح (CLARITY) خارج الطرح كمحفّز قريب. وبدلا من ذلك، صار تقرير فرص/وظائف القطاع غير الزراعي NFP هو الحدث الرئيسي الوحيد لهذا الأسبوع، محمّلًا وزنًا أكبر حتى مما كان عليه بالفعل.
هل توقعت هذه النتيجة، أم كنت ما تزال تأمل حتى يوم الجمعة؟ 👇#CLARTYACT
📉 الوضوح لم يلتزم بموعده—إليك ما حدث فعليًا
العدّ التنازلي الذي كنا نتابعه طوال الأسبوع انتهى، لكن ليس بالطريقة التي كان يتوقعها أي أحد. زعيم أغلبية مجلس الشيوخ ثون قدم يوم الأربعاء طلبات إغلاق (cloture) لثلاثة مشاريع قوانين أخرى: قانون حماية رياضة الجامعات، وأداة لتمويل الحكومة، وترشيح وزير العدل. الوضوح (CLARITY) لم يكن ضمن تلك القائمة. ولم تكن جدول يوم الخميس يتضمنه أيضًا.
السوق يعيد التسعير بسرعة بالفعل. انخفضت احتمالات Polymarket لتمريره في 2026 من 53% (21 يوليو) إلى 34% ثم إلى 17% الآن. كما تراجعت متابعة عقود Kalshi لتمريره قبل يوليو 2027 إلى 41%.
يقول ثون إنه ليس “ميتًا”—“نحن نُسلسله” (we're sequencing it)، وما زالت السناتور لوميس تدفع لإجراء تصويت قبل الإجازة (recess). لكن مع قيام مجلس الشيوخ بإعطاء الأولوية لتشريعات أخرى، ومع بقاء جوهر الخلافات (قيود الأخلاقيات، مكافآت العملات المستقرة، وأحكام التمويل غير المشروع) دون حسم، تبدو إمكانية إجراء تصويت في 2026 غير مرجحة بشكل متزايد.
ما الذي يعنيه ذلك ونحن نتجه إلى الغد: أصبح الوضوح (CLARITY) خارج الطرح كمحفّز قريب. وبدلا من ذلك، صار تقرير فرص/وظائف القطاع غير الزراعي NFP هو الحدث الرئيسي الوحيد لهذا الأسبوع، محمّلًا وزنًا أكبر حتى مما كان عليه بالفعل.
هل توقعت هذه النتيجة، أم كنت ما تزال تأمل حتى يوم الجمعة؟ 👇#CLARTYACT
العدّ التنازلي الذي كنا نتابعه طوال الأسبوع انتهى، لكن ليس بالطريقة التي كان يتوقعها أي أحد. زعيم أغلبية مجلس الشيوخ ثون قدم يوم الأربعاء طلبات إغلاق (cloture) لثلاثة مشاريع قوانين أخرى: قانون حماية رياضة الجامعات، وأداة لتمويل الحكومة، وترشيح وزير العدل. الوضوح (CLARITY) لم يكن ضمن تلك القائمة. ولم تكن جدول يوم الخميس يتضمنه أيضًا.
السوق يعيد التسعير بسرعة بالفعل. انخفضت احتمالات Polymarket لتمريره في 2026 من 53% (21 يوليو) إلى 34% ثم إلى 17% الآن. كما تراجعت متابعة عقود Kalshi لتمريره قبل يوليو 2027 إلى 41%.
يقول ثون إنه ليس “ميتًا”—“نحن نُسلسله” (we're sequencing it)، وما زالت السناتور لوميس تدفع لإجراء تصويت قبل الإجازة (recess). لكن مع قيام مجلس الشيوخ بإعطاء الأولوية لتشريعات أخرى، ومع بقاء جوهر الخلافات (قيود الأخلاقيات، مكافآت العملات المستقرة، وأحكام التمويل غير المشروع) دون حسم، تبدو إمكانية إجراء تصويت في 2026 غير مرجحة بشكل متزايد.
ما الذي يعنيه ذلك ونحن نتجه إلى الغد: أصبح الوضوح (CLARITY) خارج الطرح كمحفّز قريب. وبدلا من ذلك، صار تقرير فرص/وظائف القطاع غير الزراعي NFP هو الحدث الرئيسي الوحيد لهذا الأسبوع، محمّلًا وزنًا أكبر حتى مما كان عليه بالفعل.
هل توقعت هذه النتيجة، أم كنت ما تزال تأمل حتى يوم الجمعة؟ 👇#CLARTYACT
1
220
·
--
صاعد
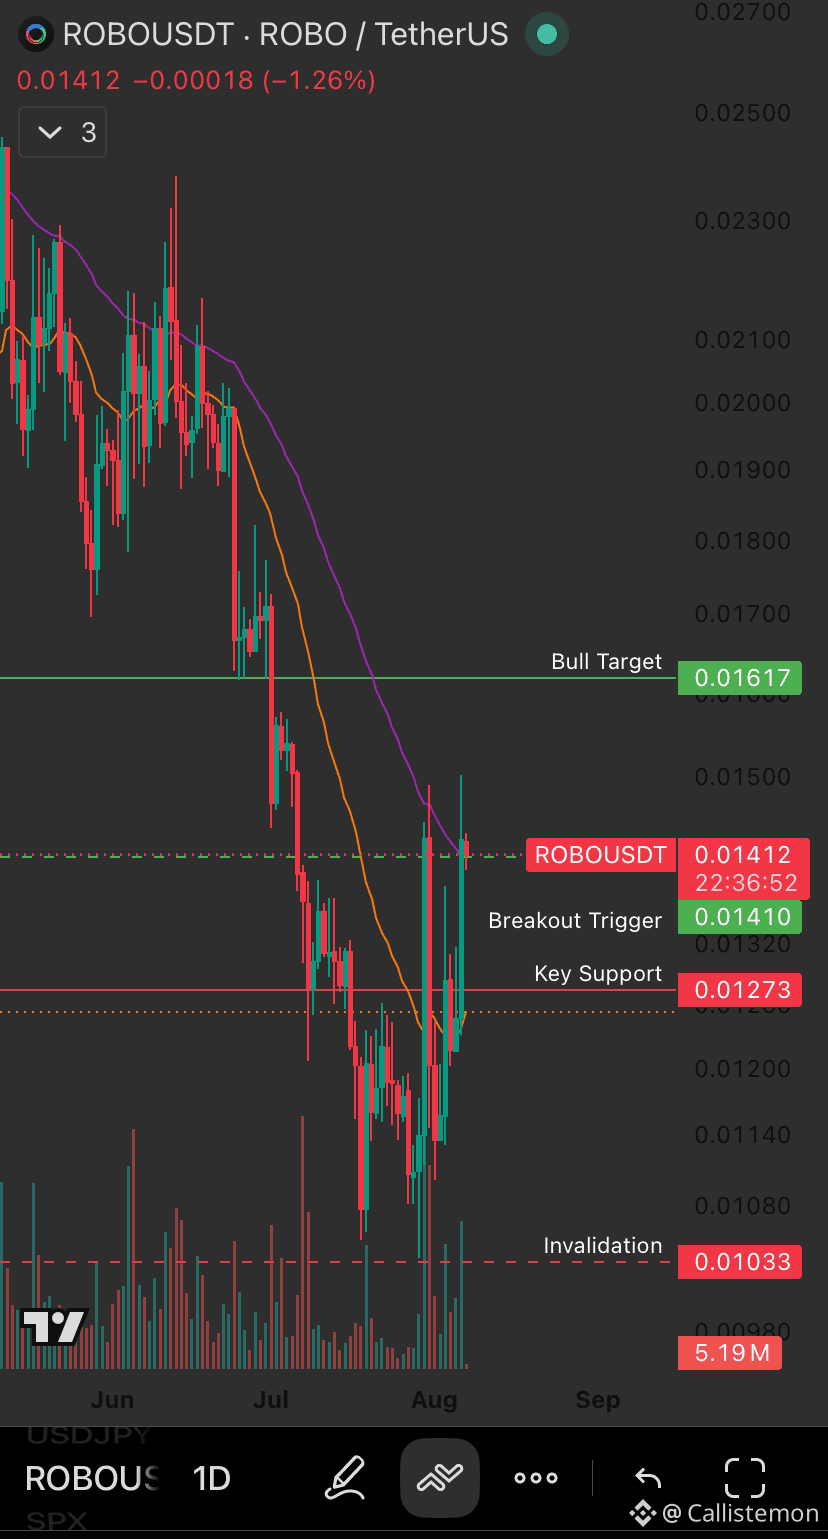
📊 $ROBO الإعداد: الجلوس بشكل صحيح على الزناد
ROBO هبط بقوة من 0.02372 دولار إلى 0.01033 دولار، بانخفاض يقارب 56% قبل أن يبدأ تعافٍ حاد مع ارتفاع حجم التداول. في الوقت الحالي، السعر (0.01412 دولار) يتداول تقريبًا تمامًا عند مستوى Breakout Trigger (0.01410 دولار)، والذي يتوافق أيضًا مع متوسط EMA لخمسة وخمسين يومًا. هذا ليس إعدادًا لـ"الانتظار والمراقبة" بل هو نقطة قرار حية.
المستويات:
🟢 Breakout Trigger: 0.01410 عند الثبات فوقه مع حجم تداول يفتح مسارًا نحو Bull Target عند 0.01617
🔴 الدعم الرئيسي: 0.01273 فقدانه قد يؤدي إلى إعادة اختبار منطقة الإلغاء/Invalidation عند 0.01033
RSI عند 56، محايد إلى قوي — لا توجد إشارة تحذير من تشبع شراء، لكن لا توجد أيضًا إشارة ارتداد من تشبع بيع. هذا في المنتصف تمامًا، لذا فإن الشموع القليلة القادمة مهمة فعلًا.
السهم صغير القيمة/Small-cap وضعف السيولة، فحجم التداول وفقًا لذلك. لكن الإعداد نفسه نظيف جدًا: السعر يختبر مستوى محوري في الوقت الفعلي، وإلغاء واضح أسفل ذلك.
Nfa,Dyor $ROBO
إلى أي اتجاه سيتحرك؟ 👇
{future}(ROBOUSDT)
📊 $ROBO الإعداد: الجلوس بشكل صحيح على الزناد
ROBO هبط بقوة من 0.02372 دولار إلى 0.01033 دولار، بانخفاض يقارب 56% قبل أن يبدأ تعافٍ حاد مع ارتفاع حجم التداول. في الوقت الحالي، السعر (0.01412 دولار) يتداول تقريبًا تمامًا عند مستوى Breakout Trigger (0.01410 دولار)، والذي يتوافق أيضًا مع متوسط EMA لخمسة وخمسين يومًا. هذا ليس إعدادًا لـ"الانتظار والمراقبة" بل هو نقطة قرار حية.
المستويات:
🟢 Breakout Trigger: 0.01410 عند الثبات فوقه مع حجم تداول يفتح مسارًا نحو Bull Target عند 0.01617
🔴 الدعم الرئيسي: 0.01273 فقدانه قد يؤدي إلى إعادة اختبار منطقة الإلغاء/Invalidation عند 0.01033
RSI عند 56، محايد إلى قوي — لا توجد إشارة تحذير من تشبع شراء، لكن لا توجد أيضًا إشارة ارتداد من تشبع بيع. هذا في المنتصف تمامًا، لذا فإن الشموع القليلة القادمة مهمة فعلًا.
السهم صغير القيمة/Small-cap وضعف السيولة، فحجم التداول وفقًا لذلك. لكن الإعداد نفسه نظيف جدًا: السعر يختبر مستوى محوري في الوقت الفعلي، وإلغاء واضح أسفل ذلك.
Nfa,Dyor $ROBO
إلى أي اتجاه سيتحرك؟ 👇
ROBO هبط بقوة من 0.02372 دولار إلى 0.01033 دولار، بانخفاض يقارب 56% قبل أن يبدأ تعافٍ حاد مع ارتفاع حجم التداول. في الوقت الحالي، السعر (0.01412 دولار) يتداول تقريبًا تمامًا عند مستوى Breakout Trigger (0.01410 دولار)، والذي يتوافق أيضًا مع متوسط EMA لخمسة وخمسين يومًا. هذا ليس إعدادًا لـ"الانتظار والمراقبة" بل هو نقطة قرار حية.
المستويات:
🟢 Breakout Trigger: 0.01410 عند الثبات فوقه مع حجم تداول يفتح مسارًا نحو Bull Target عند 0.01617
🔴 الدعم الرئيسي: 0.01273 فقدانه قد يؤدي إلى إعادة اختبار منطقة الإلغاء/Invalidation عند 0.01033
RSI عند 56، محايد إلى قوي — لا توجد إشارة تحذير من تشبع شراء، لكن لا توجد أيضًا إشارة ارتداد من تشبع بيع. هذا في المنتصف تمامًا، لذا فإن الشموع القليلة القادمة مهمة فعلًا.
السهم صغير القيمة/Small-cap وضعف السيولة، فحجم التداول وفقًا لذلك. لكن الإعداد نفسه نظيف جدًا: السعر يختبر مستوى محوري في الوقت الفعلي، وإلغاء واضح أسفل ذلك.
Nfa,Dyor $ROBO
إلى أي اتجاه سيتحرك؟ 👇
133
·
--
صاعد
تمّ التحقق
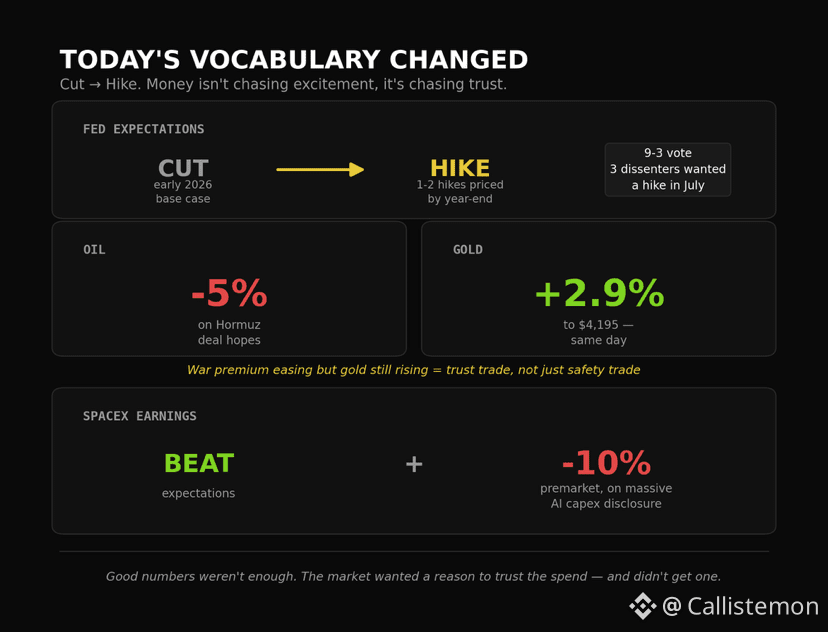
📊 اليوم تغيّر مفردات السوق: من Cut إلى Hike
قبل ستة أشهر، كانت كل محادثات الاحتياطي الفيدرالي تدور حول موعد انخفاض الفائدة. اليوم، انقلب الحديث. اجتماع لجنة السوق المفتوحة (FOMC) في يوليو ثبّت الفائدة عند 3.50-3.75%، لكن ثلاثة أعضاء—هاماك وكاشكاري ولوجان—عارضوا لصالح زيادة فورية. أعادت الأسواق تسعير الاحتمالات بقوة: من تخفيضات إلى توقعات بزيادة واحدة أو اثنتين حتى نهاية العام.
هذا التحول أهم من العناوين الحالية اليوم عن هرمز وSpaceX، رغم أن هذه هي التي تحظى بالاهتمام:
النفط/الذهب: قال ترامب إن اتفاقًا لإعادة فتح هرمز قد يهبط اليوم. انخفض النفط على الخبر، كما كان متوقعًا. لكن الذهب لم يتبعه؛ بل قفز فوق 4,195 دولارًا، مرتفعًا بنحو 3%. هذه هي النقطة المثيرة. إذا كان علاوة الحرب تتراجع فعلاً، كان يجب أن يهدأ الذهب معها. لم يحدث ذلك. هذا يخبرك أن الأمر لم يعد مجرد صفقة “أمان” فقط—بل باتت صفقة “ثقة”، والثقة بما سيحدث لاحقًا مع الفائدة والدولار والعوائد الحقيقية أصبحت أضعف مما توحي به عناوين هرمز.
SpaceX: حقق نتائج أفضل، ثم انخفض أكثر من 10% قبل افتتاح السوق بعد إفصاح ضخم عن إنفاق رأسمالي للذكاء الاصطناعي. لم تكن الأرقام الجيدة كافية؛ كان السوق يريد قصة تبرر هذا الإنفاق، ولم يحصل على قصة أعجبته.
والخلاصة: المال الآن لا يبدو أنه يبحث عن الإثارة. إنه يبحث عن الثقة. الذهب يربح هذه الصفقة—ممل وآمن وموثوق تاريخيًا—ويستحوذ على رأس مال ربما كان سيبدو للوجهة الأخرى. كما تحاول الأسهم الفوز أيضًا عبر “بيع القصة”، ورد فعل اليوم تجاه SpaceX يوضح مدى رِقّة هامش الخطأ.
لكي يجذب قطاع العملات الرقمية رأس مالًا جديدًا حقيقيًا في هذا السياق، غالبًا لم يعد “السرد اللامع” وحده كافيًا. يحتاج إلى شيء يبني الثقة على مستوى مؤسسي: وضوح تنظيمي، وإيرادات حقيقية، وضمانات حفظ حقيقية
لا مجرد سبب جديد للإثارة.
من أين برأيك يأتي “لحظة بناء الثقة” للعملات المشفرة؟ 👇
📊 اليوم تغيّر مفردات السوق: من Cut إلى Hike
قبل ستة أشهر، كانت كل محادثات الاحتياطي الفيدرالي تدور حول موعد انخفاض الفائدة. اليوم، انقلب الحديث. اجتماع لجنة السوق المفتوحة (FOMC) في يوليو ثبّت الفائدة عند 3.50-3.75%، لكن ثلاثة أعضاء—هاماك وكاشكاري ولوجان—عارضوا لصالح زيادة فورية. أعادت الأسواق تسعير الاحتمالات بقوة: من تخفيضات إلى توقعات بزيادة واحدة أو اثنتين حتى نهاية العام.
هذا التحول أهم من العناوين الحالية اليوم عن هرمز وSpaceX، رغم أن هذه هي التي تحظى بالاهتمام:
النفط/الذهب: قال ترامب إن اتفاقًا لإعادة فتح هرمز قد يهبط اليوم. انخفض النفط على الخبر، كما كان متوقعًا. لكن الذهب لم يتبعه؛ بل قفز فوق 4,195 دولارًا، مرتفعًا بنحو 3%. هذه هي النقطة المثيرة. إذا كان علاوة الحرب تتراجع فعلاً، كان يجب أن يهدأ الذهب معها. لم يحدث ذلك. هذا يخبرك أن الأمر لم يعد مجرد صفقة “أمان” فقط—بل باتت صفقة “ثقة”، والثقة بما سيحدث لاحقًا مع الفائدة والدولار والعوائد الحقيقية أصبحت أضعف مما توحي به عناوين هرمز.
SpaceX: حقق نتائج أفضل، ثم انخفض أكثر من 10% قبل افتتاح السوق بعد إفصاح ضخم عن إنفاق رأسمالي للذكاء الاصطناعي. لم تكن الأرقام الجيدة كافية؛ كان السوق يريد قصة تبرر هذا الإنفاق، ولم يحصل على قصة أعجبته.
والخلاصة: المال الآن لا يبدو أنه يبحث عن الإثارة. إنه يبحث عن الثقة. الذهب يربح هذه الصفقة—ممل وآمن وموثوق تاريخيًا—ويستحوذ على رأس مال ربما كان سيبدو للوجهة الأخرى. كما تحاول الأسهم الفوز أيضًا عبر “بيع القصة”، ورد فعل اليوم تجاه SpaceX يوضح مدى رِقّة هامش الخطأ.
لكي يجذب قطاع العملات الرقمية رأس مالًا جديدًا حقيقيًا في هذا السياق، غالبًا لم يعد “السرد اللامع” وحده كافيًا. يحتاج إلى شيء يبني الثقة على مستوى مؤسسي: وضوح تنظيمي، وإيرادات حقيقية، وضمانات حفظ حقيقية
لا مجرد سبب جديد للإثارة.
من أين برأيك يأتي “لحظة بناء الثقة” للعملات المشفرة؟ 👇
قبل ستة أشهر، كانت كل محادثات الاحتياطي الفيدرالي تدور حول موعد انخفاض الفائدة. اليوم، انقلب الحديث. اجتماع لجنة السوق المفتوحة (FOMC) في يوليو ثبّت الفائدة عند 3.50-3.75%، لكن ثلاثة أعضاء—هاماك وكاشكاري ولوجان—عارضوا لصالح زيادة فورية. أعادت الأسواق تسعير الاحتمالات بقوة: من تخفيضات إلى توقعات بزيادة واحدة أو اثنتين حتى نهاية العام.
هذا التحول أهم من العناوين الحالية اليوم عن هرمز وSpaceX، رغم أن هذه هي التي تحظى بالاهتمام:
النفط/الذهب: قال ترامب إن اتفاقًا لإعادة فتح هرمز قد يهبط اليوم. انخفض النفط على الخبر، كما كان متوقعًا. لكن الذهب لم يتبعه؛ بل قفز فوق 4,195 دولارًا، مرتفعًا بنحو 3%. هذه هي النقطة المثيرة. إذا كان علاوة الحرب تتراجع فعلاً، كان يجب أن يهدأ الذهب معها. لم يحدث ذلك. هذا يخبرك أن الأمر لم يعد مجرد صفقة “أمان” فقط—بل باتت صفقة “ثقة”، والثقة بما سيحدث لاحقًا مع الفائدة والدولار والعوائد الحقيقية أصبحت أضعف مما توحي به عناوين هرمز.
SpaceX: حقق نتائج أفضل، ثم انخفض أكثر من 10% قبل افتتاح السوق بعد إفصاح ضخم عن إنفاق رأسمالي للذكاء الاصطناعي. لم تكن الأرقام الجيدة كافية؛ كان السوق يريد قصة تبرر هذا الإنفاق، ولم يحصل على قصة أعجبته.
والخلاصة: المال الآن لا يبدو أنه يبحث عن الإثارة. إنه يبحث عن الثقة. الذهب يربح هذه الصفقة—ممل وآمن وموثوق تاريخيًا—ويستحوذ على رأس مال ربما كان سيبدو للوجهة الأخرى. كما تحاول الأسهم الفوز أيضًا عبر “بيع القصة”، ورد فعل اليوم تجاه SpaceX يوضح مدى رِقّة هامش الخطأ.
لكي يجذب قطاع العملات الرقمية رأس مالًا جديدًا حقيقيًا في هذا السياق، غالبًا لم يعد “السرد اللامع” وحده كافيًا. يحتاج إلى شيء يبني الثقة على مستوى مؤسسي: وضوح تنظيمي، وإيرادات حقيقية، وضمانات حفظ حقيقية
لا مجرد سبب جديد للإثارة.
من أين برأيك يأتي “لحظة بناء الثقة” للعملات المشفرة؟ 👇
640
·
--
صاعد
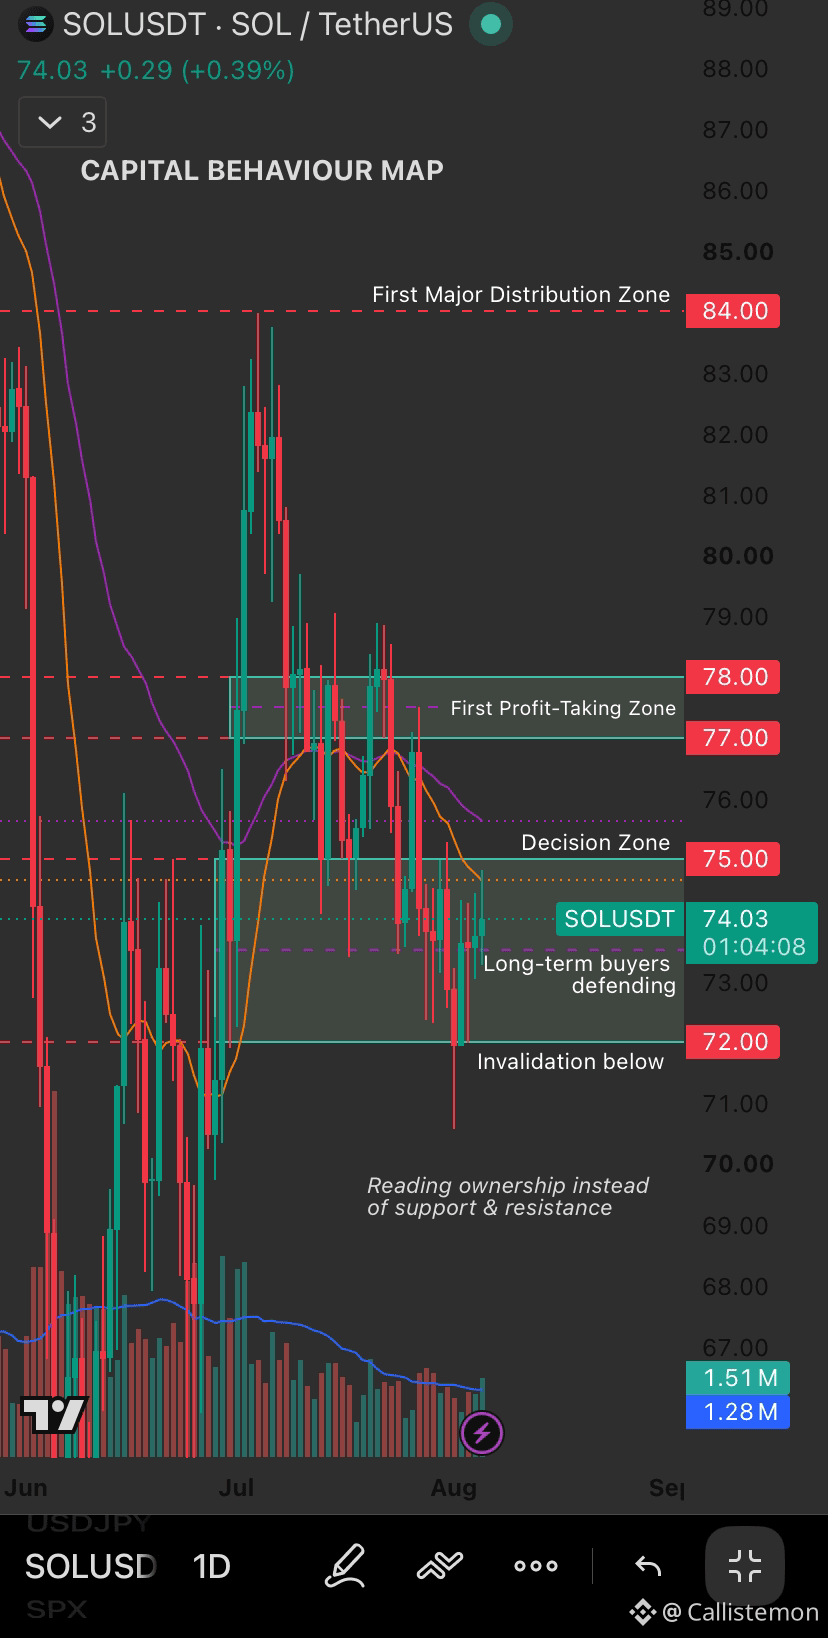
$SOL SOL خريطة سلوك رأس المال
بدلًا من أن أسأل:
"أين توجد المقاومة؟"
أسأل:
من يملك السوق عند كل سعر؟
البنية الحالية:
• 72$ → مشترون على المدى الطويل يدافعون.
• 75$ → منطقة القرار.
• 77–78$ → أول منطقة جني أرباح.
• 84$ → أول منطقة توزيع رئيسية.
مسار صاعد
الاحتفاظ فوق 72$ يبقي البنية الحالية كما هي.
استعادة 75$ قد تفتح الطريق نحو 77–78$، حيث قد يظهر أول ضغط بيع ذي معنى.
إذا ظل الزخم قويًا، تصبح 84$ المنطقة التالية للتوزيع الرئيسي.
مسار هابط
فقد حاسم لـ 72$ يُبطل هذه البنية ويشير إلى أن المشترين يفقدون السيطرة.
الدعم والمقاومة يخبرانك أين قد يتفاعل السعر.
الملكية تخبرك لماذا. NFA ,DYOR
{future}(SOLUSDT)
يتحرك السعر لأن الملكية تتغير.
$SOL SOL خريطة سلوك رأس المال
بدلًا من أن أسأل:
"أين توجد المقاومة؟"
أسأل:
من يملك السوق عند كل سعر؟
البنية الحالية:
• 72$ → مشترون على المدى الطويل يدافعون.
• 75$ → منطقة القرار.
• 77–78$ → أول منطقة جني أرباح.
• 84$ → أول منطقة توزيع رئيسية.
مسار صاعد
الاحتفاظ فوق 72$ يبقي البنية الحالية كما هي.
استعادة 75$ قد تفتح الطريق نحو 77–78$، حيث قد يظهر أول ضغط بيع ذي معنى.
إذا ظل الزخم قويًا، تصبح 84$ المنطقة التالية للتوزيع الرئيسي.
مسار هابط
فقد حاسم لـ 72$ يُبطل هذه البنية ويشير إلى أن المشترين يفقدون السيطرة.
الدعم والمقاومة يخبرانك أين قد يتفاعل السعر.
الملكية تخبرك لماذا. NFA ,DYOR
يتحرك السعر لأن الملكية تتغير.
بدلًا من أن أسأل:
"أين توجد المقاومة؟"
أسأل:
من يملك السوق عند كل سعر؟
البنية الحالية:
• 72$ → مشترون على المدى الطويل يدافعون.
• 75$ → منطقة القرار.
• 77–78$ → أول منطقة جني أرباح.
• 84$ → أول منطقة توزيع رئيسية.
مسار صاعد
الاحتفاظ فوق 72$ يبقي البنية الحالية كما هي.
استعادة 75$ قد تفتح الطريق نحو 77–78$، حيث قد يظهر أول ضغط بيع ذي معنى.
إذا ظل الزخم قويًا، تصبح 84$ المنطقة التالية للتوزيع الرئيسي.
مسار هابط
فقد حاسم لـ 72$ يُبطل هذه البنية ويشير إلى أن المشترين يفقدون السيطرة.
الدعم والمقاومة يخبرانك أين قد يتفاعل السعر.
الملكية تخبرك لماذا. NFA ,DYOR
يتحرك السعر لأن الملكية تتغير.
79
·
--
صاعد
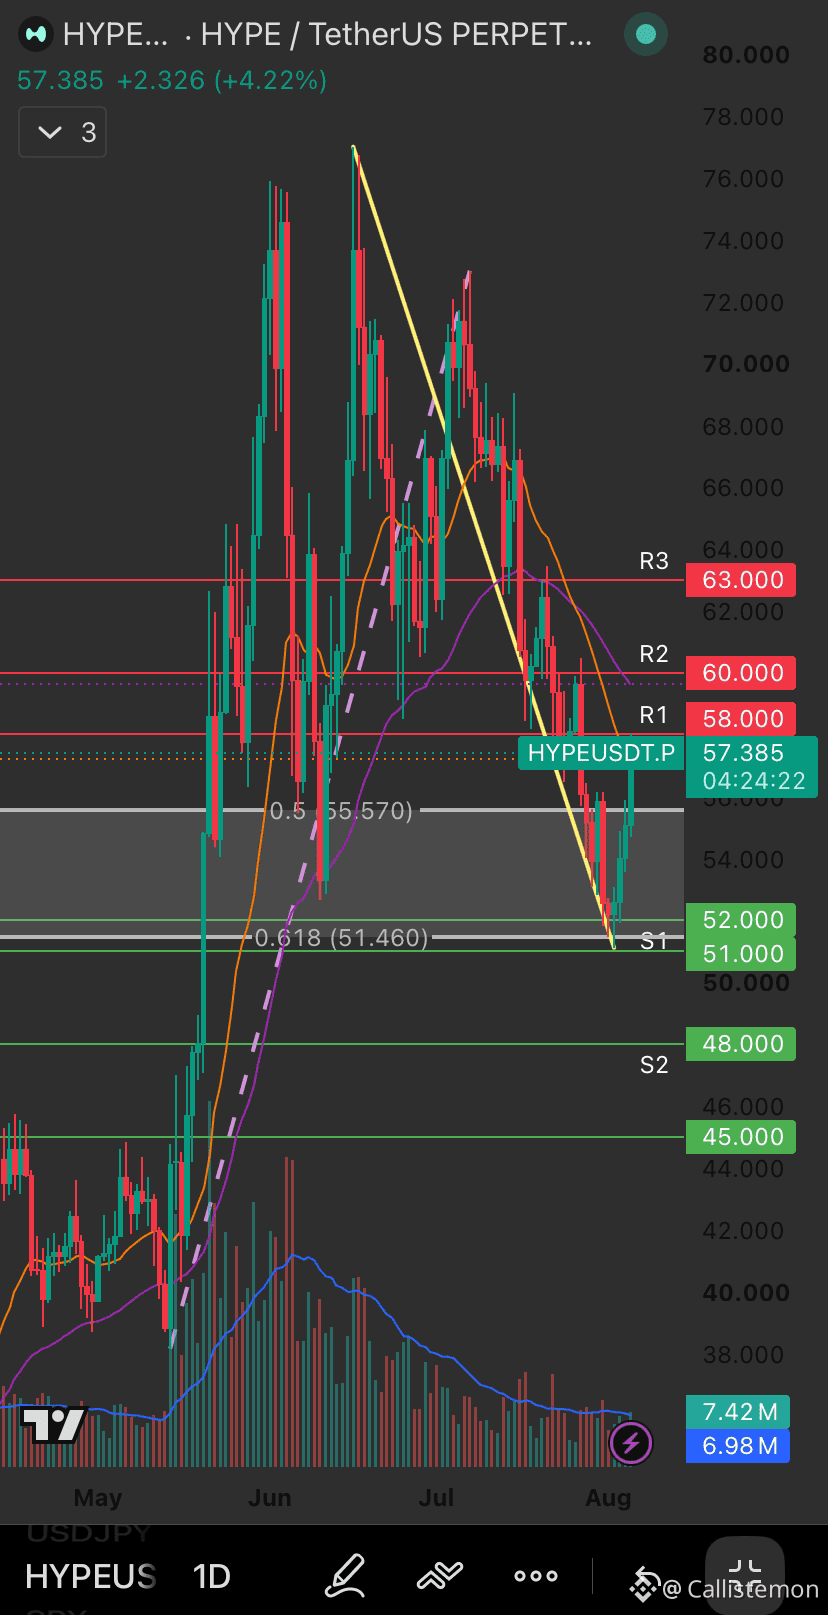
HYPE / USDT تحليل فني يومي
السعر حاليًا يحافظ على مستوى فيبوناتشي 0.5 ($55.57) ويختبر منطقة مقاومة حاسمة.
المستويات الرئيسية:
• المقاومة 1: $58
• المقاومة 2: $60
• المقاومة 3: $63
• دعم قوي (S1): $51 – $52 (فيبوناتشي 0.618)
• الدعم 2: $48
البنية:
• يبقى السعر تحت خط الاتجاه الهابط.
• المتوسط المتحرك 20 EMA و50 EMA يعملان كمقاومة ديناميكية.
• بدأ حجم التداول بالارتفاع على الشموع الصاعدة الأخيرة بعد التعافي.
السيناريوهات: السيناريو الصاعد → الإغلاق اليومي فوق $58 مع تأكيد بالحجم يفتح الطريق نحو $60 و$63.
السيناريو الهابط → فقدان دعم $55.57 يغيّر التركيز إلى منطقة $51–$52.
التحرك الحاسم القادم من المرجح أن يأتي من ارتداد واضح عند مستوى $58.
ليس نصيحة استثمارية، قم بأبحاثك بنفسك.
#hype #Hyperliquid #TechnicalAnalysis #crypto
HYPE / USDT تحليل فني يومي
السعر حاليًا يحافظ على مستوى فيبوناتشي 0.5 ($55.57) ويختبر منطقة مقاومة حاسمة.
المستويات الرئيسية:
• المقاومة 1: $58
• المقاومة 2: $60
• المقاومة 3: $63
• دعم قوي (S1): $51 – $52 (فيبوناتشي 0.618)
• الدعم 2: $48
البنية:
• يبقى السعر تحت خط الاتجاه الهابط.
• المتوسط المتحرك 20 EMA و50 EMA يعملان كمقاومة ديناميكية.
• بدأ حجم التداول بالارتفاع على الشموع الصاعدة الأخيرة بعد التعافي.
السيناريوهات: السيناريو الصاعد → الإغلاق اليومي فوق $58 مع تأكيد بالحجم يفتح الطريق نحو $60 و$63.
السيناريو الهابط → فقدان دعم $55.57 يغيّر التركيز إلى منطقة $51–$52.
التحرك الحاسم القادم من المرجح أن يأتي من ارتداد واضح عند مستوى $58.
ليس نصيحة استثمارية، قم بأبحاثك بنفسك.
#hype #Hyperliquid #TechnicalAnalysis #crypto
السعر حاليًا يحافظ على مستوى فيبوناتشي 0.5 ($55.57) ويختبر منطقة مقاومة حاسمة.
المستويات الرئيسية:
• المقاومة 1: $58
• المقاومة 2: $60
• المقاومة 3: $63
• دعم قوي (S1): $51 – $52 (فيبوناتشي 0.618)
• الدعم 2: $48
البنية:
• يبقى السعر تحت خط الاتجاه الهابط.
• المتوسط المتحرك 20 EMA و50 EMA يعملان كمقاومة ديناميكية.
• بدأ حجم التداول بالارتفاع على الشموع الصاعدة الأخيرة بعد التعافي.
السيناريوهات: السيناريو الصاعد → الإغلاق اليومي فوق $58 مع تأكيد بالحجم يفتح الطريق نحو $60 و$63.
السيناريو الهابط → فقدان دعم $55.57 يغيّر التركيز إلى منطقة $51–$52.
التحرك الحاسم القادم من المرجح أن يأتي من ارتداد واضح عند مستوى $58.
ليس نصيحة استثمارية، قم بأبحاثك بنفسك.
#hype #Hyperliquid #TechnicalAnalysis #crypto
129
·
--
صاعد
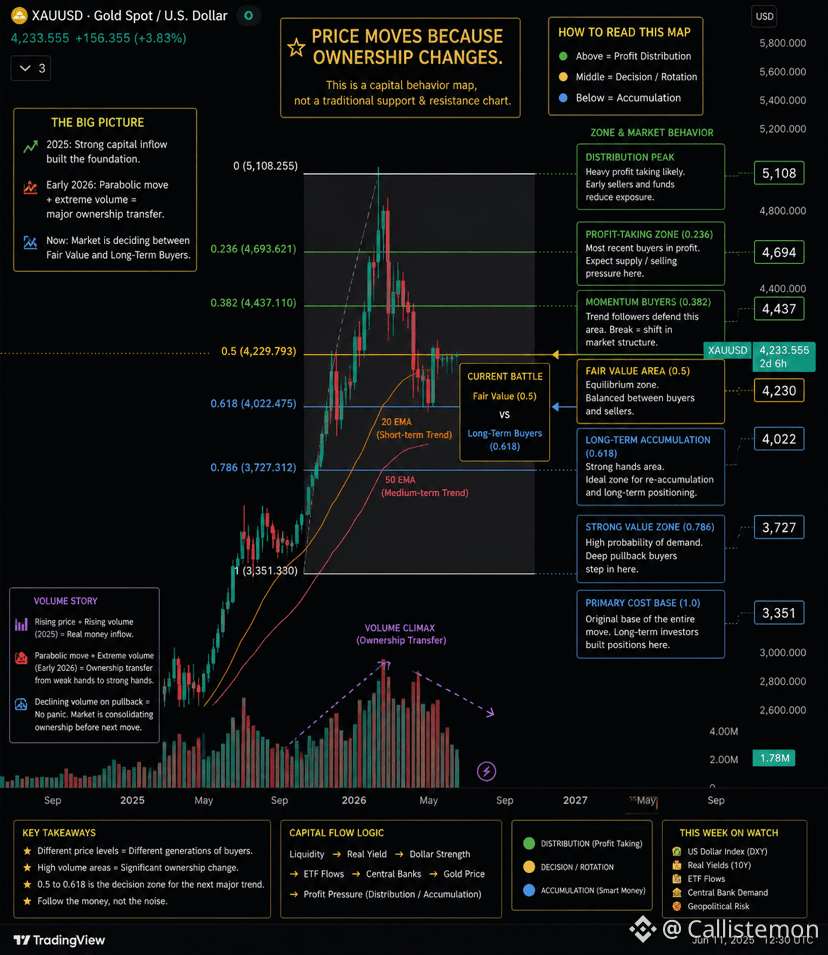
الذهب من خلال عدسة دوران رأس المال
بدلاً من السؤال: "أين يوجد الدعم؟"، أفضّل أن أسأل:
"ما هي المجموعات المختلفة من المستثمرين التي يُرجّح أن تتصرف؟"
باستخدام البنية طويلة الأجل، وتصحيحات فيبوناتشي، وتحليل الاتجاه، قسّمت السوق إلى مناطق سلوكية بدل الاكتفاء بمستويات سعرية بسيطة.
بنية السوق الحالية
$5,108 → قمة التوزيع
$4,694 → منطقة جني الأرباح
$4,437 → المشترون بدافع الزخم
$4,230 → القيمة العادلة (منطقة القرار الحالية)
$4,022 → المشترون على المدى الطويل
$3,727 → منطقة قيمة قوية
$3,351 → متوسط التكلفة الأصلي
سيناريوهان
صعودي
الاحتفاظ فوق $4,230
الاختراق فوق $4,437
يستهدف الزخم القمة السابقة قرب $5,108.
هبوطي
فقدان $4,022
يدور رأس المال باتجاه منطقة التراكم بين $3,727 و$3,351.
الهدف ليس التنبؤ بكل حركة.
بل فهم كيفية دوران رأس المال بين المشاركين، وأين قد يحدث التحول التالي ذي المعنى في الملكية.
هذا إطار للنقاش وليس نصيحة استثمارية.$XAU
{future}(XAUUSDT)
الذهب من خلال عدسة دوران رأس المال
بدلاً من السؤال: "أين يوجد الدعم؟"، أفضّل أن أسأل:
"ما هي المجموعات المختلفة من المستثمرين التي يُرجّح أن تتصرف؟"
باستخدام البنية طويلة الأجل، وتصحيحات فيبوناتشي، وتحليل الاتجاه، قسّمت السوق إلى مناطق سلوكية بدل الاكتفاء بمستويات سعرية بسيطة.
بنية السوق الحالية
$5,108 → قمة التوزيع
$4,694 → منطقة جني الأرباح
$4,437 → المشترون بدافع الزخم
$4,230 → القيمة العادلة (منطقة القرار الحالية)
$4,022 → المشترون على المدى الطويل
$3,727 → منطقة قيمة قوية
$3,351 → متوسط التكلفة الأصلي
سيناريوهان
صعودي
الاحتفاظ فوق $4,230
الاختراق فوق $4,437
يستهدف الزخم القمة السابقة قرب $5,108.
هبوطي
فقدان $4,022
يدور رأس المال باتجاه منطقة التراكم بين $3,727 و$3,351.
الهدف ليس التنبؤ بكل حركة.
بل فهم كيفية دوران رأس المال بين المشاركين، وأين قد يحدث التحول التالي ذي المعنى في الملكية.
هذا إطار للنقاش وليس نصيحة استثمارية.$XAU
بدلاً من السؤال: "أين يوجد الدعم؟"، أفضّل أن أسأل:
"ما هي المجموعات المختلفة من المستثمرين التي يُرجّح أن تتصرف؟"
باستخدام البنية طويلة الأجل، وتصحيحات فيبوناتشي، وتحليل الاتجاه، قسّمت السوق إلى مناطق سلوكية بدل الاكتفاء بمستويات سعرية بسيطة.
بنية السوق الحالية
$5,108 → قمة التوزيع
$4,694 → منطقة جني الأرباح
$4,437 → المشترون بدافع الزخم
$4,230 → القيمة العادلة (منطقة القرار الحالية)
$4,022 → المشترون على المدى الطويل
$3,727 → منطقة قيمة قوية
$3,351 → متوسط التكلفة الأصلي
سيناريوهان
صعودي
الاحتفاظ فوق $4,230
الاختراق فوق $4,437
يستهدف الزخم القمة السابقة قرب $5,108.
هبوطي
فقدان $4,022
يدور رأس المال باتجاه منطقة التراكم بين $3,727 و$3,351.
الهدف ليس التنبؤ بكل حركة.
بل فهم كيفية دوران رأس المال بين المشاركين، وأين قد يحدث التحول التالي ذي المعنى في الملكية.
هذا إطار للنقاش وليس نصيحة استثمارية.$XAU
1
179
·
--
صاعد
📊 يوم آخر مع ترامب. لكن هل يحرّك العملات الرقمية فعلًا؟
"سوق الأسهم يضع سجّلًا بعد سجل لأن المستثمرين يعرفون أن أمريكا تنتصر. هذه هي العصر الذهبي لأمريكا."
عبارات مثل هذه تظهر كل بضعة أسابيع، والغريزة دائمًا هي نفسها: الاستعداد لتفاعل ما. لذلك تحققنا مما إذا كانت هذه الغريزة تنطبق فعلًا.
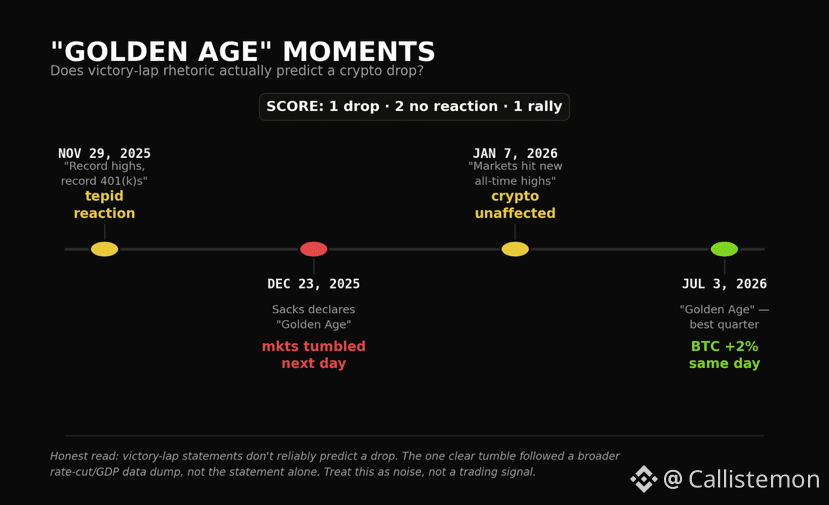
آخر أربع مرات أعلن فيها ترامب بيانًا مماثلًا عن انتصاره في الأسواق:
29 نوفمبر 2025 — "قمم قياسية، 401(k) بسجلات قياسية" → تفاعل فاتِر
23 ديسمبر 2025 — "تم الإعلان عن العصر الذهبي" بالتزامن مع بيانات قوية للناتج المحلي الإجمالي/خفض الفائدة → هبطت الأسواق في اليوم التالي
7 يناير 2026 — "الأسواق تسجل قممًا جديدة" → لم تتأثر العملات الرقمية
3 يوليو 2026 — "العصر الذهبي" — أفضل ربع → ارتفعت البيتكوين فعلًا 2% في نفس اليوم
النتيجة: 1 انخفاض، 2 دون تفاعل، 1 صعود. هذه ليست نمطًا يمكن التداول عليه — بل هي أقرب إلى الضوضاء. الانخفاض الحقيقي على الأرجح جاء من بيانات الناتج المحلي الإجمالي/خفض الفائدة التي جاءت في اليوم نفسه، وليس من العبارة وحدها.
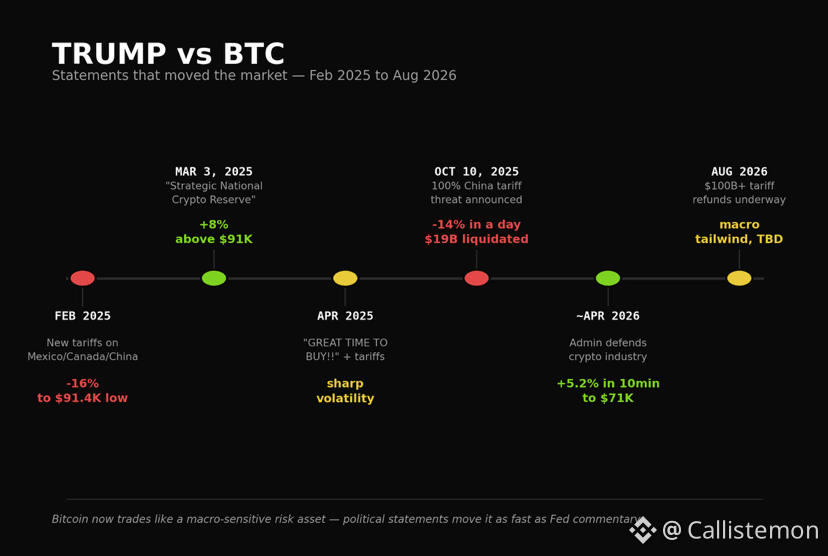
قارن ذلك بتصريحات ترامب الفعلية التي تُحرّك الأسواق: تهديدات الرسوم الجمركية وتحولات السياسات. تُظهر هذه التصريحات تفاعلًا أكثر وضوحًا واتساقًا: -16% على رسوم فبراير 2025، +8% على إعلان "الاحتياطي الاستراتيجي"، -14% في يوم واحد على تهديد الرسوم الجمركية على الصين في أكتوبر، +5.2% خلال 10 دقائق عندما دافعت الإدارة عن صناعة العملات الرقمية.
الدرس: ليس كل عنوان يحمل اسم ترامب يكون محفّزًا. الرسوم الجمركية والتنظيم وتحركات السياسة هي ما يفعل ذلك. احتفالات الانتصار غالبًا ليست كذلك.
المحفزات الحقيقية لهذا الأسبوع تبقى تقارير الوظائف يوم الجمعة، وموعد انتهاء قانون CLARITY — حيث توجد الإشارة الفعلية. #trump
📊 يوم آخر مع ترامب. لكن هل يحرّك العملات الرقمية فعلًا؟
"سوق الأسهم يضع سجّلًا بعد سجل لأن المستثمرين يعرفون أن أمريكا تنتصر. هذه هي العصر الذهبي لأمريكا."
عبارات مثل هذه تظهر كل بضعة أسابيع، والغريزة دائمًا هي نفسها: الاستعداد لتفاعل ما. لذلك تحققنا مما إذا كانت هذه الغريزة تنطبق فعلًا.
آخر أربع مرات أعلن فيها ترامب بيانًا مماثلًا عن انتصاره في الأسواق:
29 نوفمبر 2025 — "قمم قياسية، 401(k) بسجلات قياسية" → تفاعل فاتِر
23 ديسمبر 2025 — "تم الإعلان عن العصر الذهبي" بالتزامن مع بيانات قوية للناتج المحلي الإجمالي/خفض الفائدة → هبطت الأسواق في اليوم التالي
7 يناير 2026 — "الأسواق تسجل قممًا جديدة" → لم تتأثر العملات الرقمية
3 يوليو 2026 — "العصر الذهبي" — أفضل ربع → ارتفعت البيتكوين فعلًا 2% في نفس اليوم
النتيجة: 1 انخفاض، 2 دون تفاعل، 1 صعود. هذه ليست نمطًا يمكن التداول عليه — بل هي أقرب إلى الضوضاء. الانخفاض الحقيقي على الأرجح جاء من بيانات الناتج المحلي الإجمالي/خفض الفائدة التي جاءت في اليوم نفسه، وليس من العبارة وحدها.
قارن ذلك بتصريحات ترامب الفعلية التي تُحرّك الأسواق: تهديدات الرسوم الجمركية وتحولات السياسات. تُظهر هذه التصريحات تفاعلًا أكثر وضوحًا واتساقًا: -16% على رسوم فبراير 2025، +8% على إعلان "الاحتياطي الاستراتيجي"، -14% في يوم واحد على تهديد الرسوم الجمركية على الصين في أكتوبر، +5.2% خلال 10 دقائق عندما دافعت الإدارة عن صناعة العملات الرقمية.
الدرس: ليس كل عنوان يحمل اسم ترامب يكون محفّزًا. الرسوم الجمركية والتنظيم وتحركات السياسة هي ما يفعل ذلك. احتفالات الانتصار غالبًا ليست كذلك.
المحفزات الحقيقية لهذا الأسبوع تبقى تقارير الوظائف يوم الجمعة، وموعد انتهاء قانون CLARITY — حيث توجد الإشارة الفعلية. #trump
"سوق الأسهم يضع سجّلًا بعد سجل لأن المستثمرين يعرفون أن أمريكا تنتصر. هذه هي العصر الذهبي لأمريكا."
عبارات مثل هذه تظهر كل بضعة أسابيع، والغريزة دائمًا هي نفسها: الاستعداد لتفاعل ما. لذلك تحققنا مما إذا كانت هذه الغريزة تنطبق فعلًا.
آخر أربع مرات أعلن فيها ترامب بيانًا مماثلًا عن انتصاره في الأسواق:
29 نوفمبر 2025 — "قمم قياسية، 401(k) بسجلات قياسية" → تفاعل فاتِر
23 ديسمبر 2025 — "تم الإعلان عن العصر الذهبي" بالتزامن مع بيانات قوية للناتج المحلي الإجمالي/خفض الفائدة → هبطت الأسواق في اليوم التالي
7 يناير 2026 — "الأسواق تسجل قممًا جديدة" → لم تتأثر العملات الرقمية
3 يوليو 2026 — "العصر الذهبي" — أفضل ربع → ارتفعت البيتكوين فعلًا 2% في نفس اليوم
النتيجة: 1 انخفاض، 2 دون تفاعل، 1 صعود. هذه ليست نمطًا يمكن التداول عليه — بل هي أقرب إلى الضوضاء. الانخفاض الحقيقي على الأرجح جاء من بيانات الناتج المحلي الإجمالي/خفض الفائدة التي جاءت في اليوم نفسه، وليس من العبارة وحدها.
قارن ذلك بتصريحات ترامب الفعلية التي تُحرّك الأسواق: تهديدات الرسوم الجمركية وتحولات السياسات. تُظهر هذه التصريحات تفاعلًا أكثر وضوحًا واتساقًا: -16% على رسوم فبراير 2025، +8% على إعلان "الاحتياطي الاستراتيجي"، -14% في يوم واحد على تهديد الرسوم الجمركية على الصين في أكتوبر، +5.2% خلال 10 دقائق عندما دافعت الإدارة عن صناعة العملات الرقمية.
الدرس: ليس كل عنوان يحمل اسم ترامب يكون محفّزًا. الرسوم الجمركية والتنظيم وتحركات السياسة هي ما يفعل ذلك. احتفالات الانتصار غالبًا ليست كذلك.
المحفزات الحقيقية لهذا الأسبوع تبقى تقارير الوظائف يوم الجمعة، وموعد انتهاء قانون CLARITY — حيث توجد الإشارة الفعلية. #trump
122
·
--
صاعد
📡 $ASTS الإعداد: حشد تعاطف أم اختراق حقيقي؟
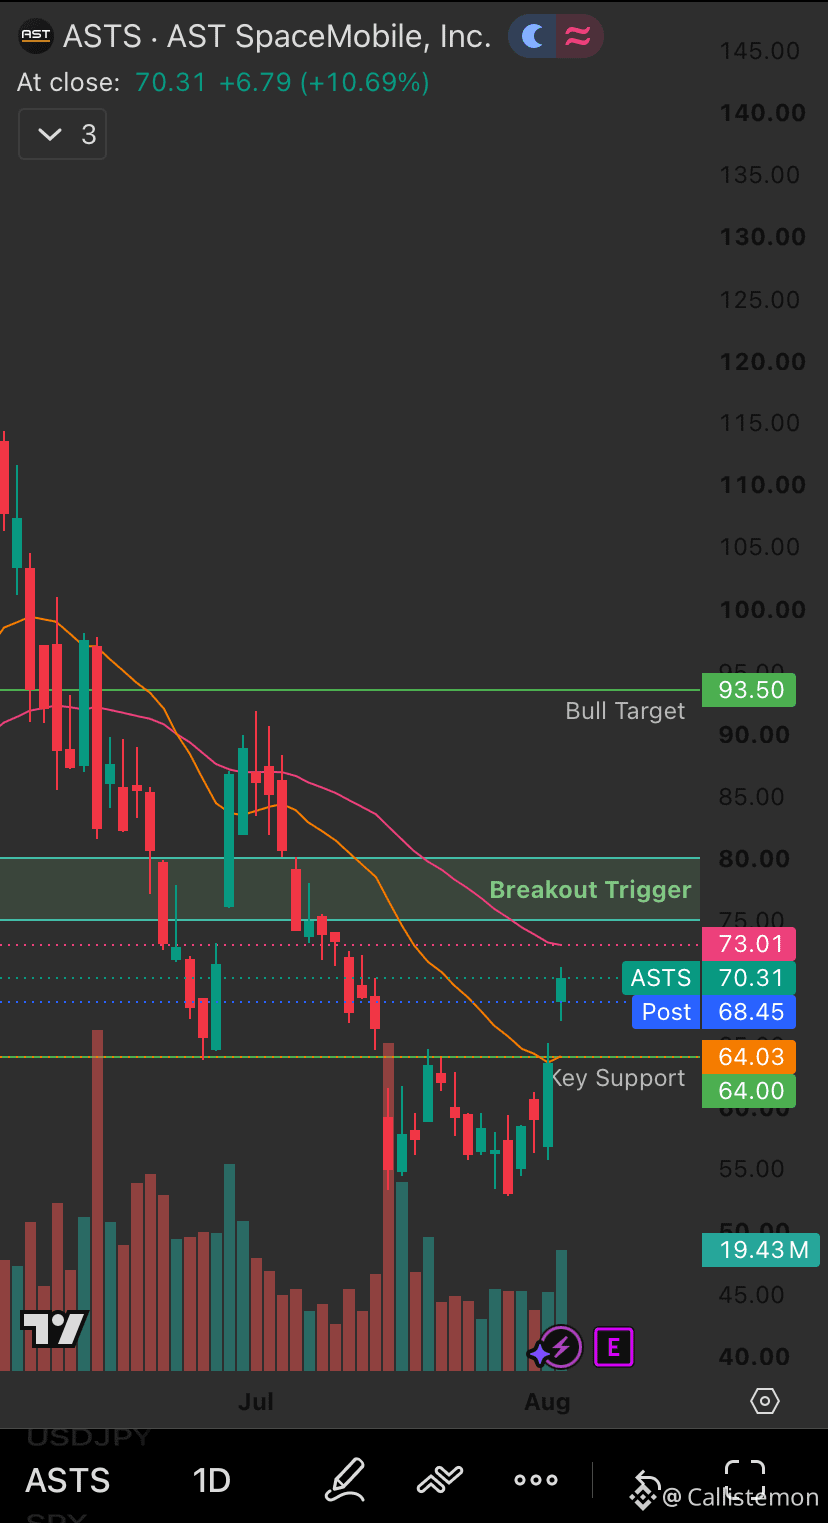
أغلقت AST SpaceMobile مرتفعة بنسبة 10.69% اليوم عند 70.31 دولارًا، لكن قبل الاستغراق في الأمر، يجب الانتباه إلى السياق: كانت هذه حركة على مستوى القطاع، تسبق تقرير أرباح SpaceX الأول من نوعه الذي سيُعرض للجمهور لأول مرة. ارتفعت SpaceX بنسبة 4%، وASTS بنسبة 9%، وRocket Lab بنسبة 6%، وانتشرت موجة الصعود عبر شركات الأقمار الصناعية وأسماء الإطلاق بشكل واسع. تحوّل اتجاه Reddit تجاه أسهم الفضاء إلى صعودي بعد شهر يوليو/تموز صعب شهد تراجع القطاع بنسبة 25-33%.
الصورة الفنية: تختبر ASTS الآن نطاق منطقة “اختراق” عند 73-80 دولارًا بعد ارتدادها من دعمٍ رئيسي قرب 64 دولارًا، وهو مستوى تمسك مرتين الآن (قاع مزدوج). فوق هذه المنطقة، تبلغ الوجهة التالية الحقيقية 93.50 دولارًا استنادًا إلى بنية القمة/التأرجح الأخيرة.
العامل المحفّز الحقيقي ليس حركة اليوم، بل 10 أغسطس/آب، حين تُعلن ASTS عن أرباحها. تقديرات الإيرادات عند 34.54 مليون دولار، بزيادة هائلة مقارنة بـ 1.16 مليون دولار قبل عام. كما تضيق الخسائر (تقدير ربحية السهم -0.29 دولار مقابل -0.41 على أساس سنوي). الرأي التحليلي منقسم فعلاً في الوقت الحالي: لدى Piper Sandler هدف 100 دولار (زيادة الوزن)، وتضع B.Riley هدف 85 دولارًا (شراء)، بينما خفّضت Scotiabank إلى 50.80 دولارًا (أداء قطاعي) في 29 يوليو/تموز—وهو هدف فعليًا أقل من سعر اليوم.
مخاطر هيكلية يجب معرفتها: تحمل ASTS وزنًا ملموسًا في صناديق ETF لقطاع الفضاء (مثل Procure Space)، ما يعني أن تدفقات الأموال إلى الصندوق أو خروجها يمكن أن تفرض شراء/بيعًا ميكانيكيًا مستقلًا عن أخبار الشركة.
الخلاصة: يبدو أن الارتفاع اليوم يشبه “بيتا” تجاه القطاع أكثر من كونه إشارة خاصة بـ ASTS. أرباح 10 أغسطس/آب هي اللحظة التي نعرف فيها إن كانت الأساسيات تدعم حركة السعر.
هل تتابع هذا عن كثب؟ أفكاركم؟ 👇
{future}(ASTSUSDT)
📡 $ASTS الإعداد: حشد تعاطف أم اختراق حقيقي؟
أغلقت AST SpaceMobile مرتفعة بنسبة 10.69% اليوم عند 70.31 دولارًا، لكن قبل الاستغراق في الأمر، يجب الانتباه إلى السياق: كانت هذه حركة على مستوى القطاع، تسبق تقرير أرباح SpaceX الأول من نوعه الذي سيُعرض للجمهور لأول مرة. ارتفعت SpaceX بنسبة 4%، وASTS بنسبة 9%، وRocket Lab بنسبة 6%، وانتشرت موجة الصعود عبر شركات الأقمار الصناعية وأسماء الإطلاق بشكل واسع. تحوّل اتجاه Reddit تجاه أسهم الفضاء إلى صعودي بعد شهر يوليو/تموز صعب شهد تراجع القطاع بنسبة 25-33%.
الصورة الفنية: تختبر ASTS الآن نطاق منطقة “اختراق” عند 73-80 دولارًا بعد ارتدادها من دعمٍ رئيسي قرب 64 دولارًا، وهو مستوى تمسك مرتين الآن (قاع مزدوج). فوق هذه المنطقة، تبلغ الوجهة التالية الحقيقية 93.50 دولارًا استنادًا إلى بنية القمة/التأرجح الأخيرة.
العامل المحفّز الحقيقي ليس حركة اليوم، بل 10 أغسطس/آب، حين تُعلن ASTS عن أرباحها. تقديرات الإيرادات عند 34.54 مليون دولار، بزيادة هائلة مقارنة بـ 1.16 مليون دولار قبل عام. كما تضيق الخسائر (تقدير ربحية السهم -0.29 دولار مقابل -0.41 على أساس سنوي). الرأي التحليلي منقسم فعلاً في الوقت الحالي: لدى Piper Sandler هدف 100 دولار (زيادة الوزن)، وتضع B.Riley هدف 85 دولارًا (شراء)، بينما خفّضت Scotiabank إلى 50.80 دولارًا (أداء قطاعي) في 29 يوليو/تموز—وهو هدف فعليًا أقل من سعر اليوم.
مخاطر هيكلية يجب معرفتها: تحمل ASTS وزنًا ملموسًا في صناديق ETF لقطاع الفضاء (مثل Procure Space)، ما يعني أن تدفقات الأموال إلى الصندوق أو خروجها يمكن أن تفرض شراء/بيعًا ميكانيكيًا مستقلًا عن أخبار الشركة.
الخلاصة: يبدو أن الارتفاع اليوم يشبه “بيتا” تجاه القطاع أكثر من كونه إشارة خاصة بـ ASTS. أرباح 10 أغسطس/آب هي اللحظة التي نعرف فيها إن كانت الأساسيات تدعم حركة السعر.
هل تتابع هذا عن كثب؟ أفكاركم؟ 👇
أغلقت AST SpaceMobile مرتفعة بنسبة 10.69% اليوم عند 70.31 دولارًا، لكن قبل الاستغراق في الأمر، يجب الانتباه إلى السياق: كانت هذه حركة على مستوى القطاع، تسبق تقرير أرباح SpaceX الأول من نوعه الذي سيُعرض للجمهور لأول مرة. ارتفعت SpaceX بنسبة 4%، وASTS بنسبة 9%، وRocket Lab بنسبة 6%، وانتشرت موجة الصعود عبر شركات الأقمار الصناعية وأسماء الإطلاق بشكل واسع. تحوّل اتجاه Reddit تجاه أسهم الفضاء إلى صعودي بعد شهر يوليو/تموز صعب شهد تراجع القطاع بنسبة 25-33%.
الصورة الفنية: تختبر ASTS الآن نطاق منطقة “اختراق” عند 73-80 دولارًا بعد ارتدادها من دعمٍ رئيسي قرب 64 دولارًا، وهو مستوى تمسك مرتين الآن (قاع مزدوج). فوق هذه المنطقة، تبلغ الوجهة التالية الحقيقية 93.50 دولارًا استنادًا إلى بنية القمة/التأرجح الأخيرة.
العامل المحفّز الحقيقي ليس حركة اليوم، بل 10 أغسطس/آب، حين تُعلن ASTS عن أرباحها. تقديرات الإيرادات عند 34.54 مليون دولار، بزيادة هائلة مقارنة بـ 1.16 مليون دولار قبل عام. كما تضيق الخسائر (تقدير ربحية السهم -0.29 دولار مقابل -0.41 على أساس سنوي). الرأي التحليلي منقسم فعلاً في الوقت الحالي: لدى Piper Sandler هدف 100 دولار (زيادة الوزن)، وتضع B.Riley هدف 85 دولارًا (شراء)، بينما خفّضت Scotiabank إلى 50.80 دولارًا (أداء قطاعي) في 29 يوليو/تموز—وهو هدف فعليًا أقل من سعر اليوم.
مخاطر هيكلية يجب معرفتها: تحمل ASTS وزنًا ملموسًا في صناديق ETF لقطاع الفضاء (مثل Procure Space)، ما يعني أن تدفقات الأموال إلى الصندوق أو خروجها يمكن أن تفرض شراء/بيعًا ميكانيكيًا مستقلًا عن أخبار الشركة.
الخلاصة: يبدو أن الارتفاع اليوم يشبه “بيتا” تجاه القطاع أكثر من كونه إشارة خاصة بـ ASTS. أرباح 10 أغسطس/آب هي اللحظة التي نعرف فيها إن كانت الأساسيات تدعم حركة السعر.
هل تتابع هذا عن كثب؟ أفكاركم؟ 👇
1
102
·
--
صاعد
تمّ التحقق
🔵 $SUI الإعداد: أساسيات قوية، مؤشرات فنية متأخرة
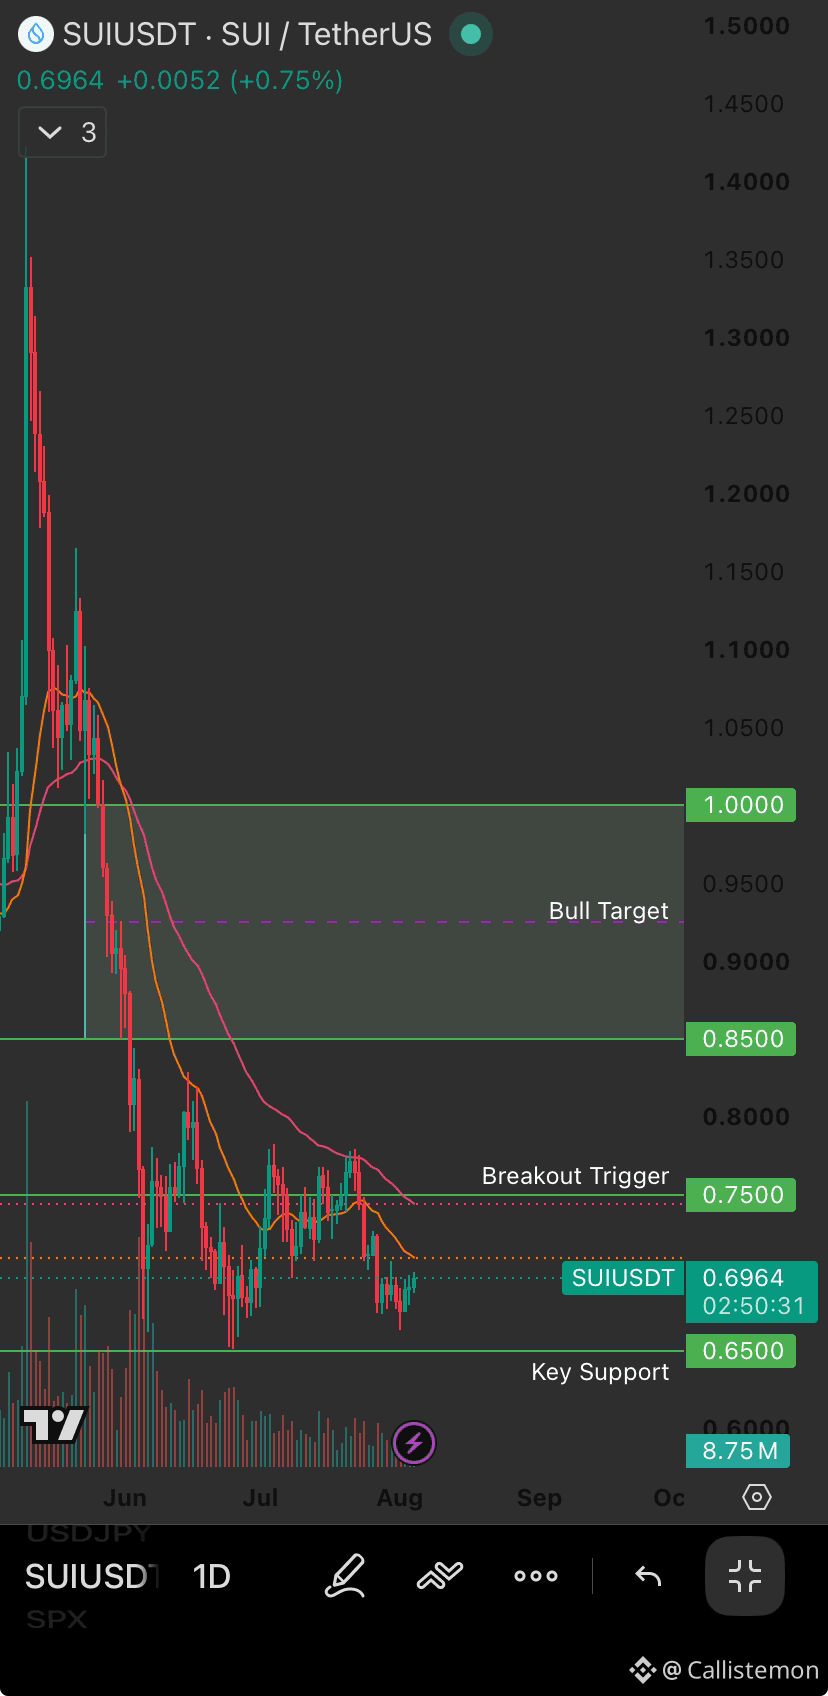
لقد وصلت “Sui” إلى علامة مؤسسية حقيقية؛ إذ قام توكن “مبادلة” في أبوظبي بتوثيق/ترميز صندوق استثمارات خاصة بقيمة 75 مليون دولار على الشبكة. هذا توظيف رأسمالي فعلي، وليس مضاربة مدفوعة بالسرد، وهو من نوع المحفزات الذي يهم على المدى الأطول.
لكن الصورة الفنية، رغم ذلك، لم تؤكده بعد. يتداول SUI عند 0.6967$، أسفل كل من متوسطه المتحرك لخمسة وأربعين يومًا ولـ200 يوم (حيث يقع متوسط 200D أعلى بنسبة تتجاوز 35% عن السعر الحالي)، ولا يزال مخطط الأسبوع يُظهر قناة هابطة قائمة منذ أشهر.
المستويات:
🟢 محفز الاختراق: استعادة 0.75$ بحجم تداول يفتح الطريق نحو 0.85$–1.00$
🔴 دعم محوري: فقدان 0.65$ قد يجرّ إلى حركة أعمق، نظرًا لبنية القناة الأوسع
في الوقت الحالي السعر محصور بين المستويين، والفجوة بين قصة الأساسيات والإعداد الفني هي بالضبط التوتر الذي يستحق المراقبة. كما أن هناك فك قفل توكنات بسيط هذا الشهر (~زيادة 0.55% في المعروض) وليس عبئًا كبيرًا، لكن من الجيد معرفته.
التبنّي المؤسسي لا يظهر دائمًا في السعر فورًا. السؤال هو: هل يلحق مخطط SUI بالقصة، أم تخبو القصة قبل أن يلحقها المخطط.
أين تموضعك في هذا الملف؟ 👇
{future}(SUIUSDT)
🔵 $SUI الإعداد: أساسيات قوية، مؤشرات فنية متأخرة
لقد وصلت “Sui” إلى علامة مؤسسية حقيقية؛ إذ قام توكن “مبادلة” في أبوظبي بتوثيق/ترميز صندوق استثمارات خاصة بقيمة 75 مليون دولار على الشبكة. هذا توظيف رأسمالي فعلي، وليس مضاربة مدفوعة بالسرد، وهو من نوع المحفزات الذي يهم على المدى الأطول.
لكن الصورة الفنية، رغم ذلك، لم تؤكده بعد. يتداول SUI عند 0.6967$، أسفل كل من متوسطه المتحرك لخمسة وأربعين يومًا ولـ200 يوم (حيث يقع متوسط 200D أعلى بنسبة تتجاوز 35% عن السعر الحالي)، ولا يزال مخطط الأسبوع يُظهر قناة هابطة قائمة منذ أشهر.
المستويات:
🟢 محفز الاختراق: استعادة 0.75$ بحجم تداول يفتح الطريق نحو 0.85$–1.00$
🔴 دعم محوري: فقدان 0.65$ قد يجرّ إلى حركة أعمق، نظرًا لبنية القناة الأوسع
في الوقت الحالي السعر محصور بين المستويين، والفجوة بين قصة الأساسيات والإعداد الفني هي بالضبط التوتر الذي يستحق المراقبة. كما أن هناك فك قفل توكنات بسيط هذا الشهر (~زيادة 0.55% في المعروض) وليس عبئًا كبيرًا، لكن من الجيد معرفته.
التبنّي المؤسسي لا يظهر دائمًا في السعر فورًا. السؤال هو: هل يلحق مخطط SUI بالقصة، أم تخبو القصة قبل أن يلحقها المخطط.
أين تموضعك في هذا الملف؟ 👇
لقد وصلت “Sui” إلى علامة مؤسسية حقيقية؛ إذ قام توكن “مبادلة” في أبوظبي بتوثيق/ترميز صندوق استثمارات خاصة بقيمة 75 مليون دولار على الشبكة. هذا توظيف رأسمالي فعلي، وليس مضاربة مدفوعة بالسرد، وهو من نوع المحفزات الذي يهم على المدى الأطول.
لكن الصورة الفنية، رغم ذلك، لم تؤكده بعد. يتداول SUI عند 0.6967$، أسفل كل من متوسطه المتحرك لخمسة وأربعين يومًا ولـ200 يوم (حيث يقع متوسط 200D أعلى بنسبة تتجاوز 35% عن السعر الحالي)، ولا يزال مخطط الأسبوع يُظهر قناة هابطة قائمة منذ أشهر.
المستويات:
🟢 محفز الاختراق: استعادة 0.75$ بحجم تداول يفتح الطريق نحو 0.85$–1.00$
🔴 دعم محوري: فقدان 0.65$ قد يجرّ إلى حركة أعمق، نظرًا لبنية القناة الأوسع
في الوقت الحالي السعر محصور بين المستويين، والفجوة بين قصة الأساسيات والإعداد الفني هي بالضبط التوتر الذي يستحق المراقبة. كما أن هناك فك قفل توكنات بسيط هذا الشهر (~زيادة 0.55% في المعروض) وليس عبئًا كبيرًا، لكن من الجيد معرفته.
التبنّي المؤسسي لا يظهر دائمًا في السعر فورًا. السؤال هو: هل يلحق مخطط SUI بالقصة، أم تخبو القصة قبل أن يلحقها المخطط.
أين تموضعك في هذا الملف؟ 👇
1
143
·
--
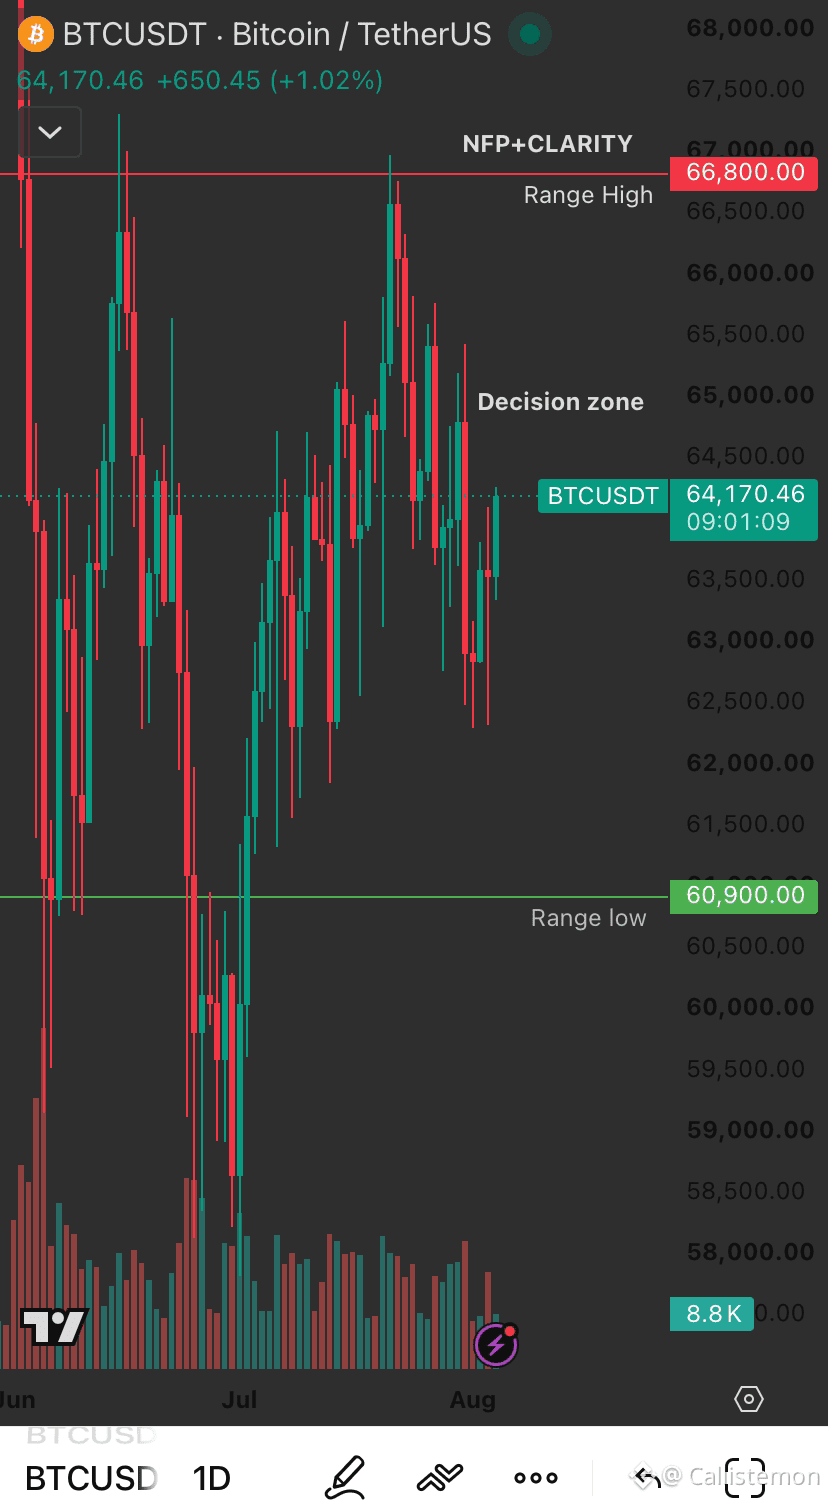
وصل البيتكوين إلى منطقة قرار.
قد لا يتم تحديد الخطوة التالية بالتحليل الفني وحده.
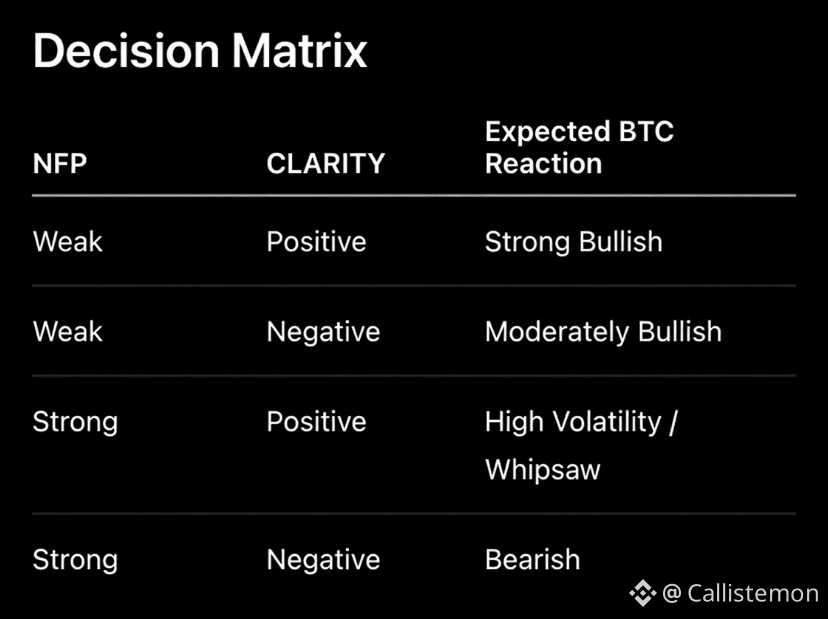
البيتكوين لا ينتظر محفّزًا واحدًا.
إنه ينتظر اثنين:
NFP + الوضوح
يتم إطلاق مصفوفة القرار يوم الجمعة 👇
ما النتيجة التي تعتقد أن السوق يسعّرها بأقل من قيمتها؟
#Bitcoin #BTC #Macro #NFP
وصل البيتكوين إلى منطقة قرار.
قد لا يتم تحديد الخطوة التالية بالتحليل الفني وحده.
البيتكوين لا ينتظر محفّزًا واحدًا.
إنه ينتظر اثنين:
NFP + الوضوح
يتم إطلاق مصفوفة القرار يوم الجمعة 👇
ما النتيجة التي تعتقد أن السوق يسعّرها بأقل من قيمتها؟
#Bitcoin #BTC #Macro #NFP
قد لا يتم تحديد الخطوة التالية بالتحليل الفني وحده.
البيتكوين لا ينتظر محفّزًا واحدًا.
إنه ينتظر اثنين:
NFP + الوضوح
يتم إطلاق مصفوفة القرار يوم الجمعة 👇
ما النتيجة التي تعتقد أن السوق يسعّرها بأقل من قيمتها؟
#Bitcoin #BTC #Macro #NFP
78
·
--
صاعد
📊 إعداد هذا الأسبوع: الاستراتيجية تبيع، CLARITY يتعثر، والأسهم ترتفع دون BTC
ثلاثة أمور تستحق المتابعة مع اقتراب بقية الأسبوع:
1. خفّضت الاستراتيجية حصتها من البيتكوين. بيع 1,638 BTC مقابل 104.7 مليون دولار (متوسط 63,957 دولار)، لتمويل توزيعات أرباح الأسهم الممتازة المفضّلة وإعادة شراءات STRC. هذا ليس تغييرًا في استراتيجية التراكم على الورق؛ فالاستراتيجية اشترت 174,895 BTC مقابل بيع 3,620 YTD فقط. لكن السياق مهم: MSTR يتداول عند مستوى يقل 41% عن متوسطه المتحرك لمدته 200 يوم، ويقع ضمن هيكل "تقاطع وفاة" منذ أكتوبر، وقد نشر للتو خسارة قدرها 8.3 مليار دولار في الربع الثاني على حيازاته من الأصول الرقمية. إدارة السيولة، نعم، لكن من موقع ضغط فعلي على الميزانية العمومية.
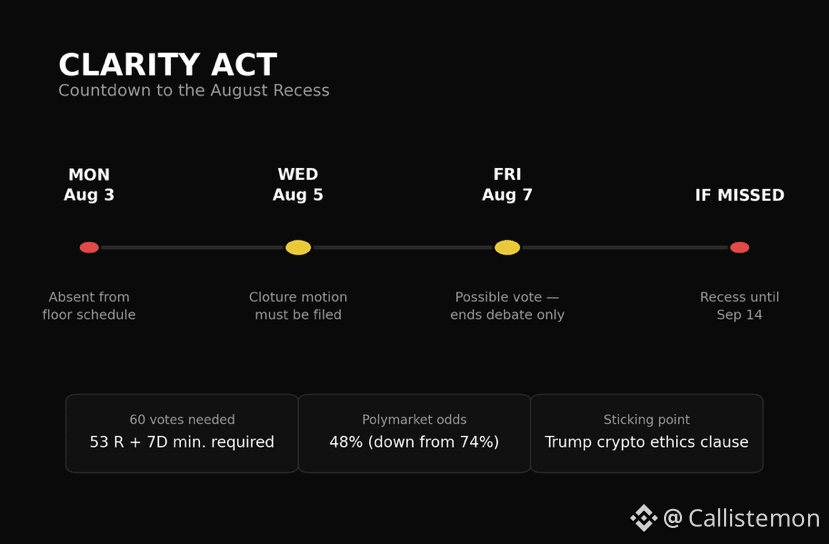
2. نافذة قانون CLARITY تقترب من الإغلاق. لم يكن مشروع القانون موجودًا في جدول أعمال مجلس الشيوخ يوم الاثنين. إذا لم يقدّم القادة طلب إنهاء النقاش (cloture) بحلول الأربعاء (5 أغسطس)، فلن تكون هناك طريق للتصويت يوم الجمعة قبل عطلة 7 أغسطس — وقد يعني التأخير انتظارًا حتى 14 سبتمبر. حتى تصويت الجمعة "الناجح" سيُنهي فقط النقاش حول طلب المضي قدمًا، وليس تمرير مشروع القانون نفسه. وتتراجع الاحتمالات: Polymarket انخفض إلى 48% من 74% قبل شهر، وخفضت Galaxy Research احتمالات تمرير 2026 من 50% إلى 30%. نقطة التعثر الحقيقية هي بند أخلاقيات مرتبط بإيرادات كريبتو بقيمة 1.4 مليار دولار في 2025 — وفقًا لما أُعلن عن ترامب. يحتاج الجمهوريون إلى 7+ تقاطعات ديمقراطية، ولديهم حاليًا 2، بشكل مشروط.
3. الأسهم اندفعت، لكن الكريبتو لم يتبع. ناسداك +2.1%، وS&P +1.5%، وأغلق داو عند مستوى قياسي مرتفع اليوم على خلفية تفاؤل تهدئة التوترات مع إيران. الذهب تحرك قليلًا. BTC؟ مرتفع فقط 0.25%. هذا تباين حقيقي يستحق المراقبة — هل يتراجع الكريبتو بسبب عدم اليقين المرتبط بـ CLARITY، أم أنها مجرد تردد أوسع قبل محفزين مزدوجين يوم الجمعة (تقرير الوظائف + الموعد النهائي لـ CLARITY)?
خلفية الموسمية: أغلق أغسطس على اللون الأحمر بالنسبة لـ BTC في 11 من آخر 16 عامًا — تاريخيًا هو أسوأ شهر للعملات المشفرة. السيناريو الأساسي من هنا: استمرار التذبذب، وربما قاع محلي جديد. لكن إذا فاجأ CLARITY صعودًا هذه الأسبوع فعليًا، فقد تكون المراكز خفيفة بما يكفي بحيث يمكن أن يؤدي ذلك إلى واحدة من أشد عمليات الضغط القصير (short squeeze) في الذاكرة الحديثة.
أي السيناريو تميل إليه؟ 👇
📊 إعداد هذا الأسبوع: الاستراتيجية تبيع، CLARITY يتعثر، والأسهم ترتفع دون BTC
ثلاثة أمور تستحق المتابعة مع اقتراب بقية الأسبوع:
1. خفّضت الاستراتيجية حصتها من البيتكوين. بيع 1,638 BTC مقابل 104.7 مليون دولار (متوسط 63,957 دولار)، لتمويل توزيعات أرباح الأسهم الممتازة المفضّلة وإعادة شراءات STRC. هذا ليس تغييرًا في استراتيجية التراكم على الورق؛ فالاستراتيجية اشترت 174,895 BTC مقابل بيع 3,620 YTD فقط. لكن السياق مهم: MSTR يتداول عند مستوى يقل 41% عن متوسطه المتحرك لمدته 200 يوم، ويقع ضمن هيكل "تقاطع وفاة" منذ أكتوبر، وقد نشر للتو خسارة قدرها 8.3 مليار دولار في الربع الثاني على حيازاته من الأصول الرقمية. إدارة السيولة، نعم، لكن من موقع ضغط فعلي على الميزانية العمومية.
2. نافذة قانون CLARITY تقترب من الإغلاق. لم يكن مشروع القانون موجودًا في جدول أعمال مجلس الشيوخ يوم الاثنين. إذا لم يقدّم القادة طلب إنهاء النقاش (cloture) بحلول الأربعاء (5 أغسطس)، فلن تكون هناك طريق للتصويت يوم الجمعة قبل عطلة 7 أغسطس — وقد يعني التأخير انتظارًا حتى 14 سبتمبر. حتى تصويت الجمعة "الناجح" سيُنهي فقط النقاش حول طلب المضي قدمًا، وليس تمرير مشروع القانون نفسه. وتتراجع الاحتمالات: Polymarket انخفض إلى 48% من 74% قبل شهر، وخفضت Galaxy Research احتمالات تمرير 2026 من 50% إلى 30%. نقطة التعثر الحقيقية هي بند أخلاقيات مرتبط بإيرادات كريبتو بقيمة 1.4 مليار دولار في 2025 — وفقًا لما أُعلن عن ترامب. يحتاج الجمهوريون إلى 7+ تقاطعات ديمقراطية، ولديهم حاليًا 2، بشكل مشروط.
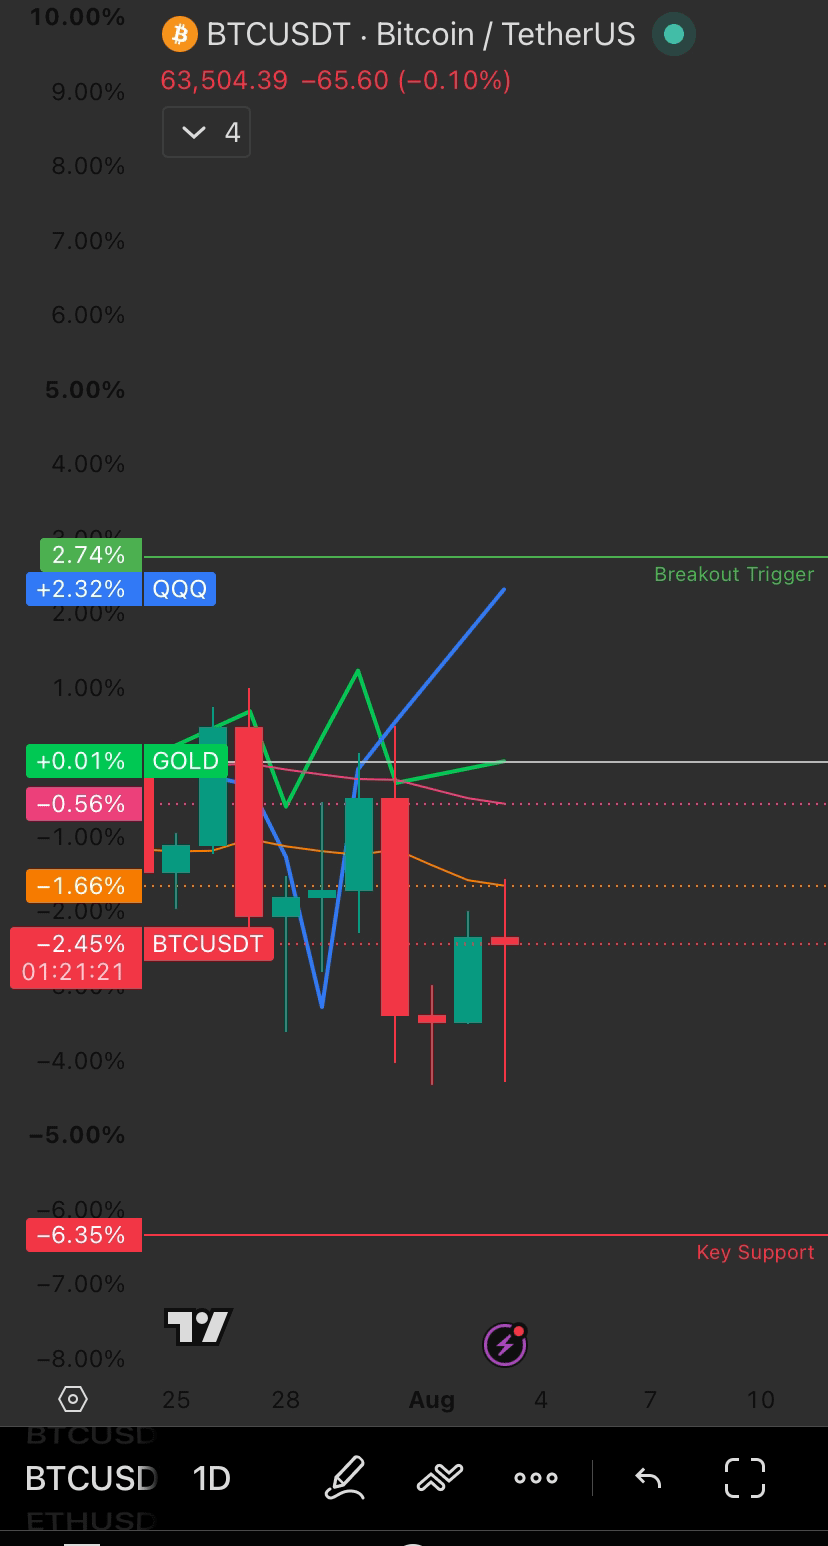
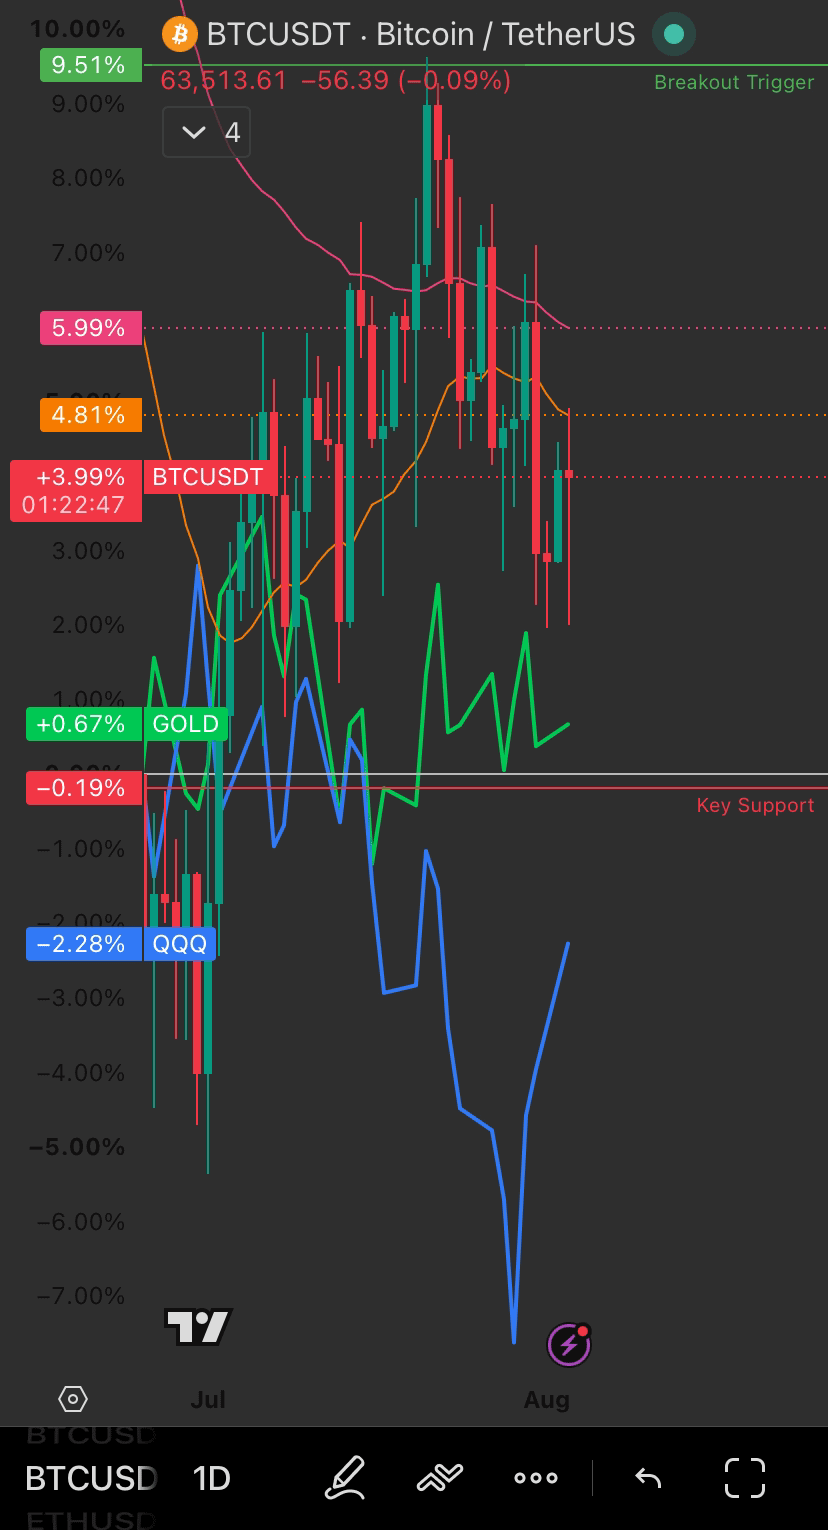
3. الأسهم اندفعت، لكن الكريبتو لم يتبع. ناسداك +2.1%، وS&P +1.5%، وأغلق داو عند مستوى قياسي مرتفع اليوم على خلفية تفاؤل تهدئة التوترات مع إيران. الذهب تحرك قليلًا. BTC؟ مرتفع فقط 0.25%. هذا تباين حقيقي يستحق المراقبة — هل يتراجع الكريبتو بسبب عدم اليقين المرتبط بـ CLARITY، أم أنها مجرد تردد أوسع قبل محفزين مزدوجين يوم الجمعة (تقرير الوظائف + الموعد النهائي لـ CLARITY)?
خلفية الموسمية: أغلق أغسطس على اللون الأحمر بالنسبة لـ BTC في 11 من آخر 16 عامًا — تاريخيًا هو أسوأ شهر للعملات المشفرة. السيناريو الأساسي من هنا: استمرار التذبذب، وربما قاع محلي جديد. لكن إذا فاجأ CLARITY صعودًا هذه الأسبوع فعليًا، فقد تكون المراكز خفيفة بما يكفي بحيث يمكن أن يؤدي ذلك إلى واحدة من أشد عمليات الضغط القصير (short squeeze) في الذاكرة الحديثة.
أي السيناريو تميل إليه؟ 👇
ثلاثة أمور تستحق المتابعة مع اقتراب بقية الأسبوع:
1. خفّضت الاستراتيجية حصتها من البيتكوين. بيع 1,638 BTC مقابل 104.7 مليون دولار (متوسط 63,957 دولار)، لتمويل توزيعات أرباح الأسهم الممتازة المفضّلة وإعادة شراءات STRC. هذا ليس تغييرًا في استراتيجية التراكم على الورق؛ فالاستراتيجية اشترت 174,895 BTC مقابل بيع 3,620 YTD فقط. لكن السياق مهم: MSTR يتداول عند مستوى يقل 41% عن متوسطه المتحرك لمدته 200 يوم، ويقع ضمن هيكل "تقاطع وفاة" منذ أكتوبر، وقد نشر للتو خسارة قدرها 8.3 مليار دولار في الربع الثاني على حيازاته من الأصول الرقمية. إدارة السيولة، نعم، لكن من موقع ضغط فعلي على الميزانية العمومية.
2. نافذة قانون CLARITY تقترب من الإغلاق. لم يكن مشروع القانون موجودًا في جدول أعمال مجلس الشيوخ يوم الاثنين. إذا لم يقدّم القادة طلب إنهاء النقاش (cloture) بحلول الأربعاء (5 أغسطس)، فلن تكون هناك طريق للتصويت يوم الجمعة قبل عطلة 7 أغسطس — وقد يعني التأخير انتظارًا حتى 14 سبتمبر. حتى تصويت الجمعة "الناجح" سيُنهي فقط النقاش حول طلب المضي قدمًا، وليس تمرير مشروع القانون نفسه. وتتراجع الاحتمالات: Polymarket انخفض إلى 48% من 74% قبل شهر، وخفضت Galaxy Research احتمالات تمرير 2026 من 50% إلى 30%. نقطة التعثر الحقيقية هي بند أخلاقيات مرتبط بإيرادات كريبتو بقيمة 1.4 مليار دولار في 2025 — وفقًا لما أُعلن عن ترامب. يحتاج الجمهوريون إلى 7+ تقاطعات ديمقراطية، ولديهم حاليًا 2، بشكل مشروط.
3. الأسهم اندفعت، لكن الكريبتو لم يتبع. ناسداك +2.1%، وS&P +1.5%، وأغلق داو عند مستوى قياسي مرتفع اليوم على خلفية تفاؤل تهدئة التوترات مع إيران. الذهب تحرك قليلًا. BTC؟ مرتفع فقط 0.25%. هذا تباين حقيقي يستحق المراقبة — هل يتراجع الكريبتو بسبب عدم اليقين المرتبط بـ CLARITY، أم أنها مجرد تردد أوسع قبل محفزين مزدوجين يوم الجمعة (تقرير الوظائف + الموعد النهائي لـ CLARITY)?
خلفية الموسمية: أغلق أغسطس على اللون الأحمر بالنسبة لـ BTC في 11 من آخر 16 عامًا — تاريخيًا هو أسوأ شهر للعملات المشفرة. السيناريو الأساسي من هنا: استمرار التذبذب، وربما قاع محلي جديد. لكن إذا فاجأ CLARITY صعودًا هذه الأسبوع فعليًا، فقد تكون المراكز خفيفة بما يكفي بحيث يمكن أن يؤدي ذلك إلى واحدة من أشد عمليات الضغط القصير (short squeeze) في الذاكرة الحديثة.
أي السيناريو تميل إليه؟ 👇
96
·
--
صاعد
🔄 تحديث BTC: قاع أعلى مُؤكد؟
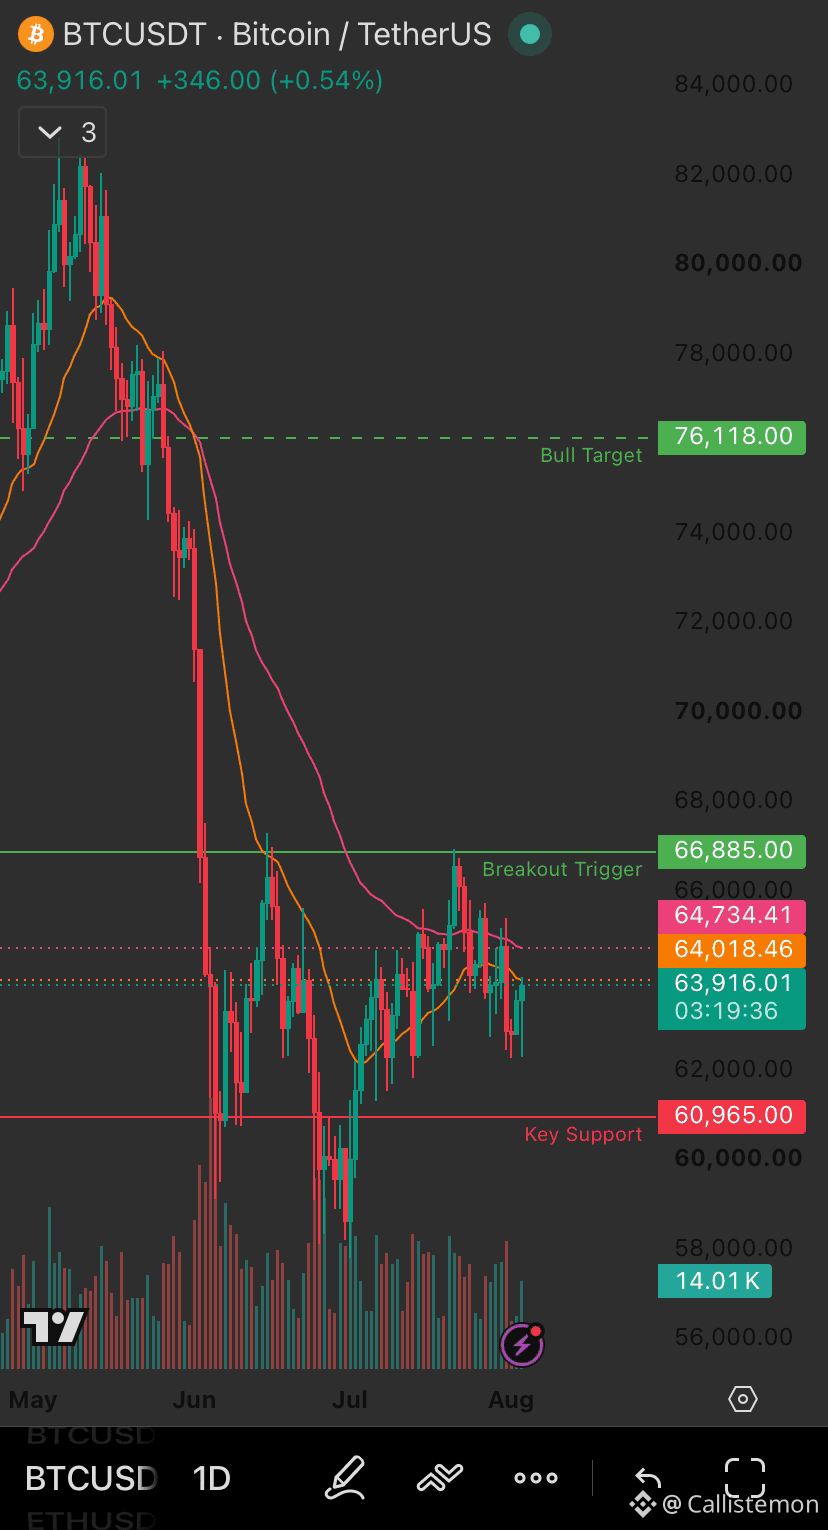
متابعةً لنداء النطاق يوم الإثنين ($60,965-$66,885): السعر طبع بنية قاع أعلى واضحة ونظيفة. قاع يونيو كان حول $58,000؛ بينما تراجع يوليو تماسك بثبات عند $60,965 فوقه جيدًا. هذا النوع من القيعان الأعلى يُبقي البنية الصعودية سليمة.
الآن يتم تداول BTC عند $63,942، ويظل مرتاحًا فوق منطقة الدعم الرئيسية تلك.
المستويات من يوم الإثنين لا تزال سارية:
🟢 إغلاق أعلى من $66,885 (محفّز الاختراق) يفتح الطريق إلى $76,118 (الهدف الصعودي)
🔴 فقدان $60,965 (الدعم الرئيسي) من شأنه كسر بنية القاع الأعلى وإعادة $54,000 إلى دائرة الاحتمال
لم يتم تأكيد أي شيء بعد—ما زلنا ضمن نطاق تداول، لكن البنية تتماسك بشكل أفضل مما كان يبدو يوم الإثنين. نراقب تقرير وظائف يوم الجمعة كعامل محفّز حقيقي قادم.
هل أحد يلعب هذا النطاق، أم ينتظر تأكيد الاختراق؟ 👇 $BTC
{future}(BTCUSDT)
🔄 تحديث BTC: قاع أعلى مُؤكد؟
متابعةً لنداء النطاق يوم الإثنين ($60,965-$66,885): السعر طبع بنية قاع أعلى واضحة ونظيفة. قاع يونيو كان حول $58,000؛ بينما تراجع يوليو تماسك بثبات عند $60,965 فوقه جيدًا. هذا النوع من القيعان الأعلى يُبقي البنية الصعودية سليمة.
الآن يتم تداول BTC عند $63,942، ويظل مرتاحًا فوق منطقة الدعم الرئيسية تلك.
المستويات من يوم الإثنين لا تزال سارية:
🟢 إغلاق أعلى من $66,885 (محفّز الاختراق) يفتح الطريق إلى $76,118 (الهدف الصعودي)
🔴 فقدان $60,965 (الدعم الرئيسي) من شأنه كسر بنية القاع الأعلى وإعادة $54,000 إلى دائرة الاحتمال
لم يتم تأكيد أي شيء بعد—ما زلنا ضمن نطاق تداول، لكن البنية تتماسك بشكل أفضل مما كان يبدو يوم الإثنين. نراقب تقرير وظائف يوم الجمعة كعامل محفّز حقيقي قادم.
هل أحد يلعب هذا النطاق، أم ينتظر تأكيد الاختراق؟ 👇 $BTC
متابعةً لنداء النطاق يوم الإثنين ($60,965-$66,885): السعر طبع بنية قاع أعلى واضحة ونظيفة. قاع يونيو كان حول $58,000؛ بينما تراجع يوليو تماسك بثبات عند $60,965 فوقه جيدًا. هذا النوع من القيعان الأعلى يُبقي البنية الصعودية سليمة.
الآن يتم تداول BTC عند $63,942، ويظل مرتاحًا فوق منطقة الدعم الرئيسية تلك.
المستويات من يوم الإثنين لا تزال سارية:
🟢 إغلاق أعلى من $66,885 (محفّز الاختراق) يفتح الطريق إلى $76,118 (الهدف الصعودي)
🔴 فقدان $60,965 (الدعم الرئيسي) من شأنه كسر بنية القاع الأعلى وإعادة $54,000 إلى دائرة الاحتمال
لم يتم تأكيد أي شيء بعد—ما زلنا ضمن نطاق تداول، لكن البنية تتماسك بشكل أفضل مما كان يبدو يوم الإثنين. نراقب تقرير وظائف يوم الجمعة كعامل محفّز حقيقي قادم.
هل أحد يلعب هذا النطاق، أم ينتظر تأكيد الاختراق؟ 👇 $BTC
2
1
131
·
--
صاعد
مرشح السوق #001
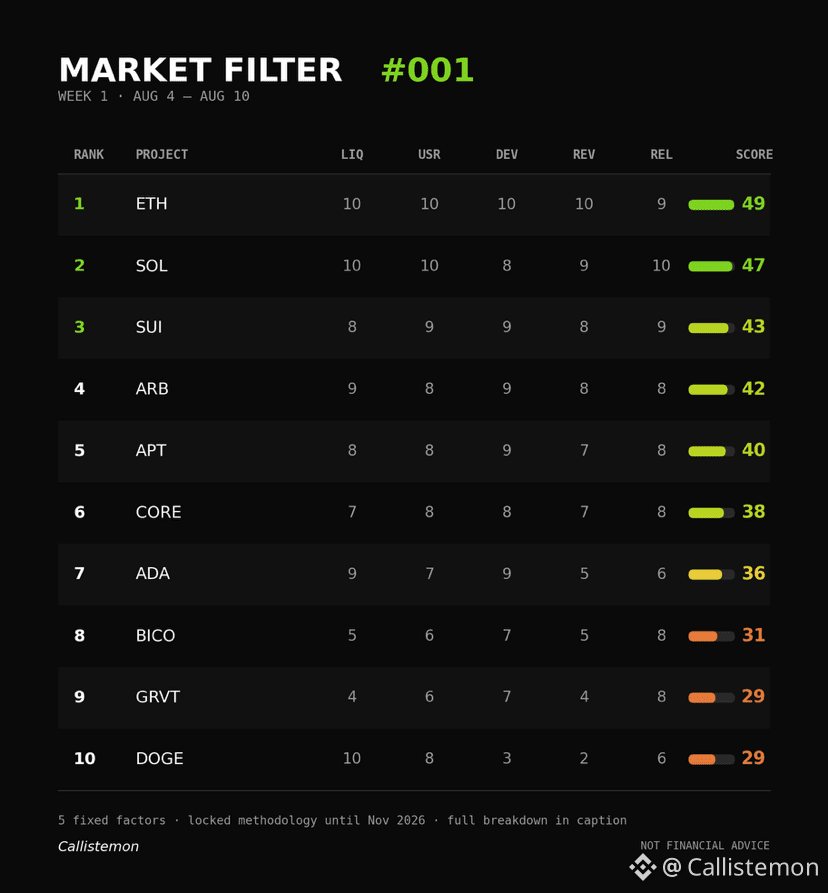
حققت DOGE 10/10 في السيولة و2/10 في الإيرادات.
فجوة الثماني نقاط هذه هي حرفيًا جوهر الحجة التي دفعتني لبدء هذا.
من الآن وحتى نوفمبر 2026، سأُقيّم في كل أسبوع المشاريع نفسها على خمسة عوامل ثابتة: السيولة، ونمو المستخدمين، ونشاط المطورين، والإيرادات، والقوة النسبية، دون أي تغييرات على المنهج بين كل أسبوع وآخر.
ليس لأن المنهج مثالي، بل لأن الإطار الذي يُعدّل نفسه بصمت ليتوافق مع ما حقق أداءً جيدًا ليس فعلًا إطارًا.
الأسبوع 1: تتصدر ETH القائمة بـ49/50، تقريبًا مثالية عبر كل فئة. تليها SOL بـ47، متجاوزة ETH في القوة النسبية وحدها. وتُكمل SUI المراكز الثلاثة الأولى بـ43.
انقسام DOGE في السيولة الهائلة، مع ما يكاد يساوي الصفر تحتها، هو بالضبط نوع الفجوة التي بُنيت هذه التجربة لإبرازها. الدرجة العالية هنا لا تعني "اشترِ هذا". بل تعني أن المشروع حاليًا لديه نشاط فعلي أكبر خلف سعره مما يوحي به السرد. الدرجة المنخفضة تعني العكس.
في نوفمبر، سأراجع كل بطاقة أسبوعية وأقارنها بما حدث فعليًا في السوق. إذا لم تتفوق الأساسيات على السرد، فسأقول ذلك.
قل لي أين ستعترض—أفضل أن أبحث عن الثغرات في هذا الآن، لا في نوفمبر.
مرشح السوق #001
حققت DOGE 10/10 في السيولة و2/10 في الإيرادات.
فجوة الثماني نقاط هذه هي حرفيًا جوهر الحجة التي دفعتني لبدء هذا.
من الآن وحتى نوفمبر 2026، سأُقيّم في كل أسبوع المشاريع نفسها على خمسة عوامل ثابتة: السيولة، ونمو المستخدمين، ونشاط المطورين، والإيرادات، والقوة النسبية، دون أي تغييرات على المنهج بين كل أسبوع وآخر.
ليس لأن المنهج مثالي، بل لأن الإطار الذي يُعدّل نفسه بصمت ليتوافق مع ما حقق أداءً جيدًا ليس فعلًا إطارًا.
الأسبوع 1: تتصدر ETH القائمة بـ49/50، تقريبًا مثالية عبر كل فئة. تليها SOL بـ47، متجاوزة ETH في القوة النسبية وحدها. وتُكمل SUI المراكز الثلاثة الأولى بـ43.
انقسام DOGE في السيولة الهائلة، مع ما يكاد يساوي الصفر تحتها، هو بالضبط نوع الفجوة التي بُنيت هذه التجربة لإبرازها. الدرجة العالية هنا لا تعني "اشترِ هذا". بل تعني أن المشروع حاليًا لديه نشاط فعلي أكبر خلف سعره مما يوحي به السرد. الدرجة المنخفضة تعني العكس.
في نوفمبر، سأراجع كل بطاقة أسبوعية وأقارنها بما حدث فعليًا في السوق. إذا لم تتفوق الأساسيات على السرد، فسأقول ذلك.
قل لي أين ستعترض—أفضل أن أبحث عن الثغرات في هذا الآن، لا في نوفمبر.
حققت DOGE 10/10 في السيولة و2/10 في الإيرادات.
فجوة الثماني نقاط هذه هي حرفيًا جوهر الحجة التي دفعتني لبدء هذا.
من الآن وحتى نوفمبر 2026، سأُقيّم في كل أسبوع المشاريع نفسها على خمسة عوامل ثابتة: السيولة، ونمو المستخدمين، ونشاط المطورين، والإيرادات، والقوة النسبية، دون أي تغييرات على المنهج بين كل أسبوع وآخر.
ليس لأن المنهج مثالي، بل لأن الإطار الذي يُعدّل نفسه بصمت ليتوافق مع ما حقق أداءً جيدًا ليس فعلًا إطارًا.
الأسبوع 1: تتصدر ETH القائمة بـ49/50، تقريبًا مثالية عبر كل فئة. تليها SOL بـ47، متجاوزة ETH في القوة النسبية وحدها. وتُكمل SUI المراكز الثلاثة الأولى بـ43.
انقسام DOGE في السيولة الهائلة، مع ما يكاد يساوي الصفر تحتها، هو بالضبط نوع الفجوة التي بُنيت هذه التجربة لإبرازها. الدرجة العالية هنا لا تعني "اشترِ هذا". بل تعني أن المشروع حاليًا لديه نشاط فعلي أكبر خلف سعره مما يوحي به السرد. الدرجة المنخفضة تعني العكس.
في نوفمبر، سأراجع كل بطاقة أسبوعية وأقارنها بما حدث فعليًا في السوق. إذا لم تتفوق الأساسيات على السرد، فسأقول ذلك.
قل لي أين ستعترض—أفضل أن أبحث عن الثغرات في هذا الآن، لا في نوفمبر.
313
·
--
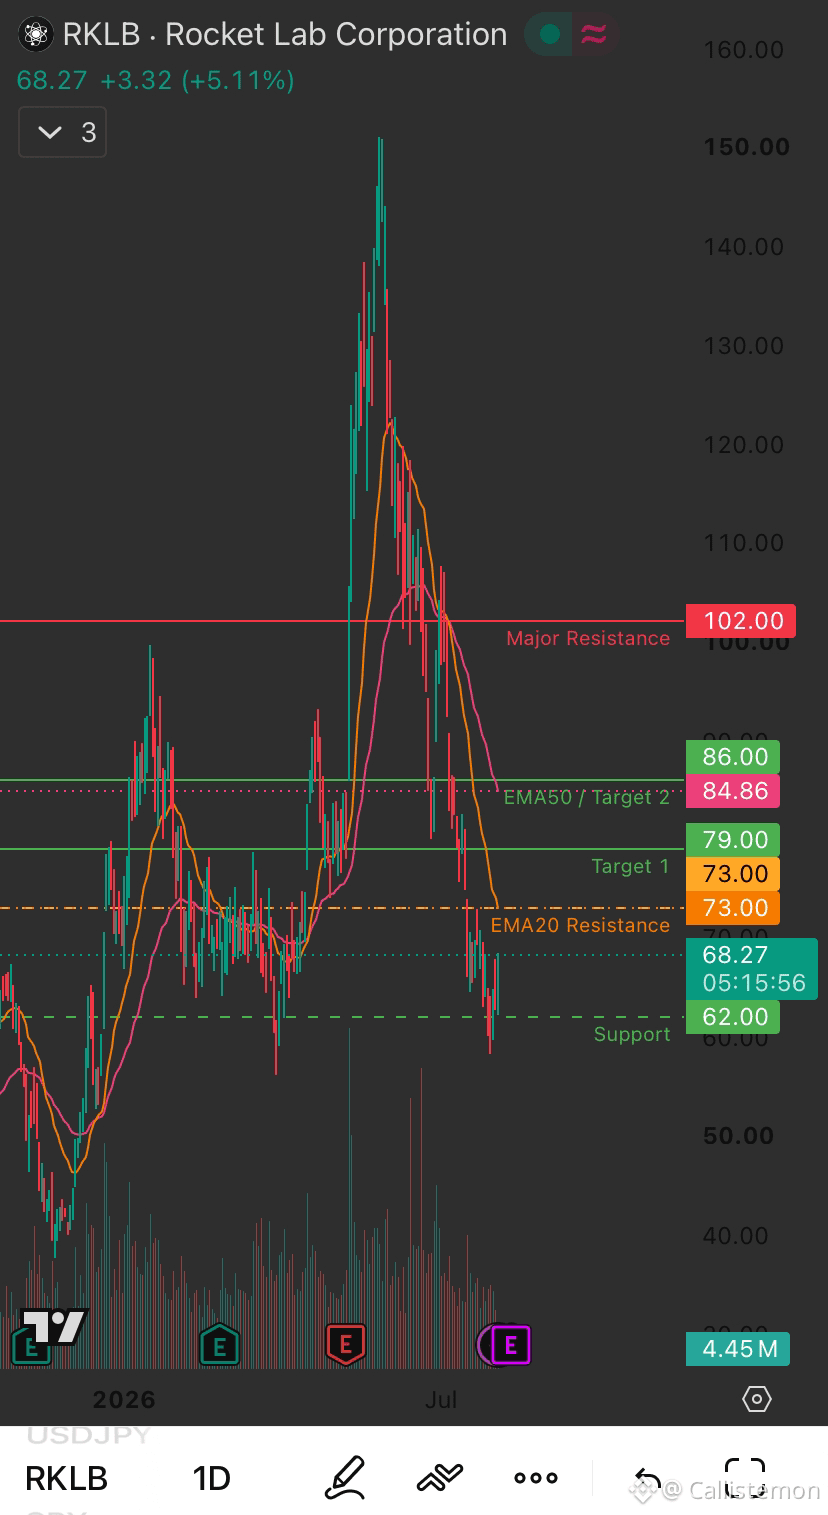
$RKLB تحاول الاستقرار بعد تصحيح حاد.
السعر لا يزال تحت كل من المتوسطين الأسيين 20 و50، ما يعني أن الاتجاه الأوسع ما زال حذرًا.
طالما أن دعم $62 ما يزال قائمًا، فإن سيناريو التعافي يبقى قائمًا.
استعادة المتوسط الأسي 20 قرب $73 ستكون أول تأكيد صعودي، ما يفتح الباب أمام $79 والمتوسط الأسي 50 قرب $86.
إن اختراقًا حاسمًا فوق $102 سيشير إلى انعكاس اتجاه أقوى بكثير، ويعيد النظرة للأجل الأطول إلى الصعود.
المستويات التي يجب مراقبتها:
الدعم: $62
مقاومة EMA20: $73
الهدف 1: $79
EMA50 / الهدف 2: $86
مقاومة رئيسية: $102
{future}(RKLBUSDT)
$RKLB تحاول الاستقرار بعد تصحيح حاد.
السعر لا يزال تحت كل من المتوسطين الأسيين 20 و50، ما يعني أن الاتجاه الأوسع ما زال حذرًا.
طالما أن دعم $62 ما يزال قائمًا، فإن سيناريو التعافي يبقى قائمًا.
استعادة المتوسط الأسي 20 قرب $73 ستكون أول تأكيد صعودي، ما يفتح الباب أمام $79 والمتوسط الأسي 50 قرب $86.
إن اختراقًا حاسمًا فوق $102 سيشير إلى انعكاس اتجاه أقوى بكثير، ويعيد النظرة للأجل الأطول إلى الصعود.
المستويات التي يجب مراقبتها:
الدعم: $62
مقاومة EMA20: $73
الهدف 1: $79
EMA50 / الهدف 2: $86
مقاومة رئيسية: $102
السعر لا يزال تحت كل من المتوسطين الأسيين 20 و50، ما يعني أن الاتجاه الأوسع ما زال حذرًا.
طالما أن دعم $62 ما يزال قائمًا، فإن سيناريو التعافي يبقى قائمًا.
استعادة المتوسط الأسي 20 قرب $73 ستكون أول تأكيد صعودي، ما يفتح الباب أمام $79 والمتوسط الأسي 50 قرب $86.
إن اختراقًا حاسمًا فوق $102 سيشير إلى انعكاس اتجاه أقوى بكثير، ويعيد النظرة للأجل الأطول إلى الصعود.
المستويات التي يجب مراقبتها:
الدعم: $62
مقاومة EMA20: $73
الهدف 1: $79
EMA50 / الهدف 2: $86
مقاومة رئيسية: $102
109
·
--
صاعد
📊 اجتماع صباحي يوم الاثنين.
مستويات BTC التي يجب مراقبتها هذا الأسبوع
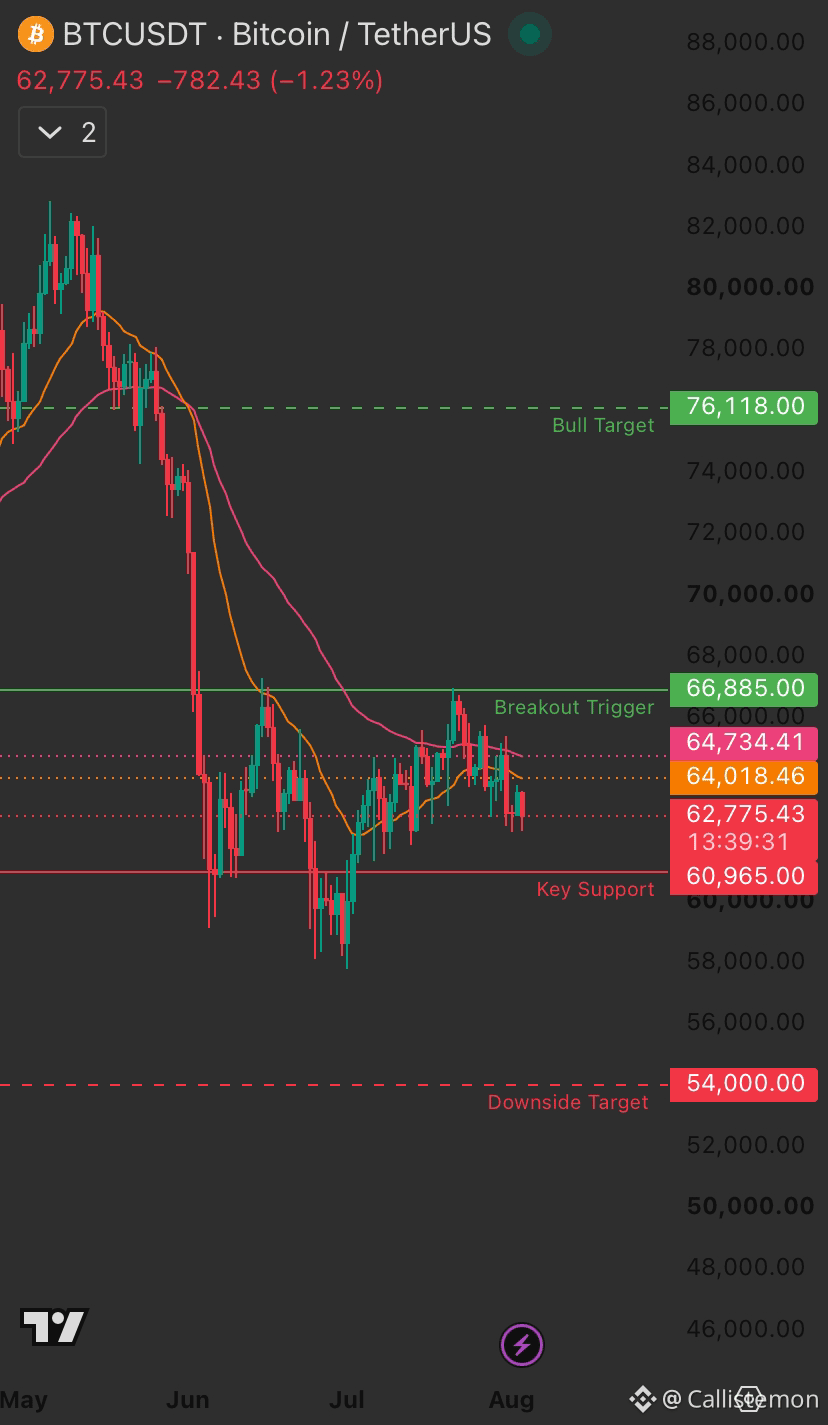
افتتحَت BTC الأسبوع عند 62,775$ (-1.23%)، وتقع مباشرةً في منطقة التذبذب بين 60,965$ و66,885$، دون اتجاه واضح بعد—وهذا بالضبط هو النطاق الذي ينبغي مراقبته.
الإعداد:
🟢 إغلاق لمدة 3 أيام فوق 66,885$ (محفز الاختراق) من شأنه استعادة الزخم الصعودي وفتح الطريق نحو 76,118$ (الهدف الصعودي)
🔴 الانخفاض تحت 60,965$ (الدعم الرئيسي) يكشف مخاطر هبوط باتجاه 54,000$
لماذا هذا مهم هذا الأسبوع: تقرير وظائف الولايات المتحدة يوم الجمعة هو أكبر محفز ماكرو مُدرج في التقويم. قد يكون ظهور أضعف من المتوقع (ليِّن) هو أفضل سيناريو لأصول المخاطرة مثل العملات المشفرة؛ فتَبرُد نمو الوظائف دون إثارة مخاوف الركود عادةً ما يدعم آمال خفض الفائدة.
كما تجدر الإشارة: يُعتبر شهر أغسطس تاريخيًا أضعف شهر بالنسبة للبيتكوين، لذا فقدرًا إضافيًا من الحذر هنا أمر معقول. لا يعني ذلك أنه سيتكرر، لكن هذا يُعد سياقًا.
أي جانب تميل إليه: اختراق أم انهيار؟ 👇$BTC
{future}(BTCUSDT)
📊 اجتماع صباحي يوم الاثنين.
مستويات BTC التي يجب مراقبتها هذا الأسبوع
افتتحَت BTC الأسبوع عند 62,775$ (-1.23%)، وتقع مباشرةً في منطقة التذبذب بين 60,965$ و66,885$، دون اتجاه واضح بعد—وهذا بالضبط هو النطاق الذي ينبغي مراقبته.
الإعداد:
🟢 إغلاق لمدة 3 أيام فوق 66,885$ (محفز الاختراق) من شأنه استعادة الزخم الصعودي وفتح الطريق نحو 76,118$ (الهدف الصعودي)
🔴 الانخفاض تحت 60,965$ (الدعم الرئيسي) يكشف مخاطر هبوط باتجاه 54,000$
لماذا هذا مهم هذا الأسبوع: تقرير وظائف الولايات المتحدة يوم الجمعة هو أكبر محفز ماكرو مُدرج في التقويم. قد يكون ظهور أضعف من المتوقع (ليِّن) هو أفضل سيناريو لأصول المخاطرة مثل العملات المشفرة؛ فتَبرُد نمو الوظائف دون إثارة مخاوف الركود عادةً ما يدعم آمال خفض الفائدة.
كما تجدر الإشارة: يُعتبر شهر أغسطس تاريخيًا أضعف شهر بالنسبة للبيتكوين، لذا فقدرًا إضافيًا من الحذر هنا أمر معقول. لا يعني ذلك أنه سيتكرر، لكن هذا يُعد سياقًا.
أي جانب تميل إليه: اختراق أم انهيار؟ 👇$BTC
مستويات BTC التي يجب مراقبتها هذا الأسبوع
افتتحَت BTC الأسبوع عند 62,775$ (-1.23%)، وتقع مباشرةً في منطقة التذبذب بين 60,965$ و66,885$، دون اتجاه واضح بعد—وهذا بالضبط هو النطاق الذي ينبغي مراقبته.
الإعداد:
🟢 إغلاق لمدة 3 أيام فوق 66,885$ (محفز الاختراق) من شأنه استعادة الزخم الصعودي وفتح الطريق نحو 76,118$ (الهدف الصعودي)
🔴 الانخفاض تحت 60,965$ (الدعم الرئيسي) يكشف مخاطر هبوط باتجاه 54,000$
لماذا هذا مهم هذا الأسبوع: تقرير وظائف الولايات المتحدة يوم الجمعة هو أكبر محفز ماكرو مُدرج في التقويم. قد يكون ظهور أضعف من المتوقع (ليِّن) هو أفضل سيناريو لأصول المخاطرة مثل العملات المشفرة؛ فتَبرُد نمو الوظائف دون إثارة مخاوف الركود عادةً ما يدعم آمال خفض الفائدة.
كما تجدر الإشارة: يُعتبر شهر أغسطس تاريخيًا أضعف شهر بالنسبة للبيتكوين، لذا فقدرًا إضافيًا من الحذر هنا أمر معقول. لا يعني ذلك أنه سيتكرر، لكن هذا يُعد سياقًا.
أي جانب تميل إليه: اختراق أم انهيار؟ 👇$BTC
92
سجّل الدخول لاستكشاف المزيد من المُحتوى
انضم إلى مُستخدمي العملات الرقمية حول العالم على Binance Square
⚡️ احصل على أحدث المعلومات المفيدة عن العملات الرقمية.
💬 موثوقة من قبل أكبر منصّة لتداول العملات الرقمية في العالم.
👍 اكتشف الرؤى الحقيقية من صنّاع المُحتوى الموثوقين.
البريد الإلكتروني / رقم الهاتف
المواضيع الرائجة
AnthropicCEOCallsForAISlowdown
8,575 مشاهدات
208 يقومون بالنقاش
#AnthropicCEOCallsForAISlowdown يدعو الرئيس التنفيذي لشركة أنثروبيك إلى إبطاء وتيرة تطوير الذكاء الاصطناعي
تتسارع سباق تطوير الذكاء الاصطناعي بوتيرة مذهلة، لكن الرئيس التنفيذي لشركة أنثروبيك يدعو إلى اتباع نهج أكثر حذرًا. 🤖⚠️
الرسالة بسيطة: لا ينبغي أن يأتي الابتكار على حساب السلامة. ومع ازدياد قوة نماذج الذكاء الاصطناعي، قد تحتاج الشركات إلى اختبارات أقوى وحواجز حماية وضمانات للاستخدام المسؤول قبل دفع الحدود أكثر من ذلك.
يمكن للذكاء الاصطناعي أن يحوّل الصناعات والأسواق والحياة اليومية — لكن كلما تطور بشكل أسرع، أصبحت أهمية التطوير المسؤول أكبر. 🌍🧠$LSK
$VOD.US
Crypto_With_Kinza
·0 إعجاب
·8 مشاهدات
AnthropicChoosesNasdaqForPotentialIPO
0 مشاهدات
21 يقومون بالنقاش
SECReceivesGrayscaleLitecoinTrustETFFiling
122,767 مشاهدات
1,747 يقومون بالنقاش