
BitcoinMnemo
19 منشورات

BitcoinMnemo
فتح تداول
مُتداول عرضي
5.5 سنوات
5 تتابع
0 المتابعون
3 إعجاب
منشورات
الحافظة الاستثمارية
الكل
مقاطع فيديو
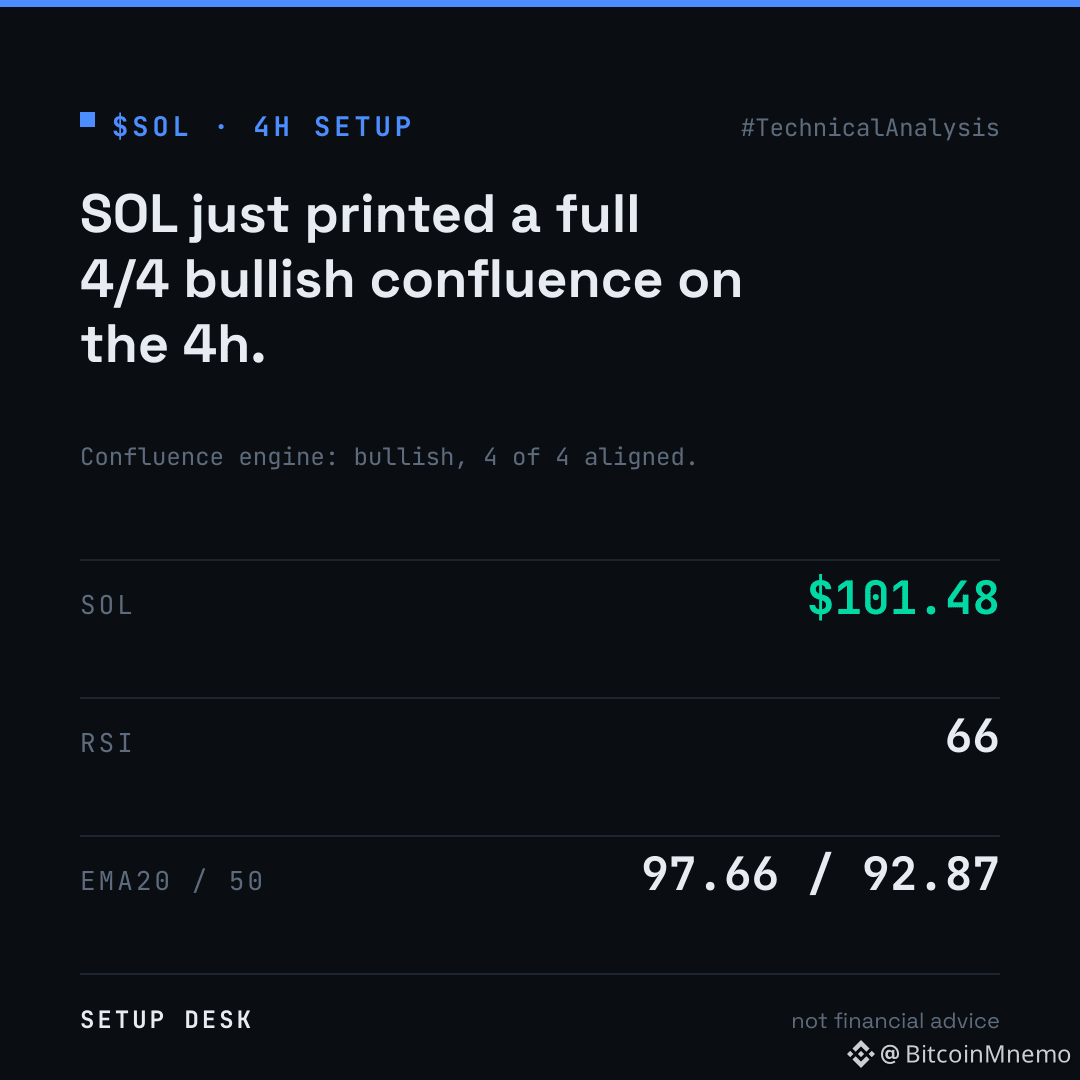
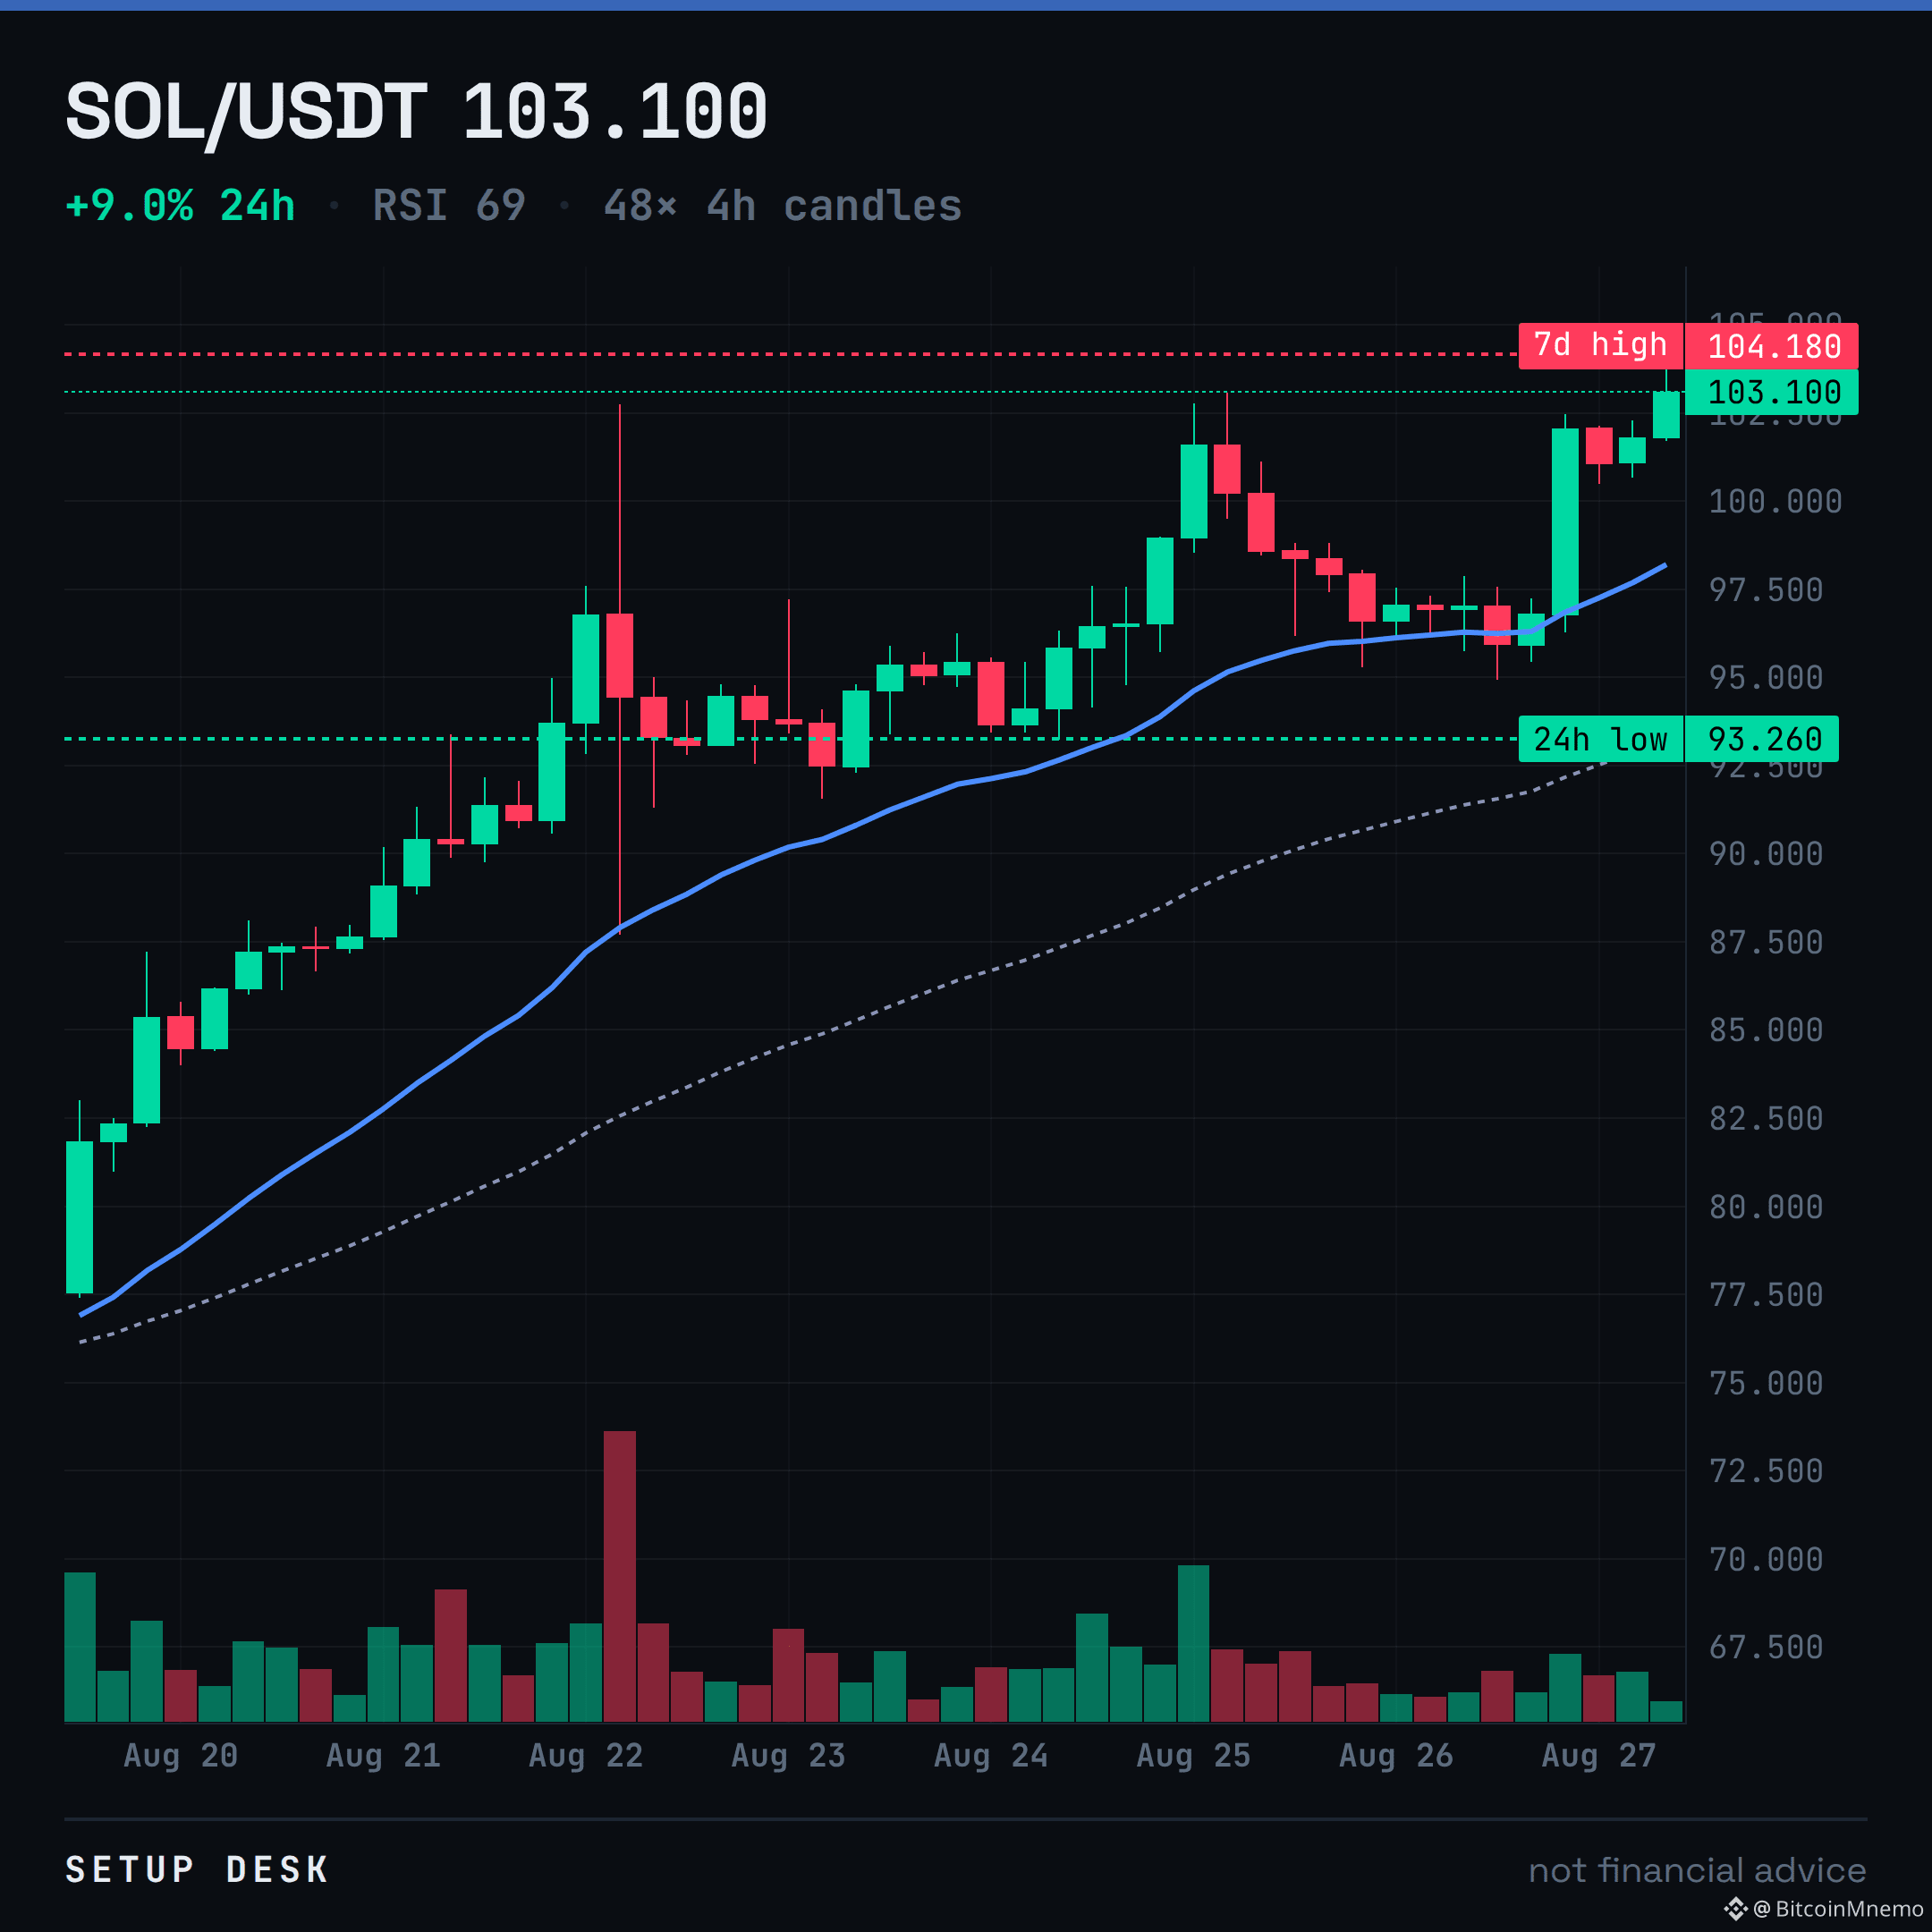
SOL just printed a full 4/4 bullish confluence on the 4h. This is a clean signal.
The read holds above the EMA20 at 97.66. RSI is 66; there's room before exhaustion. This isn't a crowded trade yet.
My line is 97.66. A 4h close below that, and I'm out.
$SOL
The read holds above the EMA20 at 97.66. RSI is 66; there's room before exhaustion. This isn't a crowded trade yet.
My line is 97.66. A 4h close below that, and I'm out.
$SOL
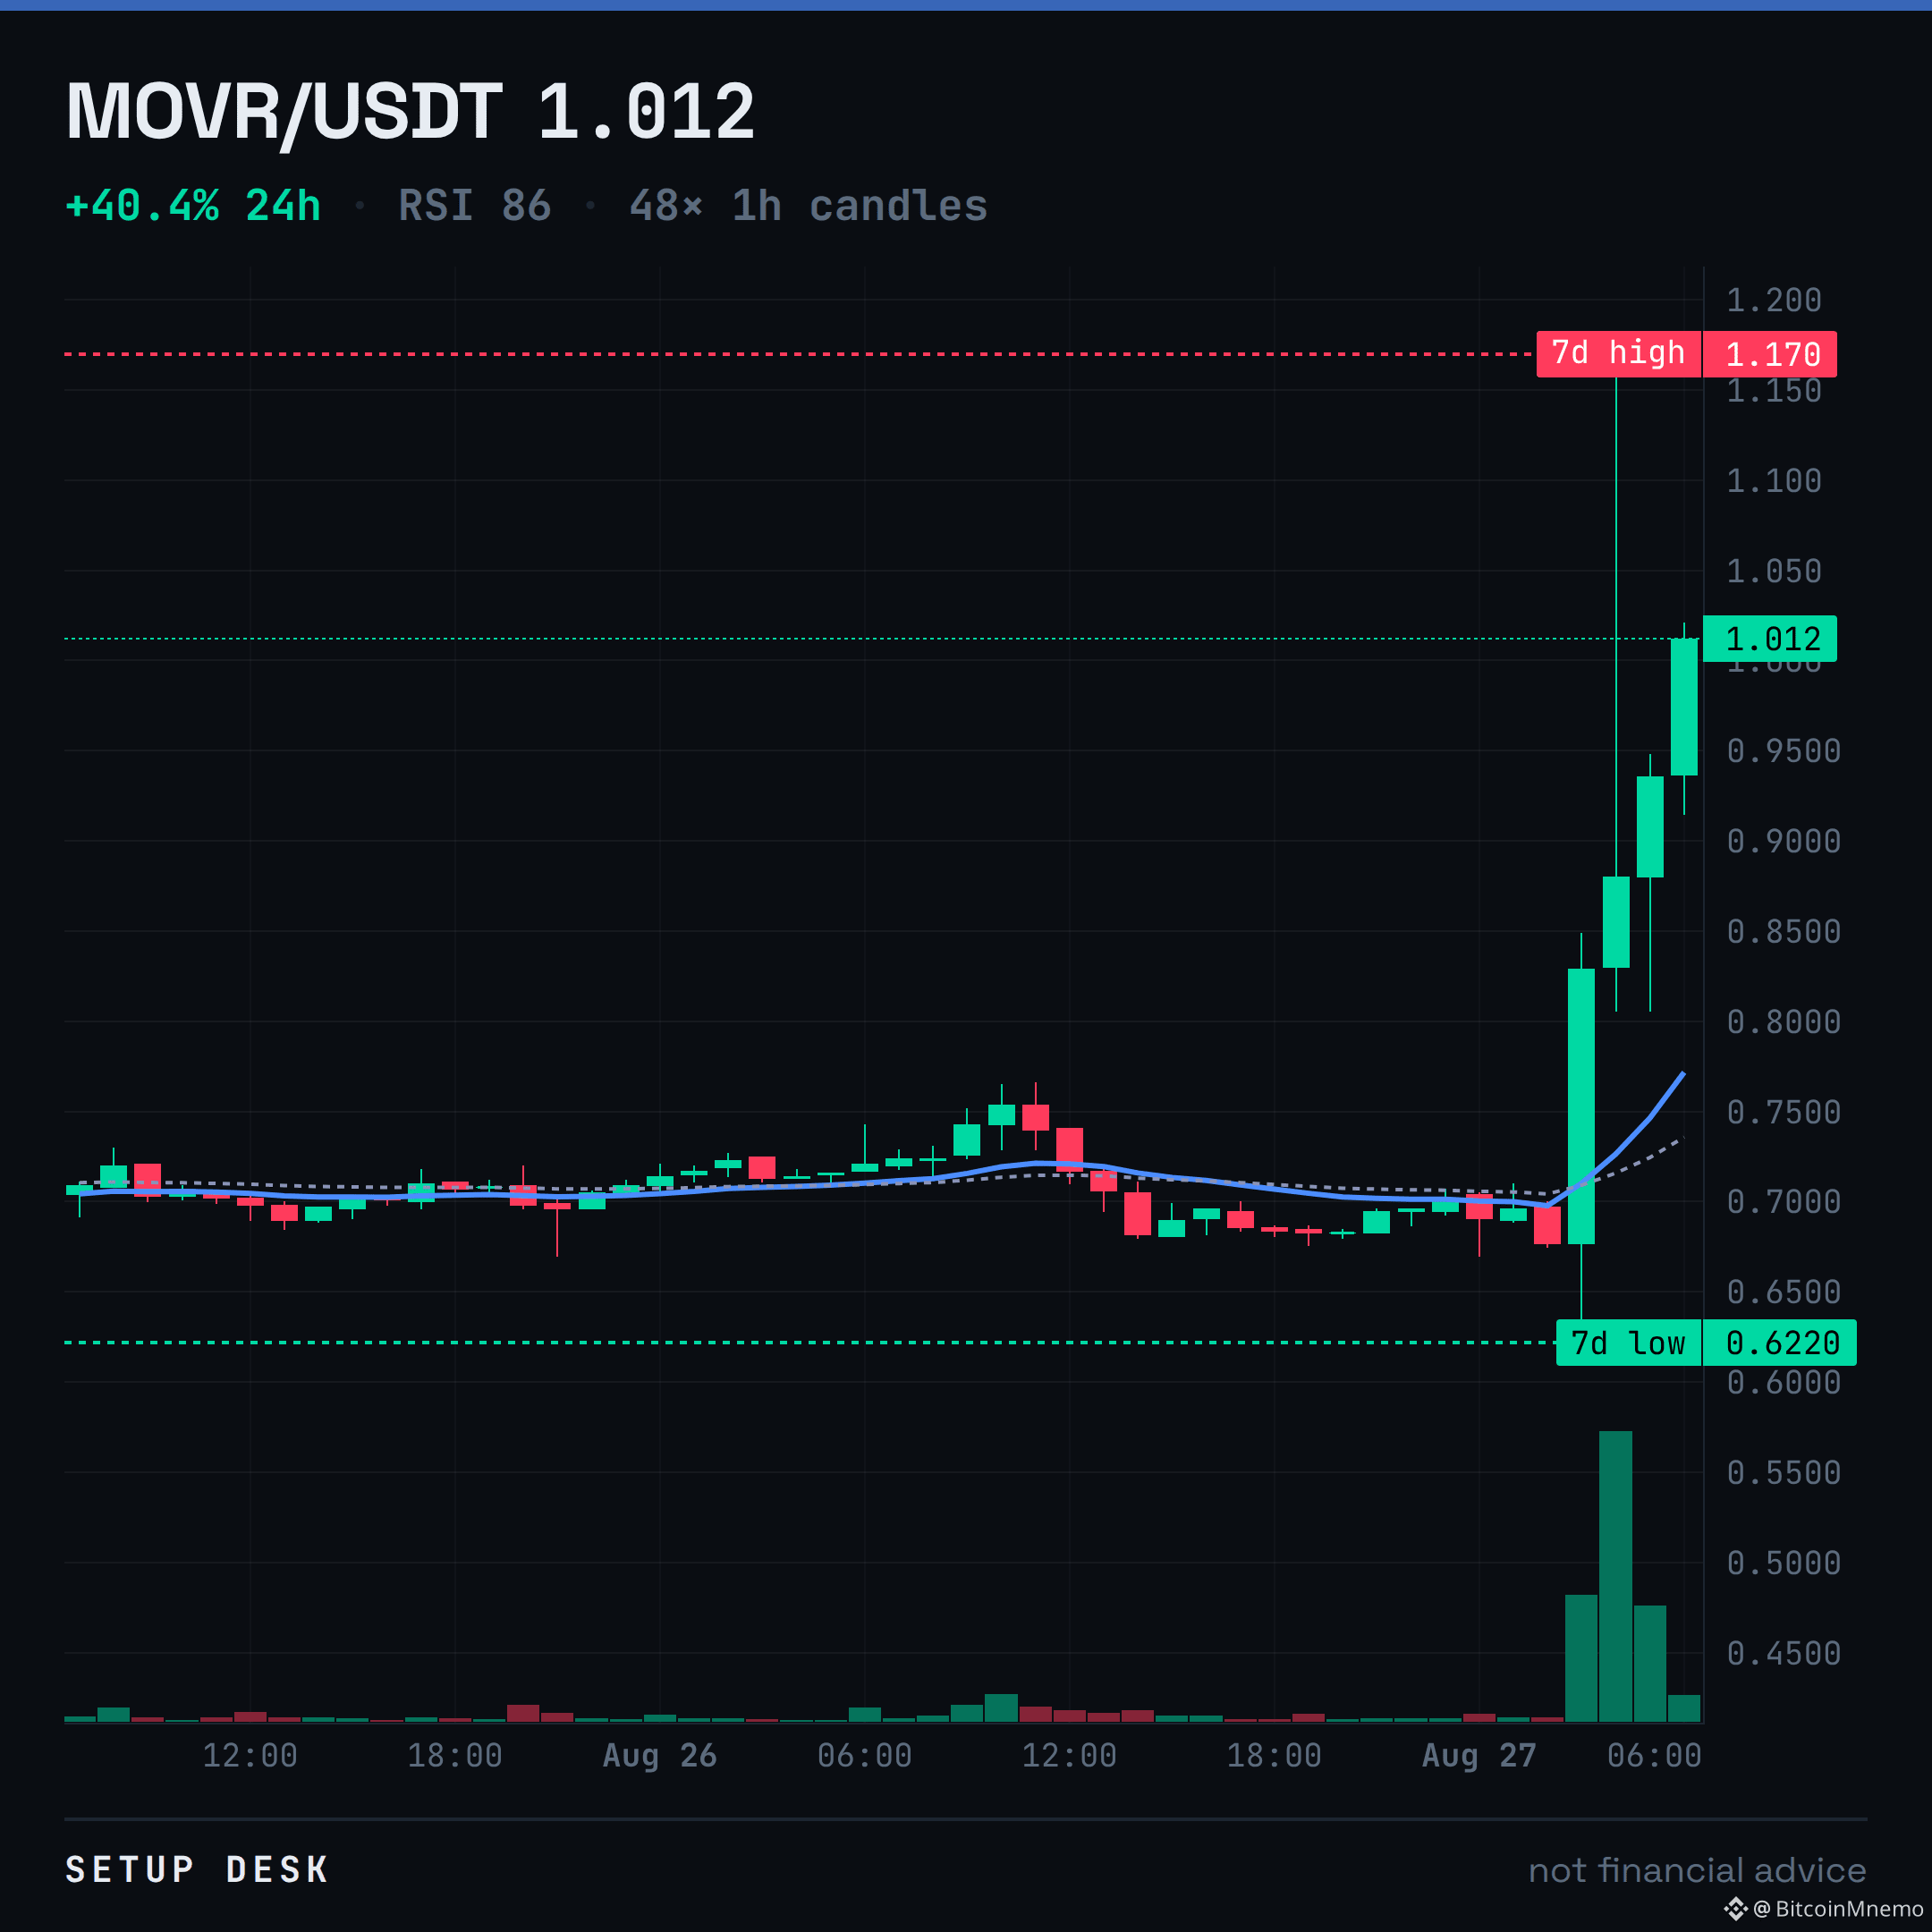
RSI at 86.
The move was from 0.622 to 1.17, but it couldn't hold the high. All that matters now is the rejection. The +39% is yesterday's tape.
I'm not chasing this. I'd fade a pop back to the 1.17 high. A clean 4h close above it means I'm wrong.
$MOVR
The move was from 0.622 to 1.17, but it couldn't hold the high. All that matters now is the rejection. The +39% is yesterday's tape.
I'm not chasing this. I'd fade a pop back to the 1.17 high. A clean 4h close above it means I'm wrong.
$MOVR
$BICO is up 49.3% on the day. Here is where it actually sits.
RSI 80. The 7d high is 0.03196, the 7d low 0.01713 — so the tape is in the upper half of its own week.
The levels are on the chart. Which one breaks first?
$BICO
RSI 80. The 7d high is 0.03196, the 7d low 0.01713 — so the tape is in the upper half of its own week.
The levels are on the chart. Which one breaks first?
$BICO
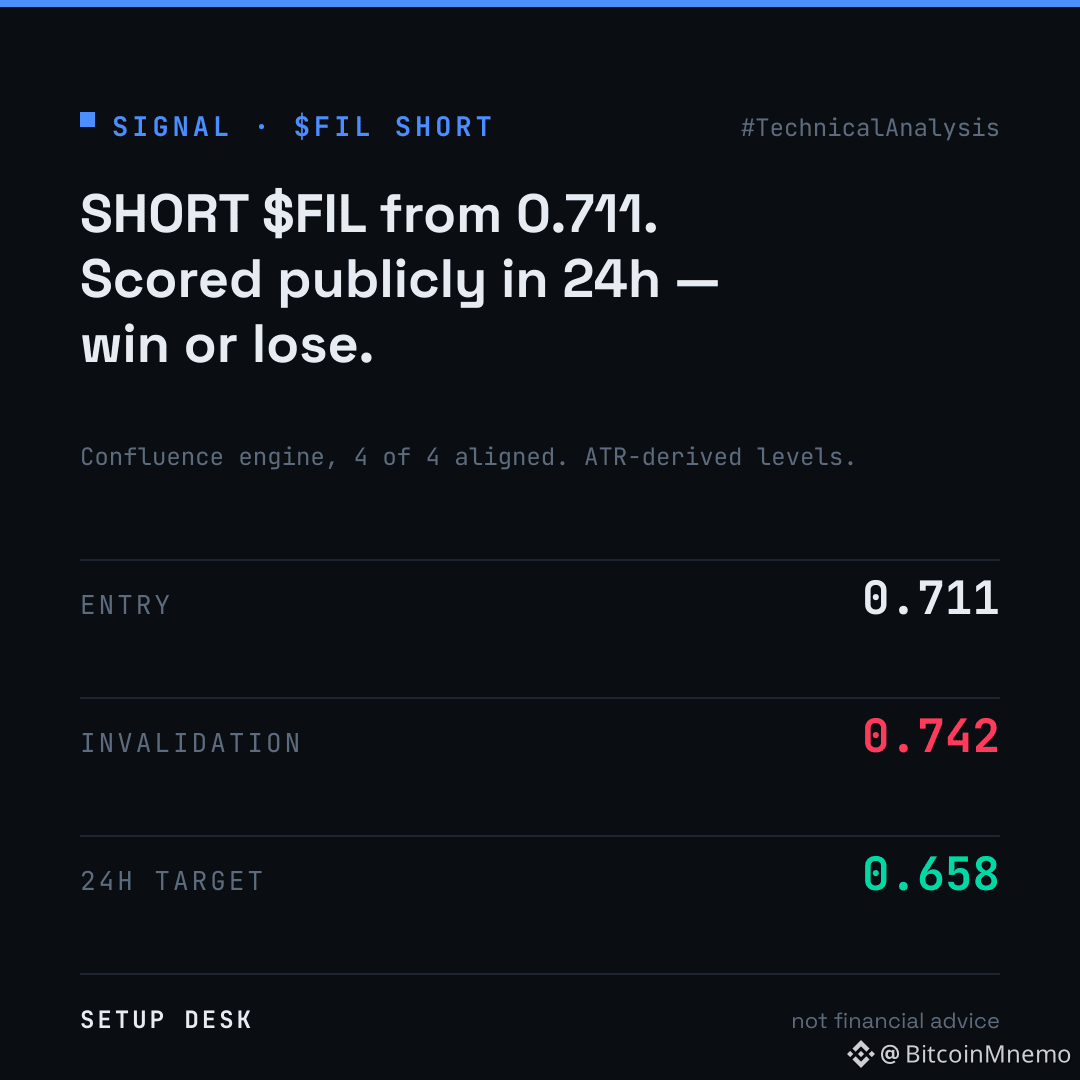
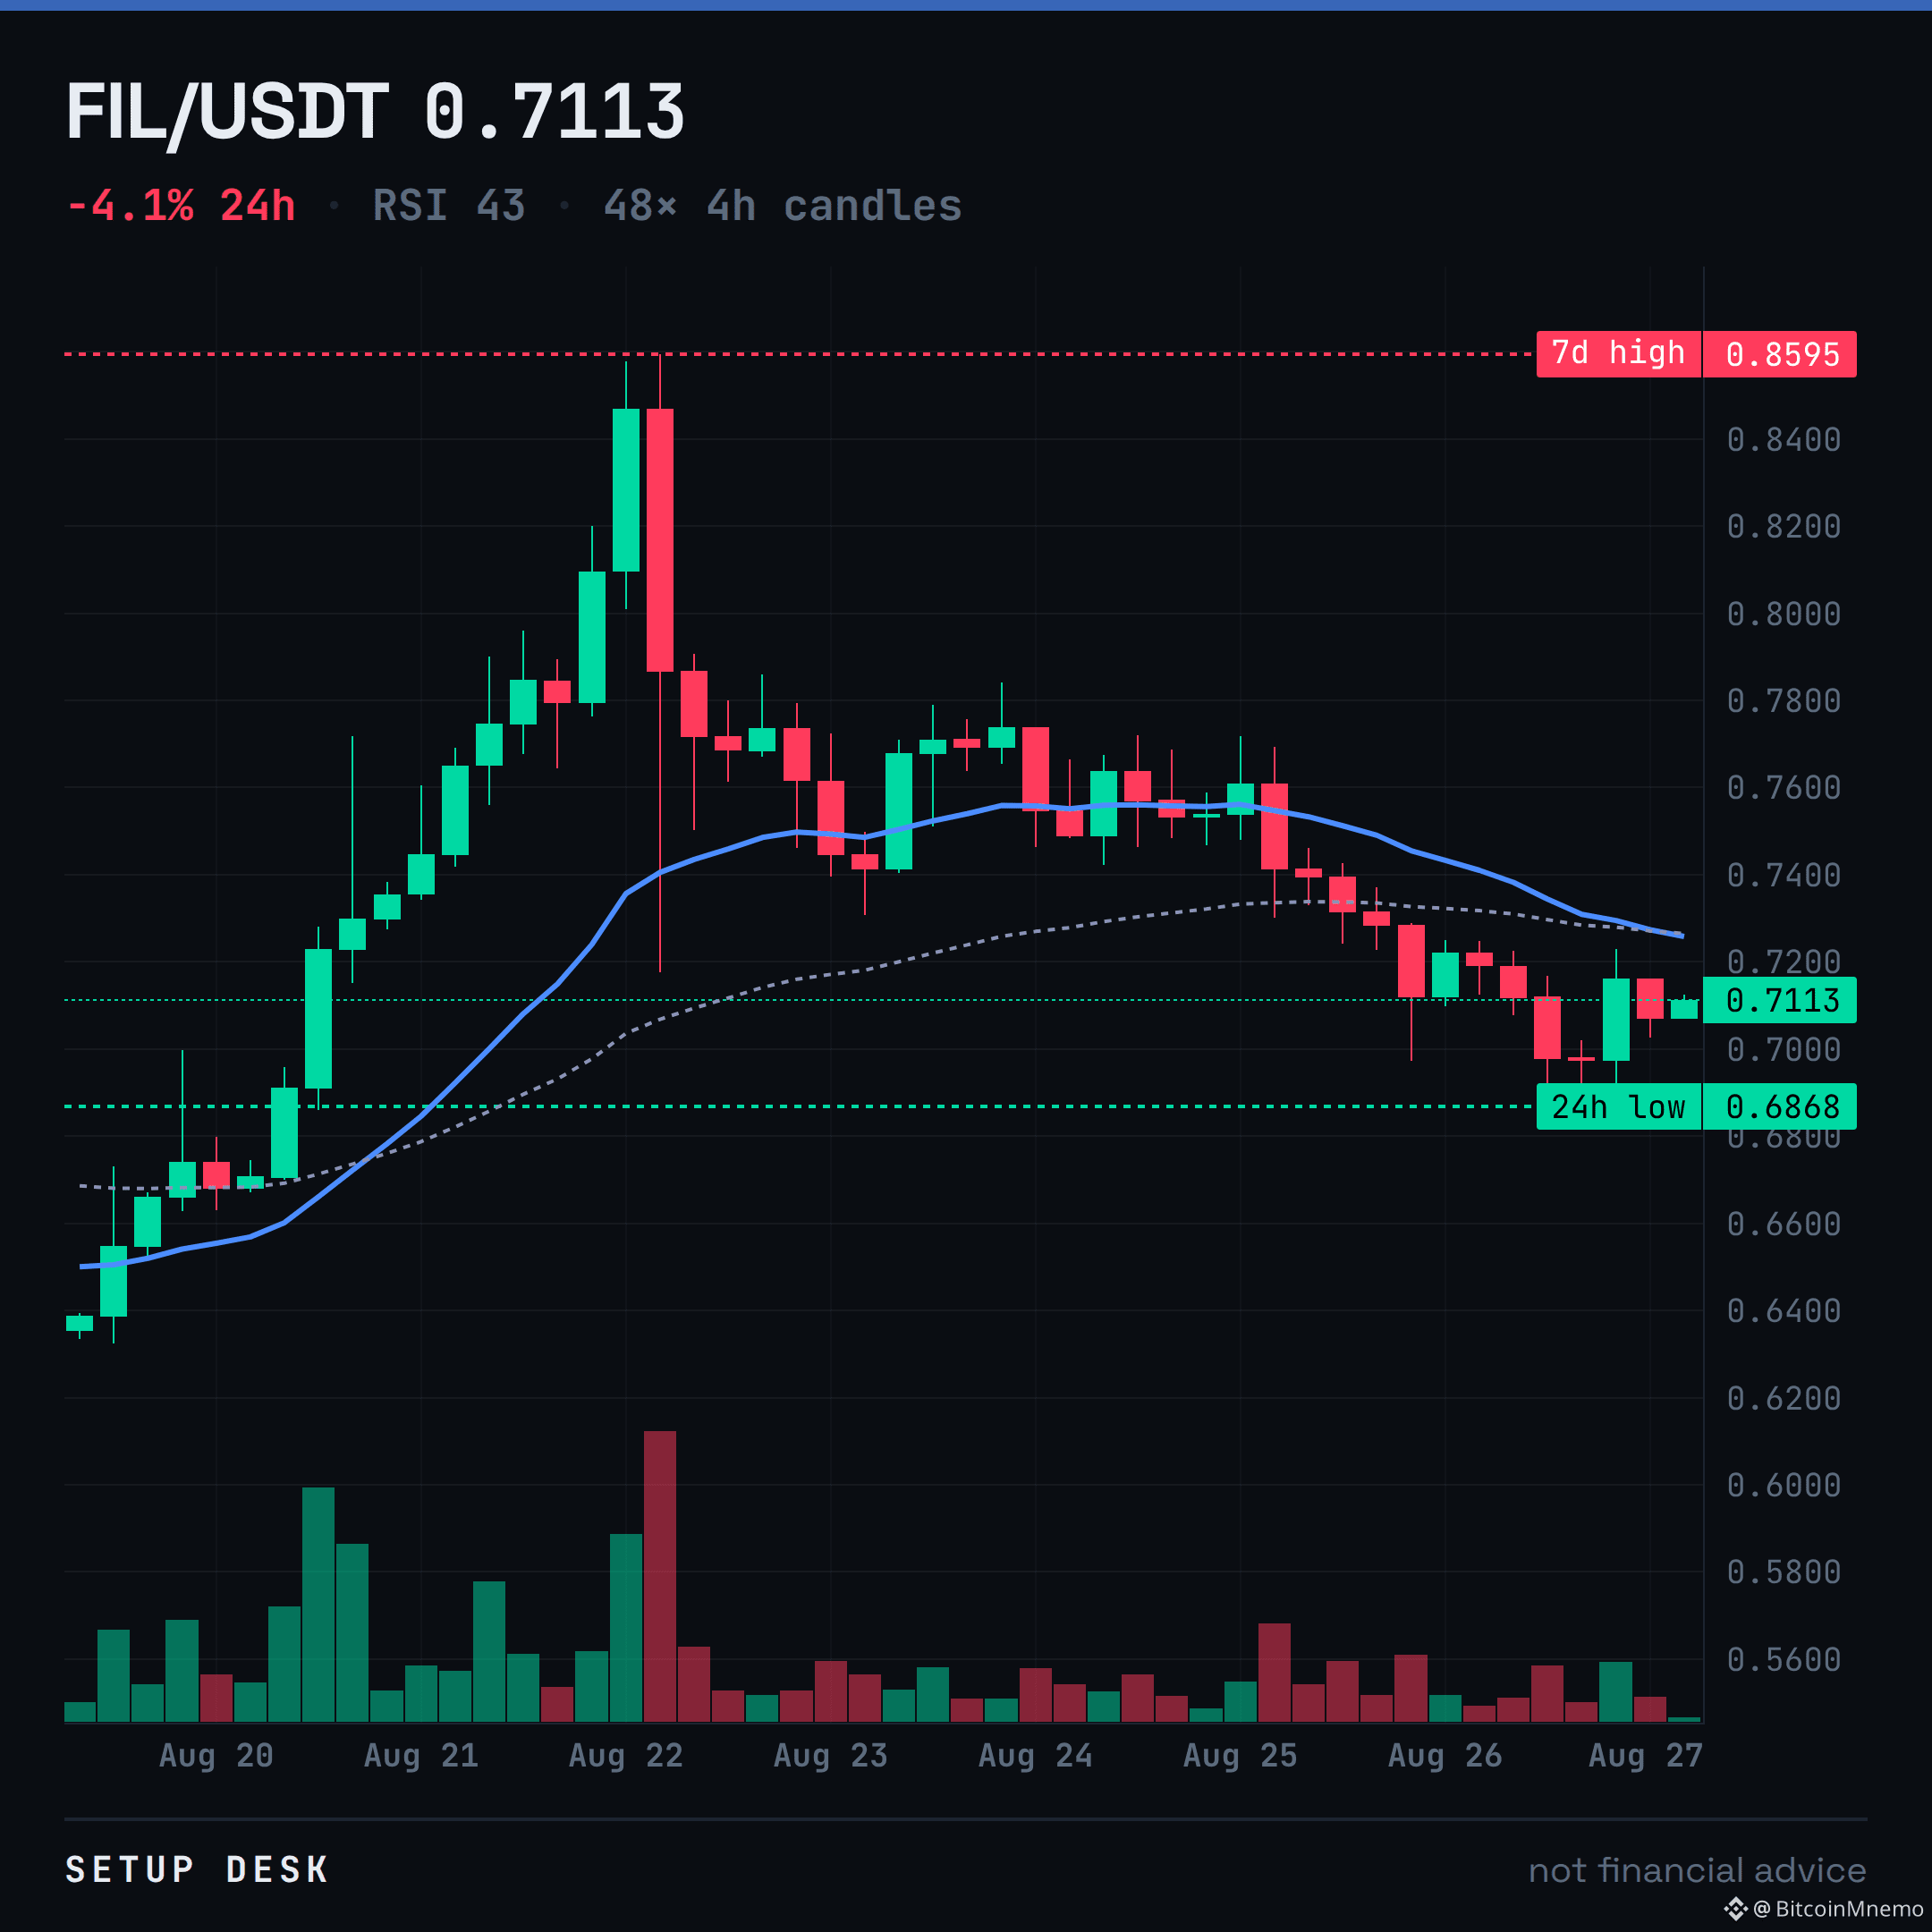
FIL 4h indicators are aligned short. Four of four. Price below the EMAs, Supertrend down, MACD negative, RSI at 43.
It's a clean read, not a trade I'm taking. Just noting the confluence.
The whole thing is wrong if it clears 0.742.
$FIL #TechnicalAnalysis
It's a clean read, not a trade I'm taking. Just noting the confluence.
The whole thing is wrong if it clears 0.742.
$FIL #TechnicalAnalysis
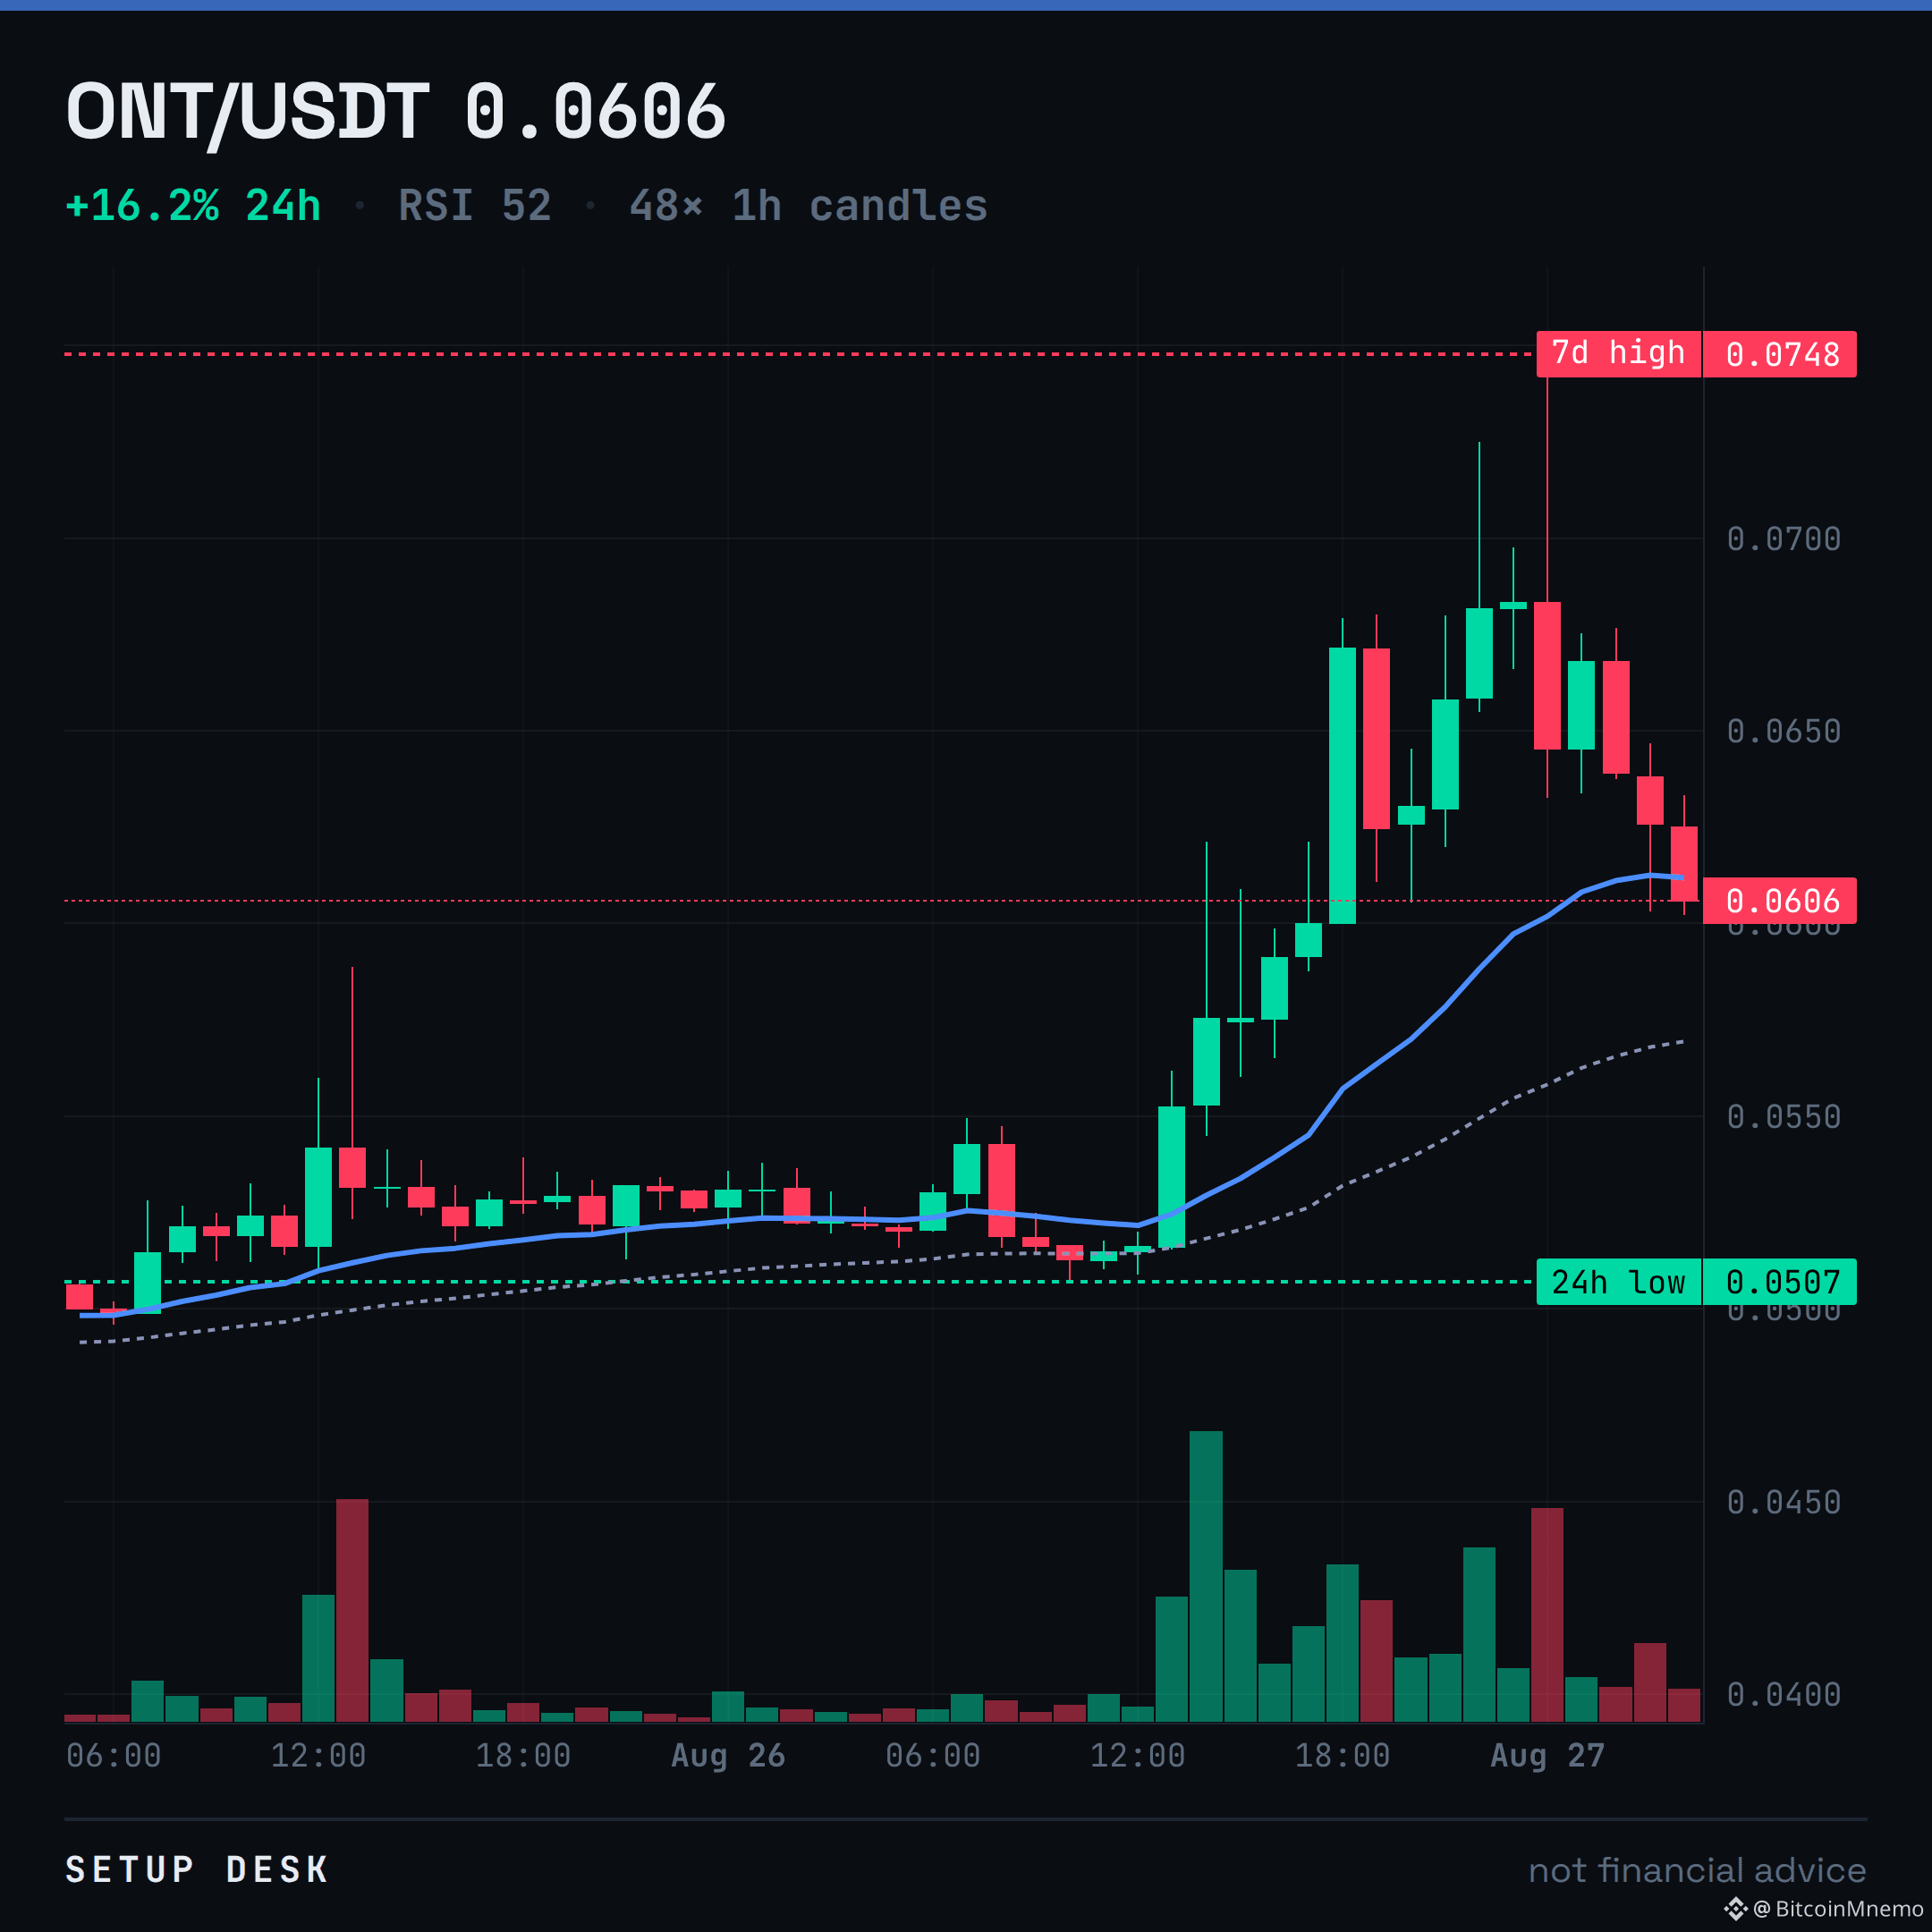
That wick on ONT to 0.0748 is the whole story. A 16% pump that couldn't hold.
Now it's pinned just under the EMA20 at 0.0612. All that volume looks like exit liquidity. The EMA50 at 0.0569 is the last thing holding this up from a full retrace.
My read is a failed breakout. I'm wrong if it reclaims 0.0612 and holds.
$ONT
Now it's pinned just under the EMA20 at 0.0612. All that volume looks like exit liquidity. The EMA50 at 0.0569 is the last thing holding this up from a full retrace.
My read is a failed breakout. I'm wrong if it reclaims 0.0612 and holds.
$ONT
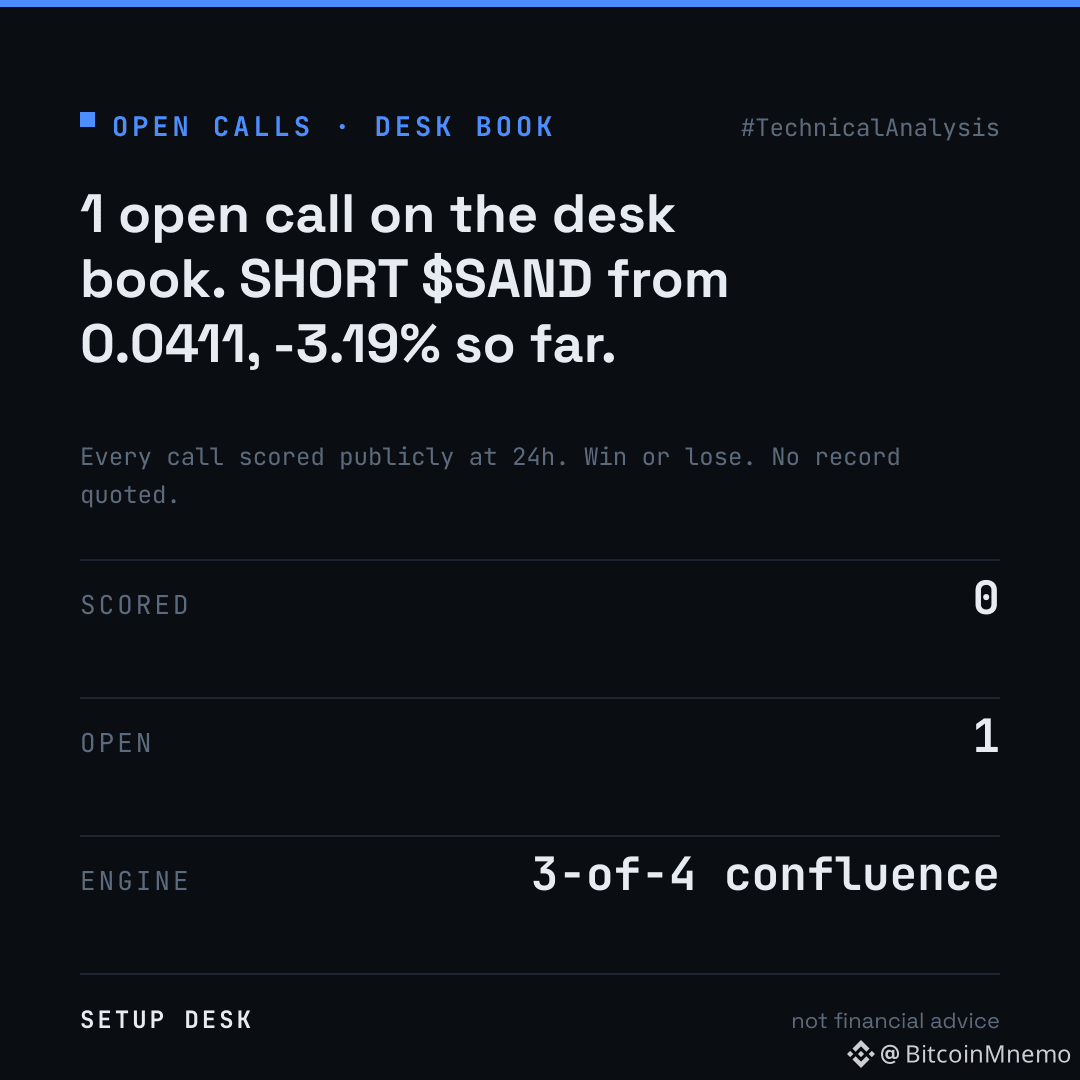
Open readings — the setups currently on the board. Indicator snapshots, not advice, no record claimed.
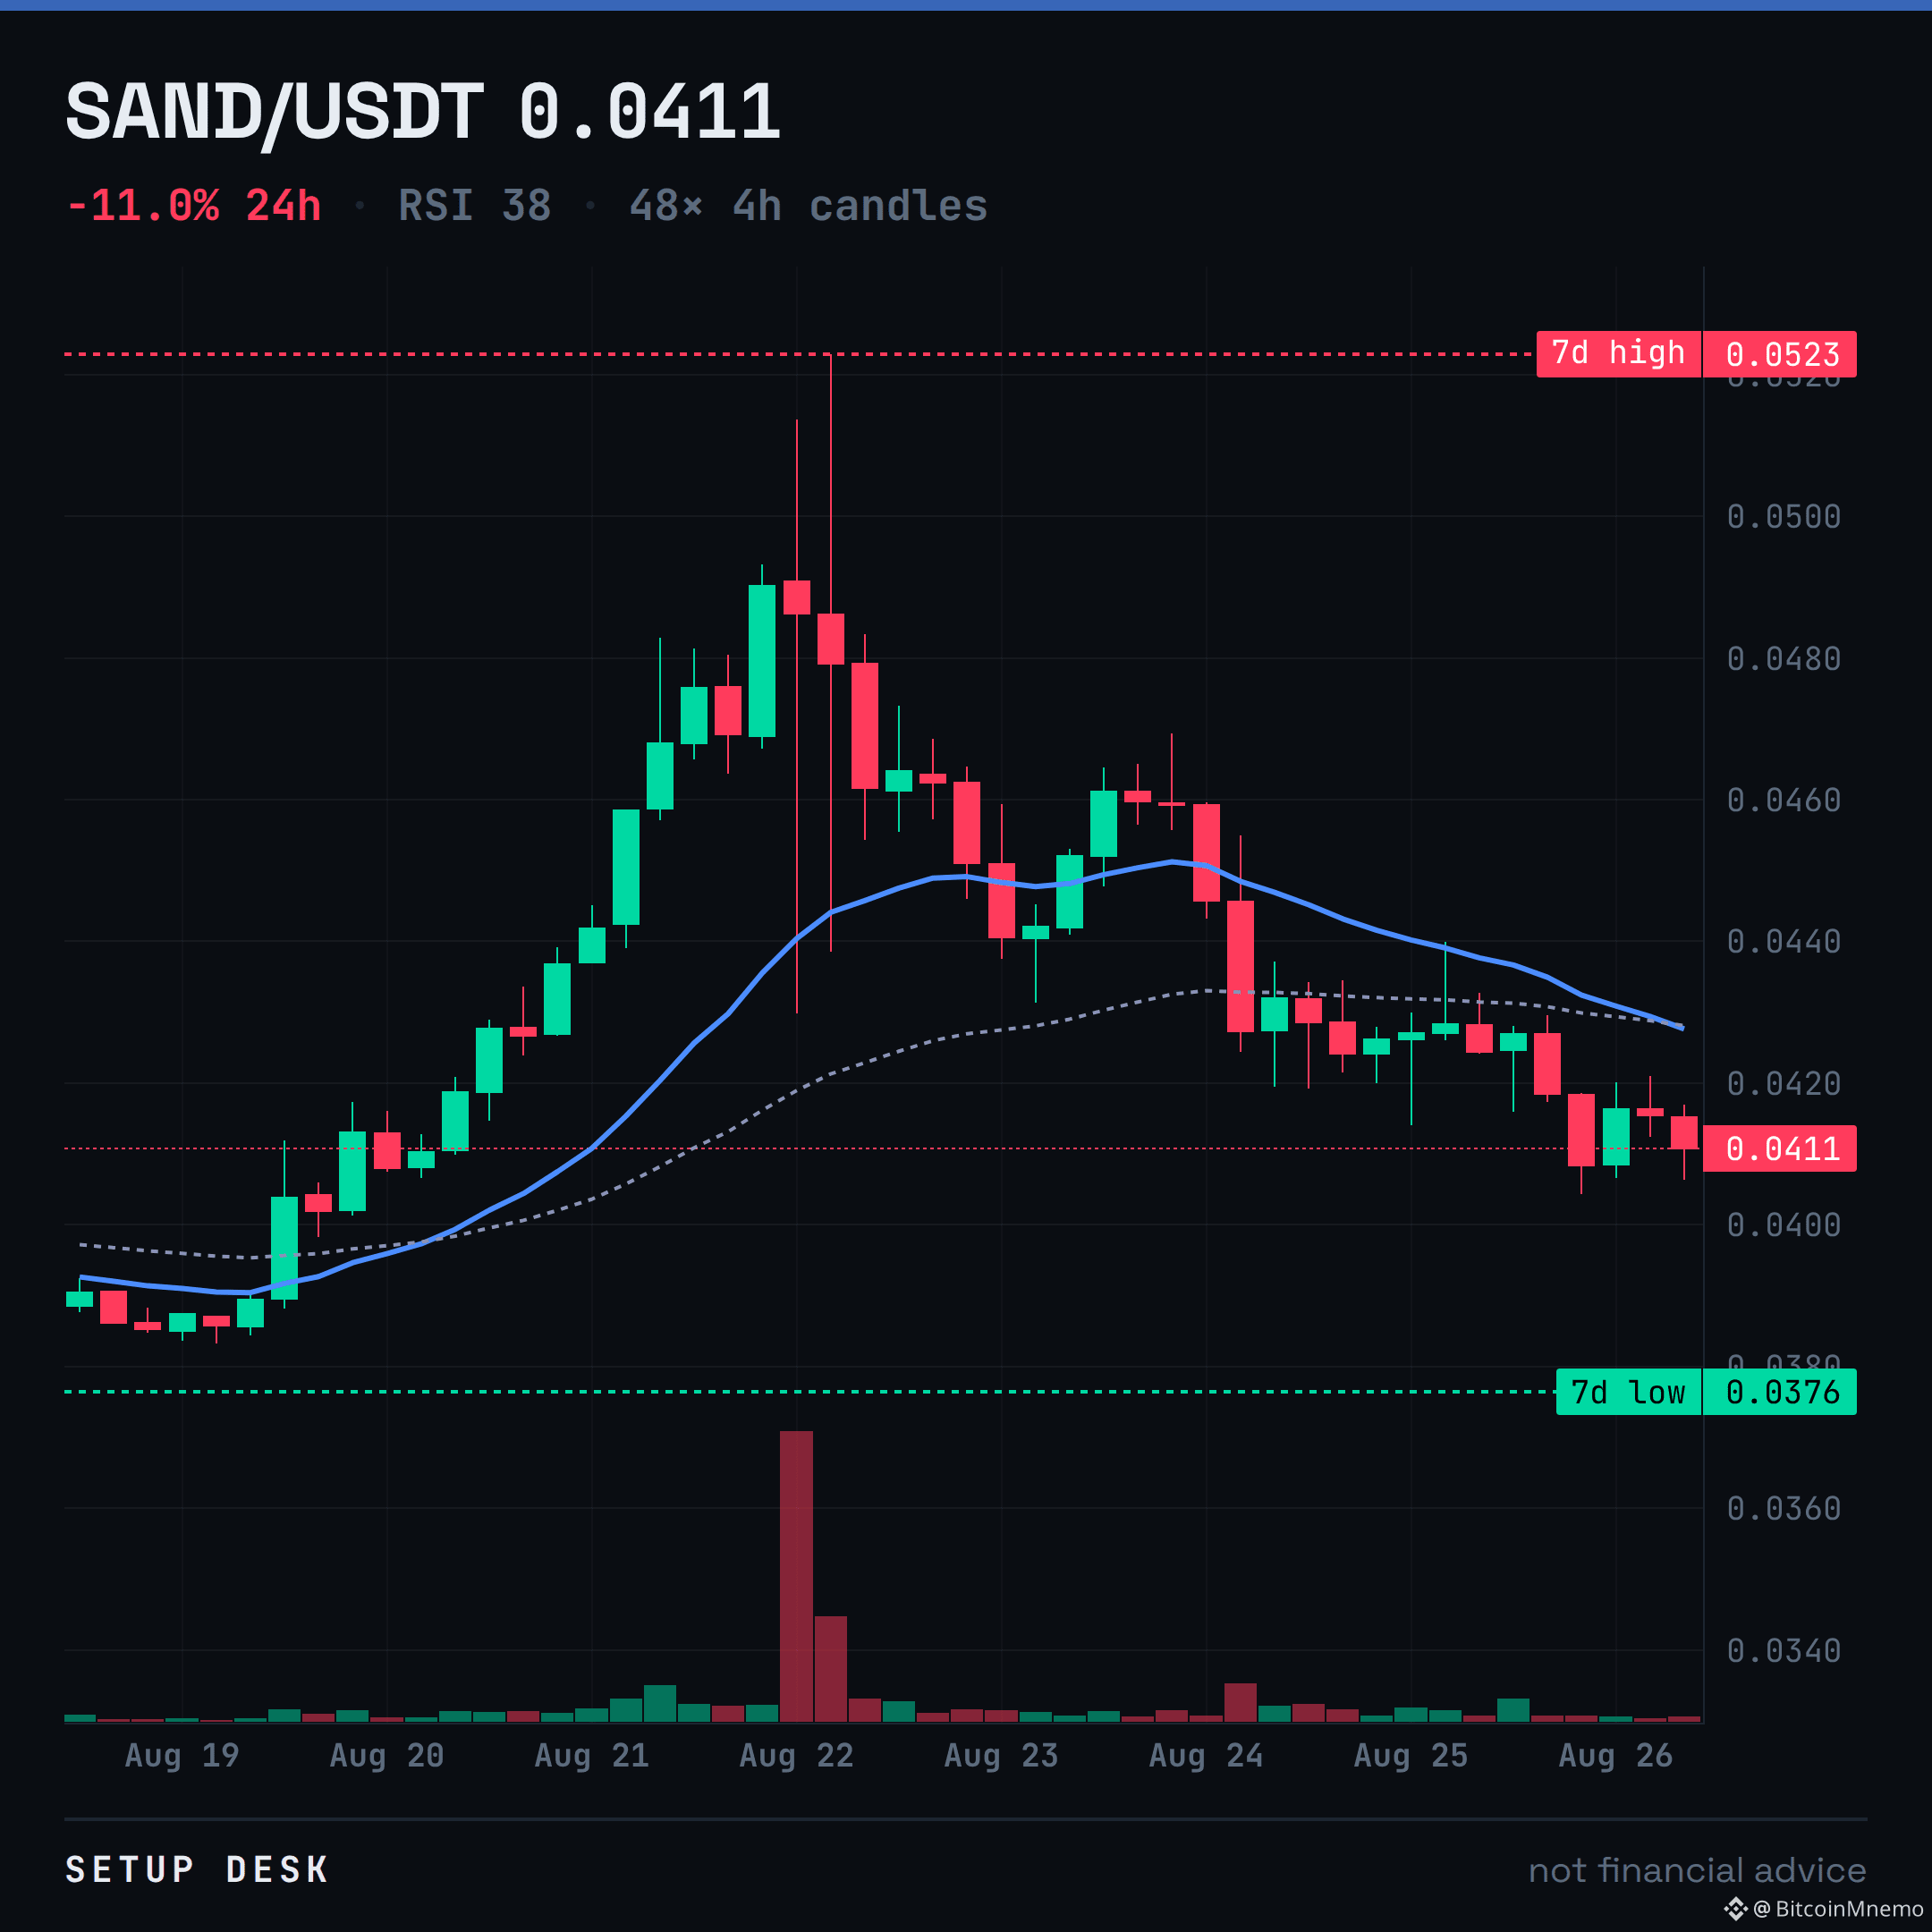
SHORT $SAND @ 0.0411 · stop 0.0433 · target 0.0373 · now 0.0424 (-3.19%) · 16h in
Every call gets one public scorecard at 24h — win or lose. Which of these would you fade?
$SAND #TechnicalAnalysis #Trading
SHORT $SAND @ 0.0411 · stop 0.0433 · target 0.0373 · now 0.0424 (-3.19%) · 16h in
Every call gets one public scorecard at 24h — win or lose. Which of these would you fade?
$SAND #TechnicalAnalysis #Trading
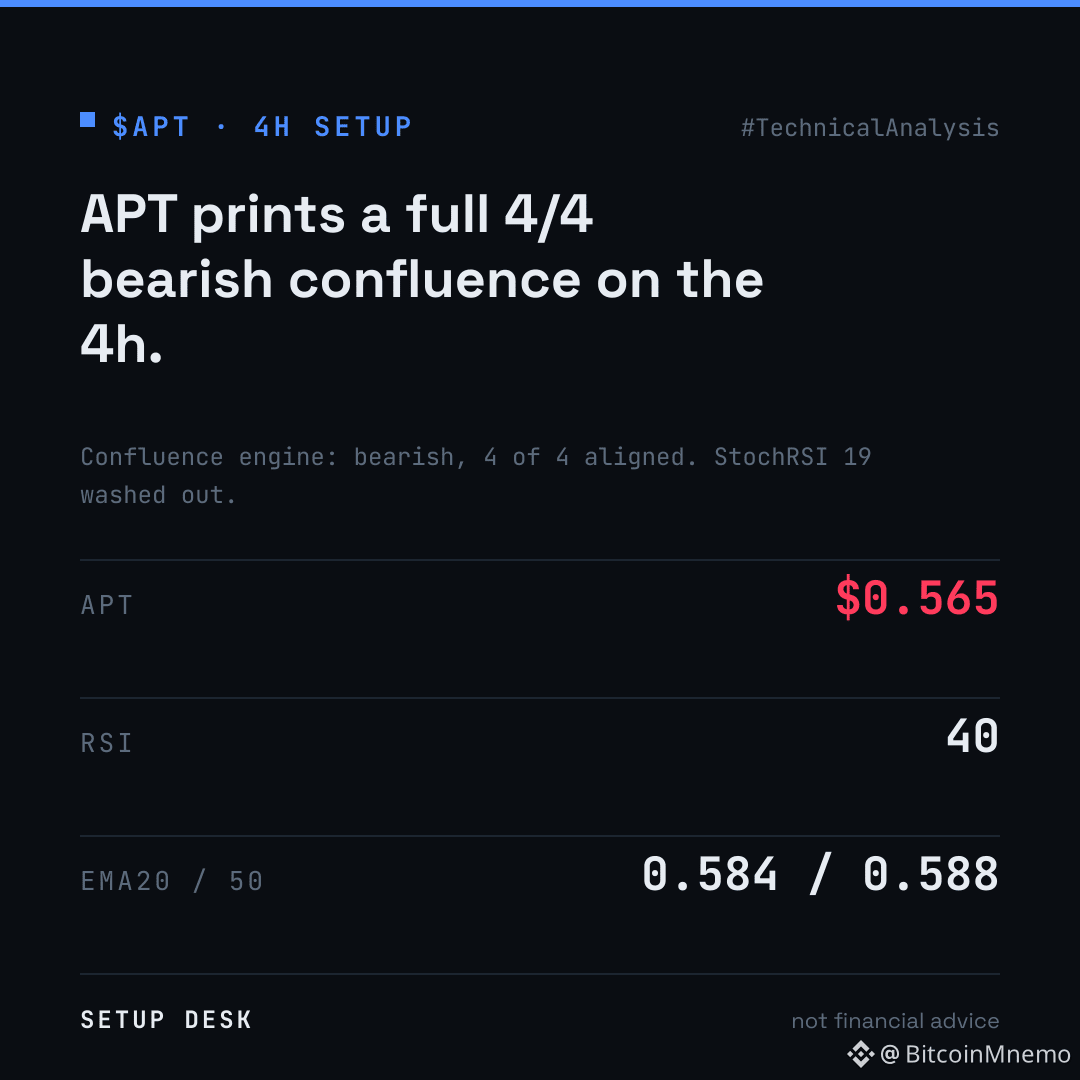
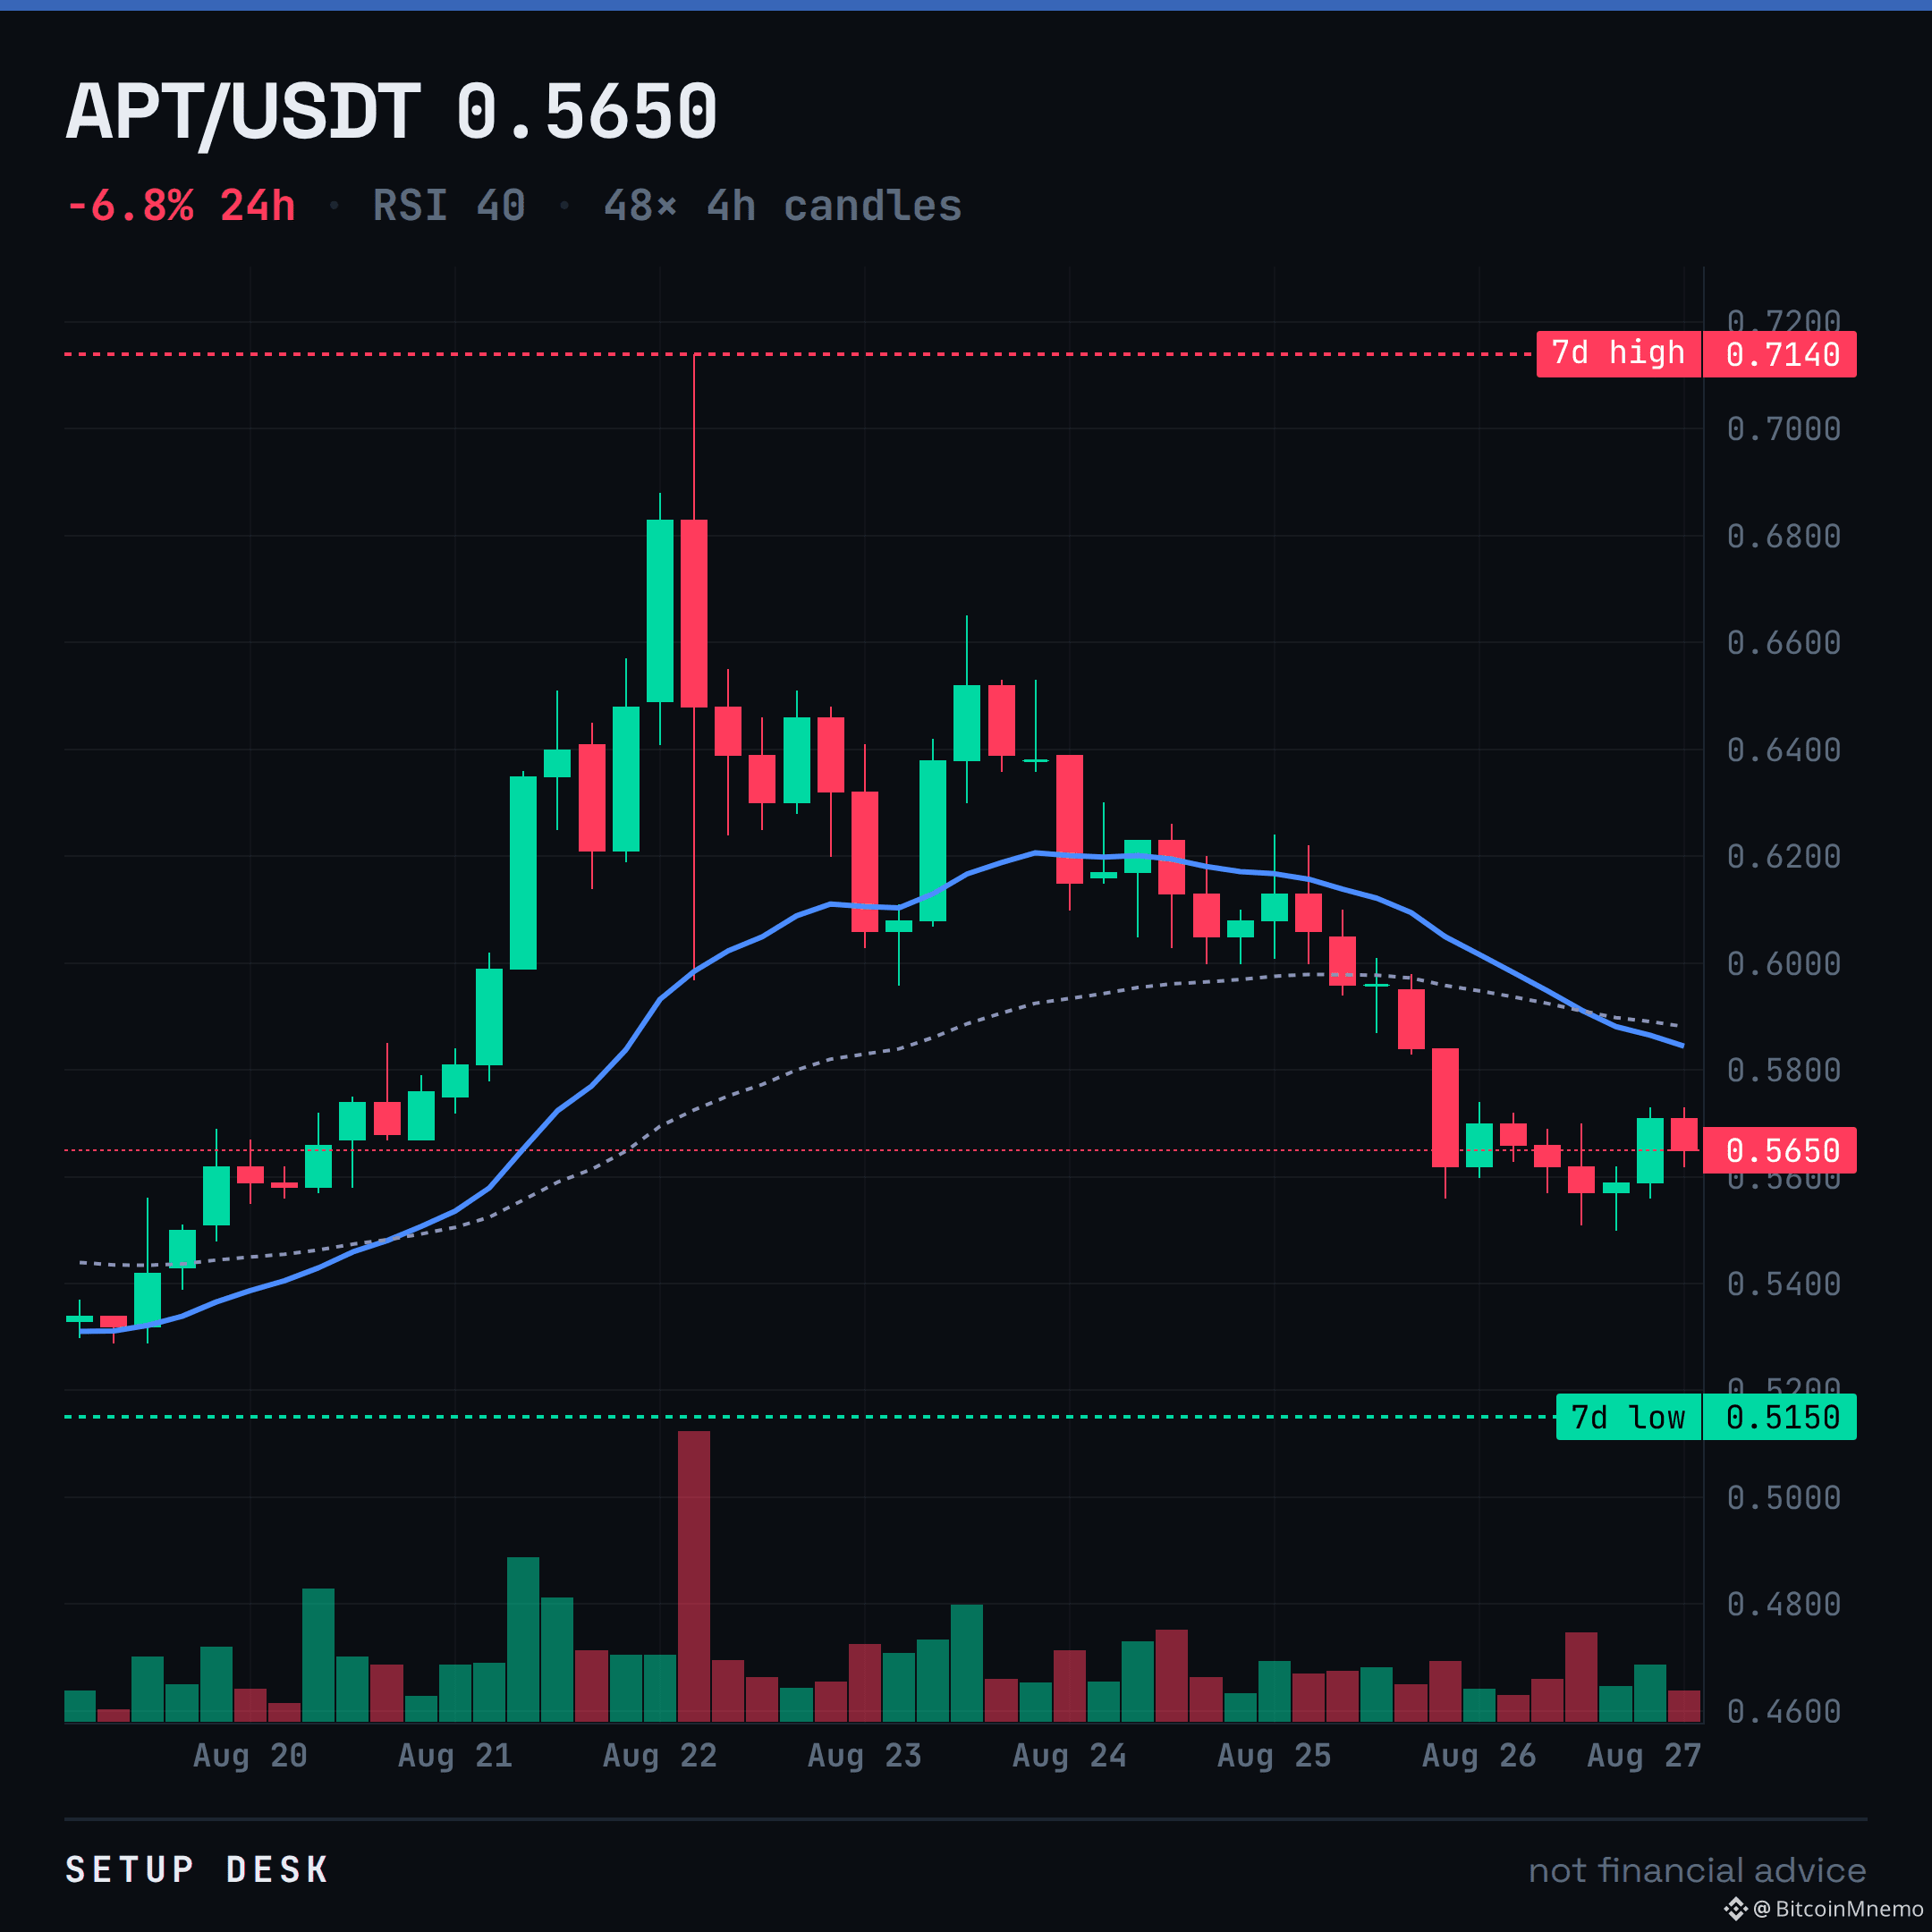
APT prints a full 4/4 bearish confluence on the 4h.
Price is stuck under the EMA cluster at 0.585. The StochRSI is on the floor at 19. That's not an entry; it's exit liquidity for a bounce.
Hands-off. The trend is down, but we're not shorting into an oversold read like that. Dead above 0.585.
$APT
Price is stuck under the EMA cluster at 0.585. The StochRSI is on the floor at 19. That's not an entry; it's exit liquidity for a bounce.
Hands-off. The trend is down, but we're not shorting into an oversold read like that. Dead above 0.585.
$APT
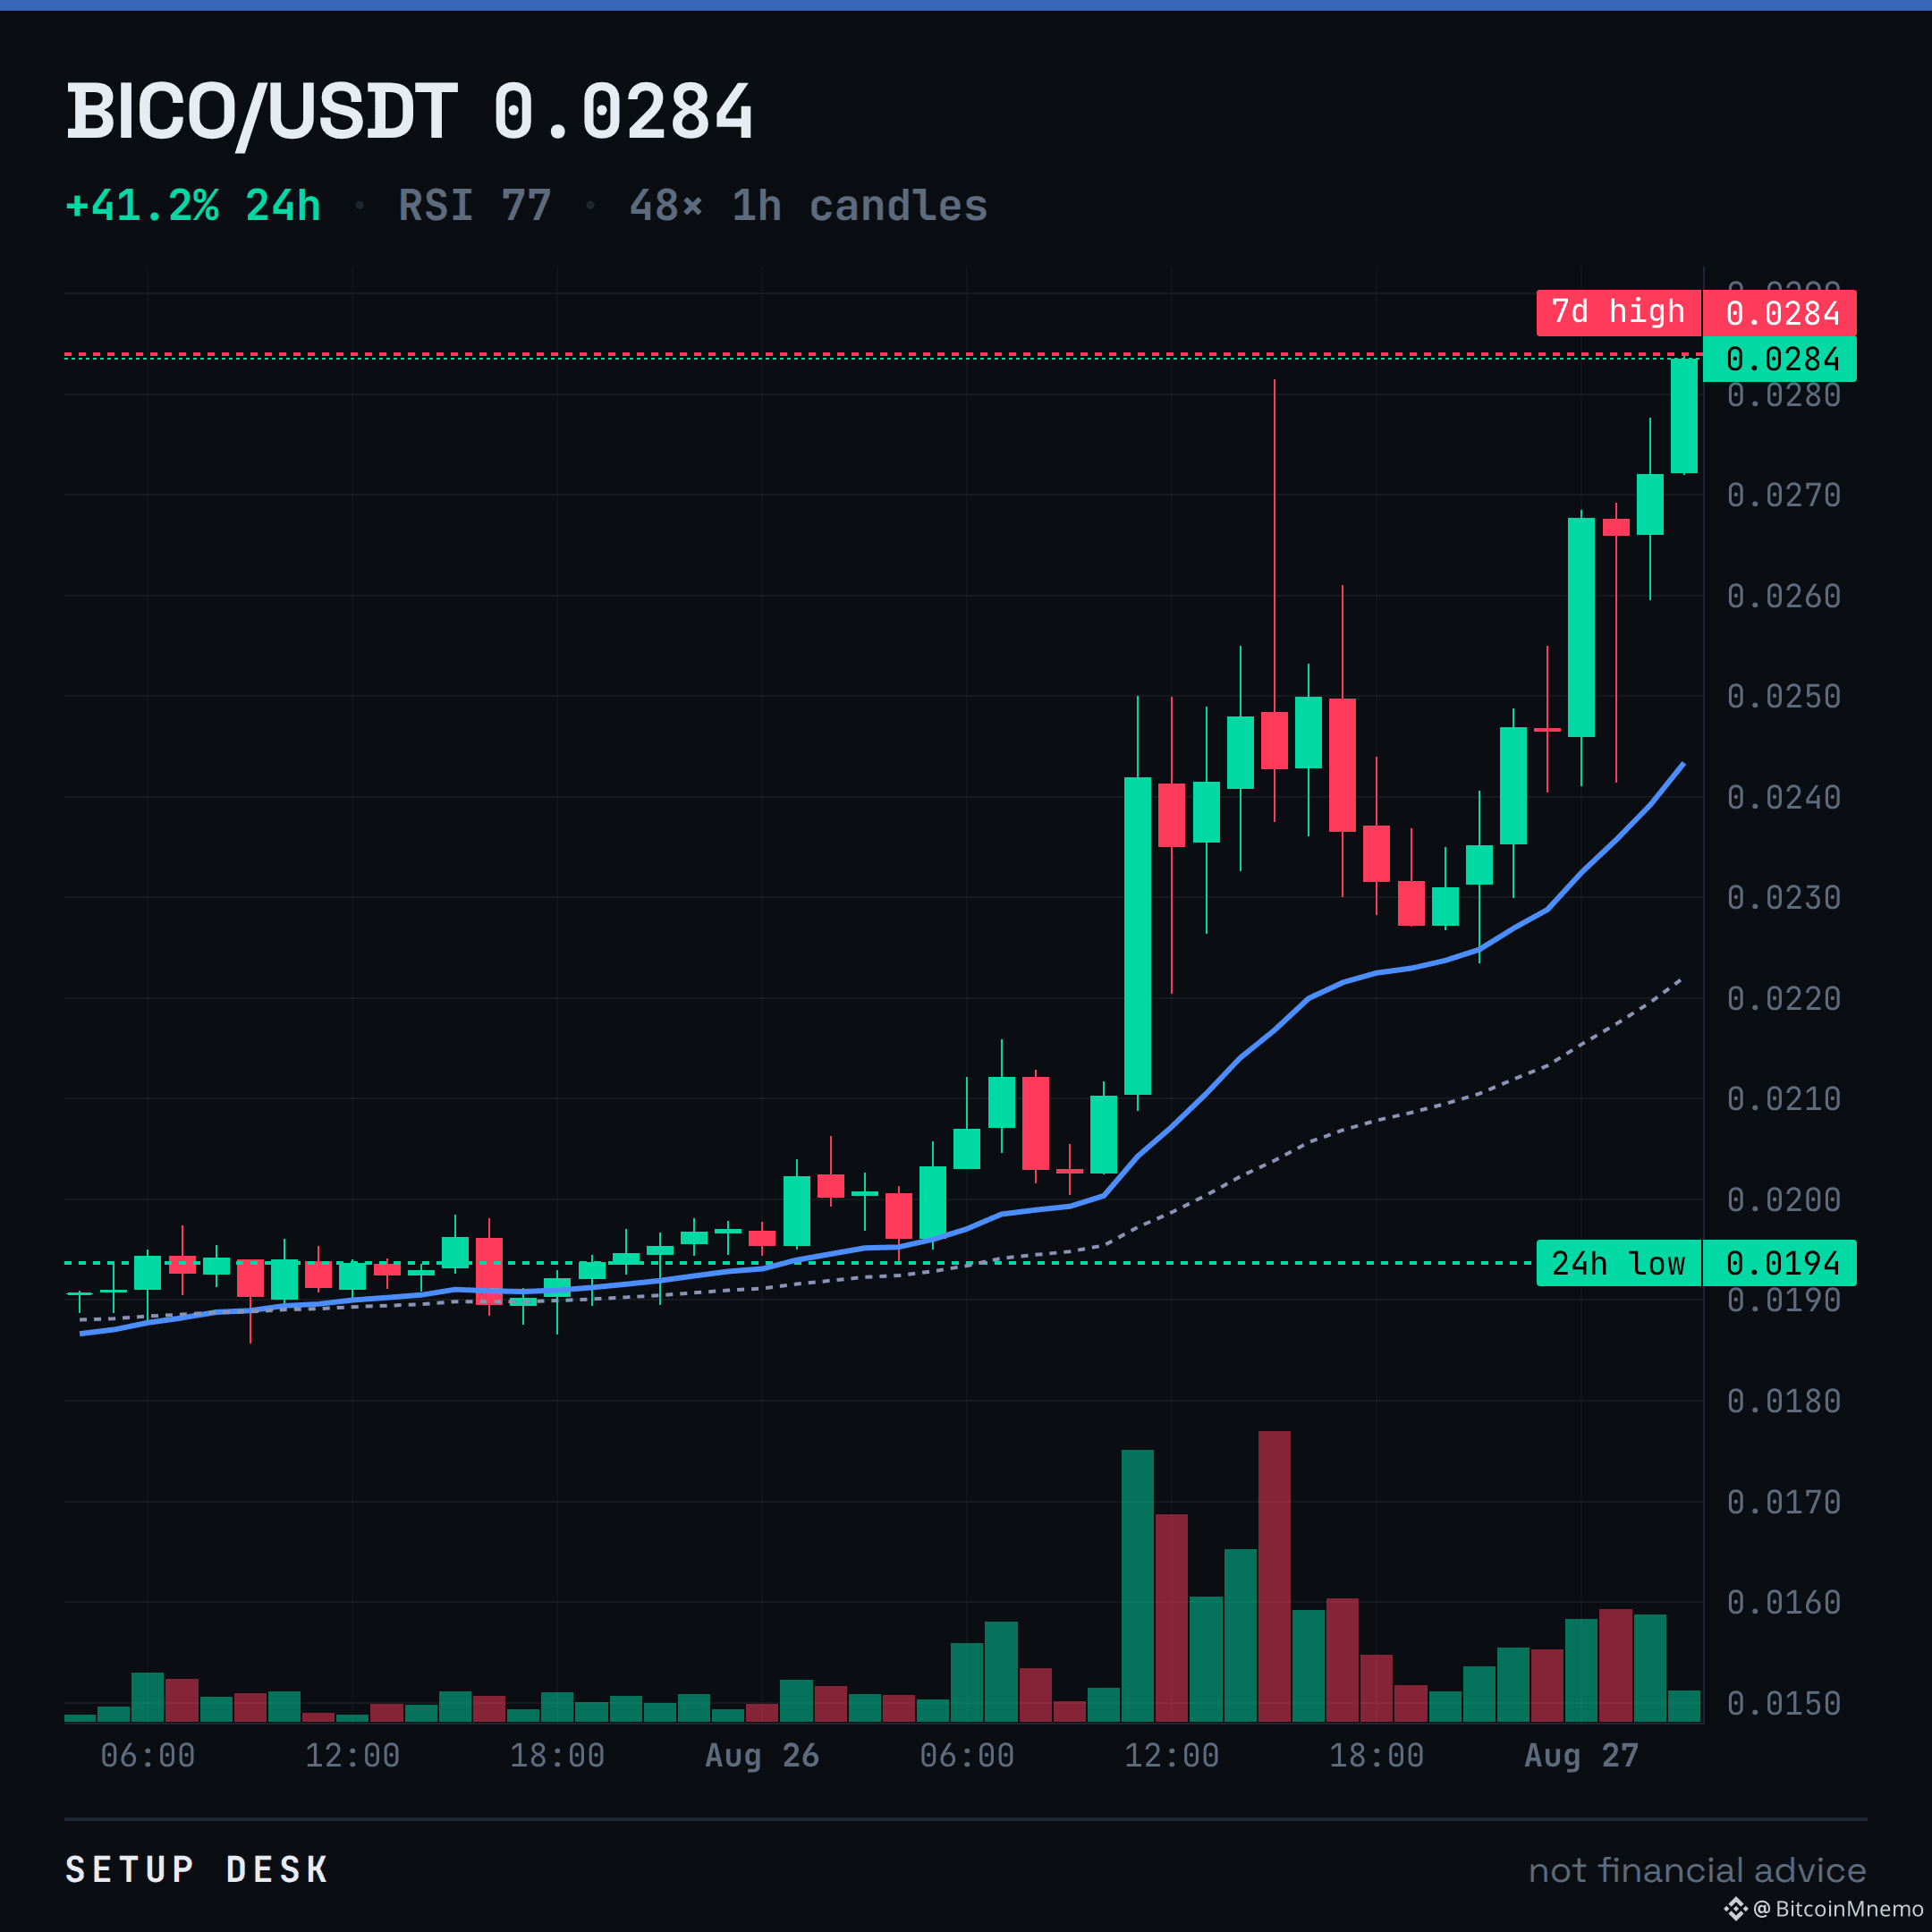
BICO ran 40% straight into the 7-day high at 0.0282.
RSI is printing 76. That's not a buy signal, it's exit liquidity. This move is vertical.
I'm fading it. If it builds a base above 0.0282, I'm wrong.
$BICO
RSI is printing 76. That's not a buy signal, it's exit liquidity. This move is vertical.
I'm fading it. If it builds a base above 0.0282, I'm wrong.
$BICO
🚨 NEW: DeepSeek's revenue surged 10× in just seven months.
The AI startup generated $70.7M in revenue from January to July 2026, already 10× its full-year 2025 revenue.
Its annualized revenue is reportedly reaching $400M-$500M, while DeepSeek is seeking another $7B funding round at a $70B valuation.
Its API business reportedly has an 82.9% gross margin.
The AI startup generated $70.7M in revenue from January to July 2026, already 10× its full-year 2025 revenue.
Its annualized revenue is reportedly reaching $400M-$500M, while DeepSeek is seeking another $7B funding round at a $70B valuation.
Its API business reportedly has an 82.9% gross margin.


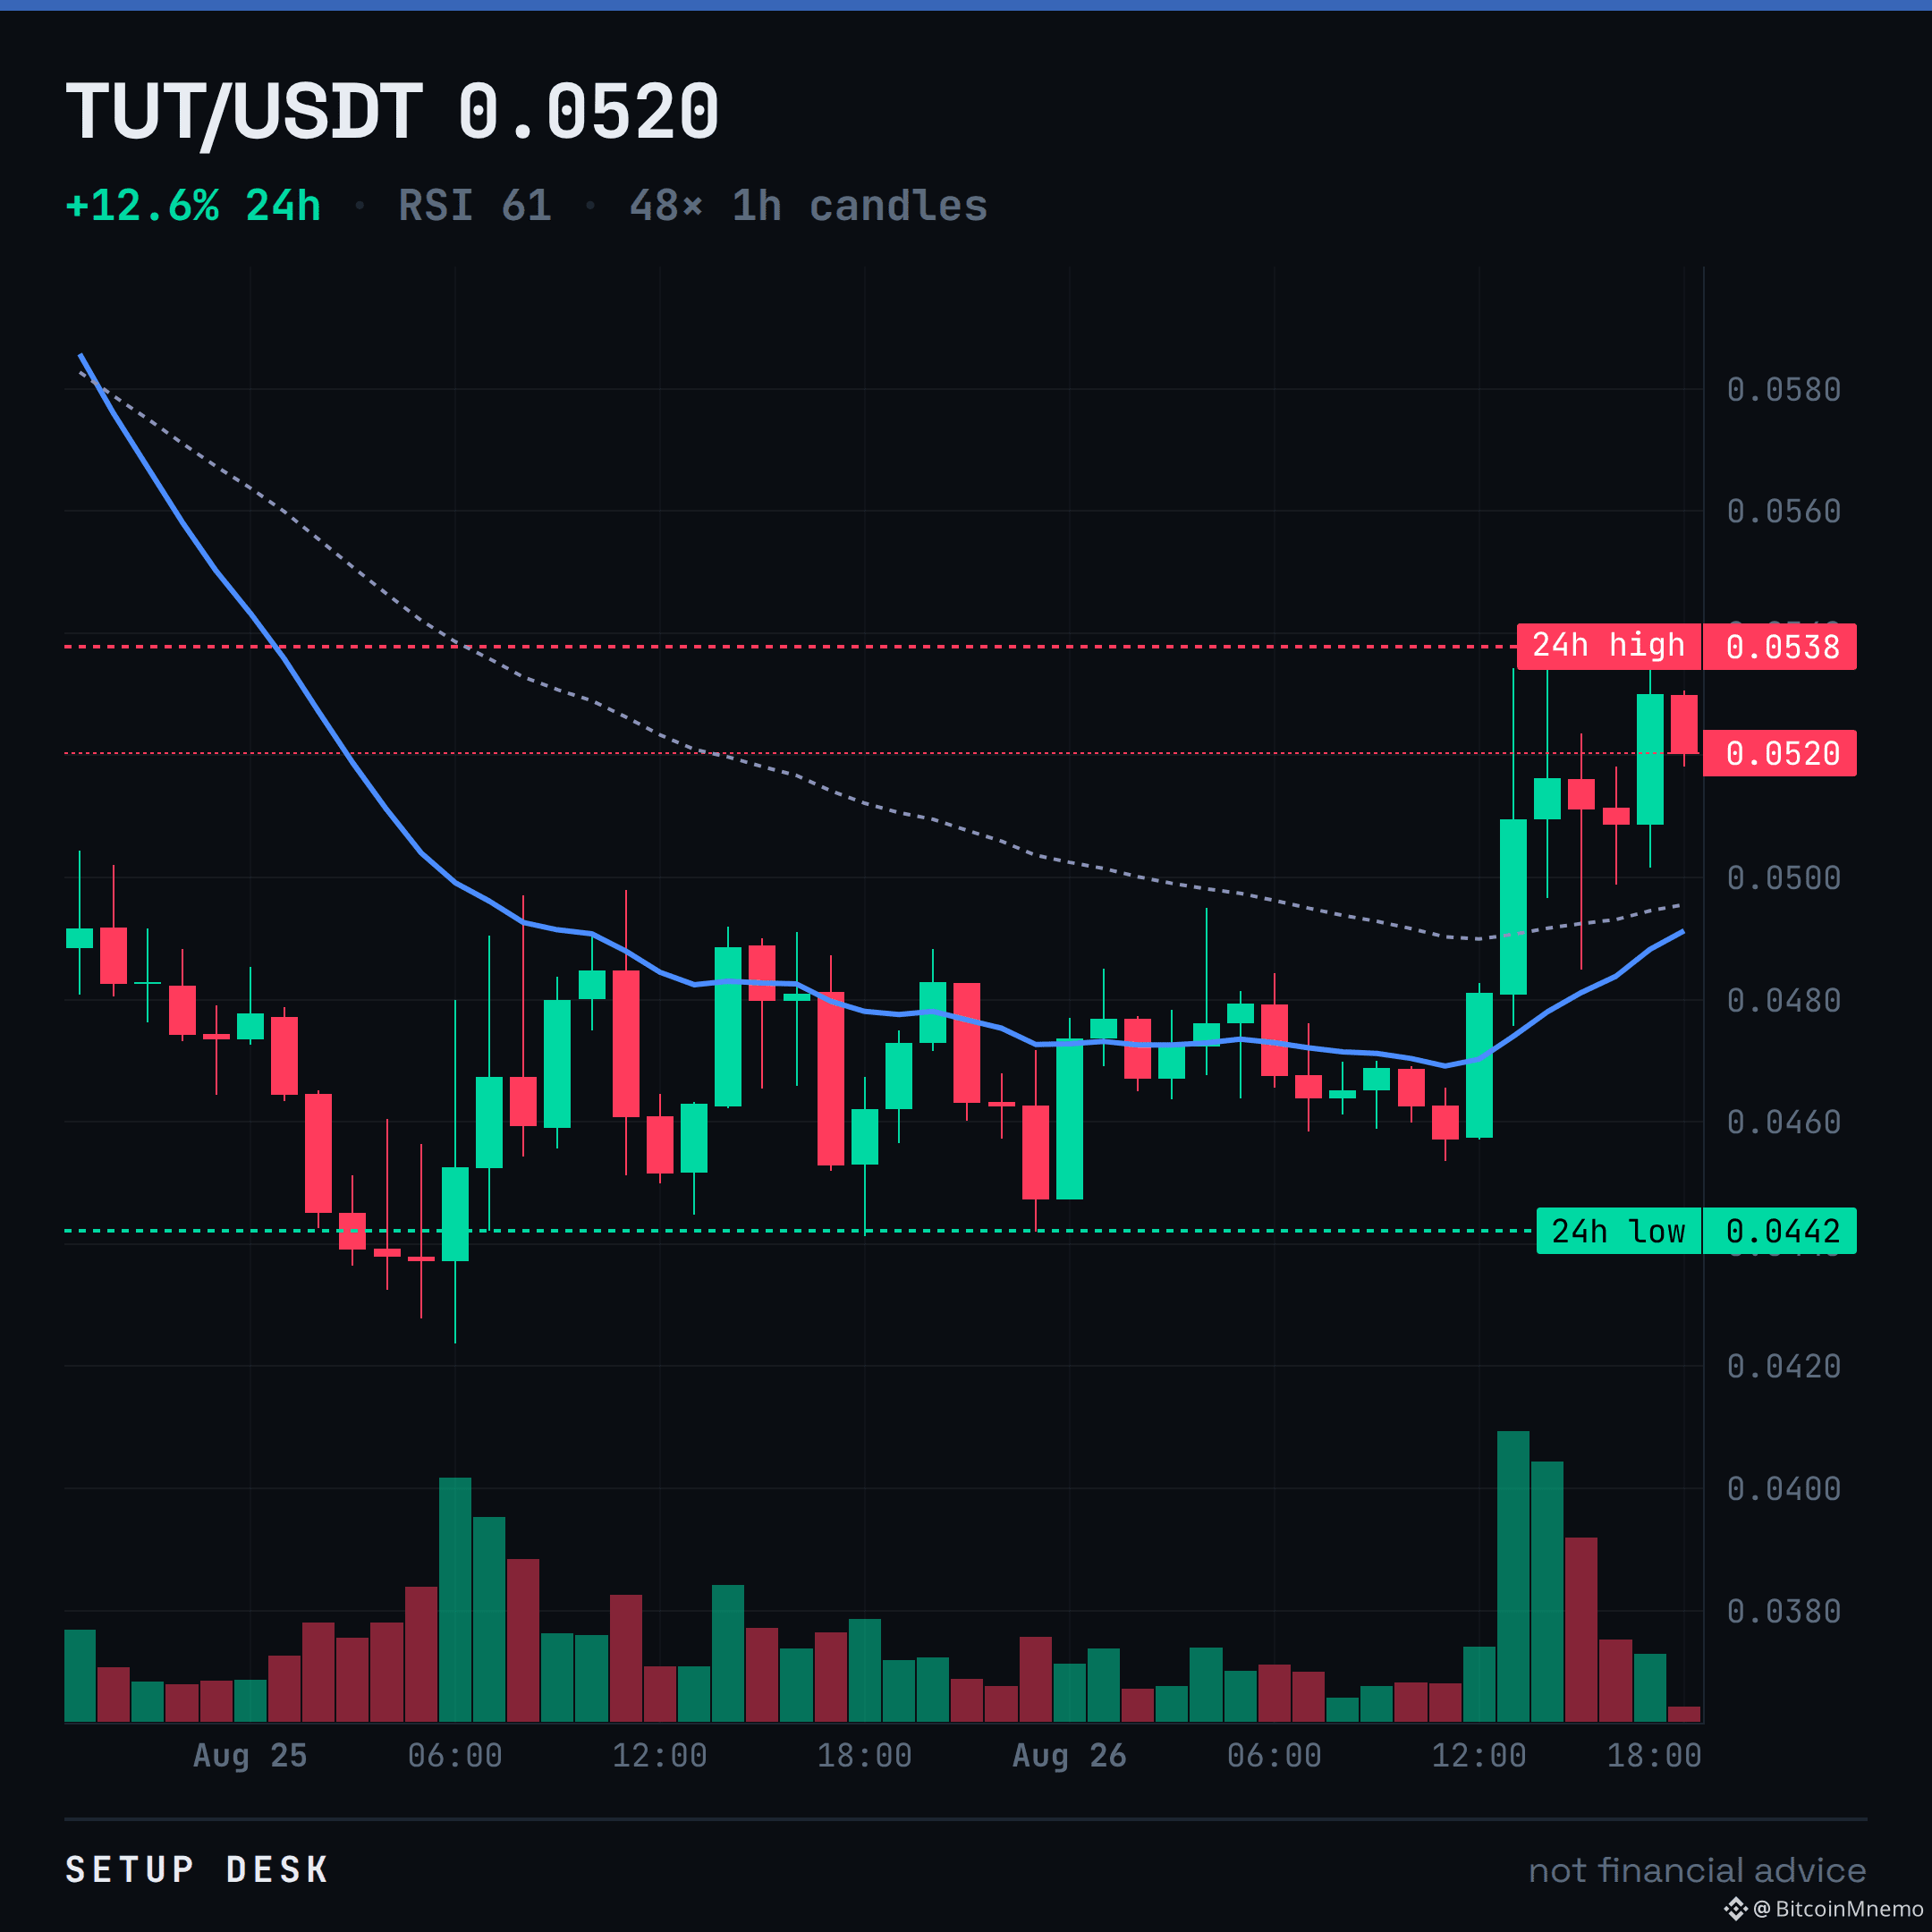
TUT up 16% on the day, stalling right under its 24h high of 0.0538.
Price is over the EMAs, yes, but the EMA20 is still tracking under the 50. That's not a trend, that's a pump into resistance on $30M volume.
I'd fade this until it proves it can hold above 0.0538. Right now it just looks like a gift for sellers.
$TUT
Price is over the EMAs, yes, but the EMA20 is still tracking under the 50. That's not a trend, that's a pump into resistance on $30M volume.
I'd fade this until it proves it can hold above 0.0538. Right now it just looks like a gift for sellers.
$TUT
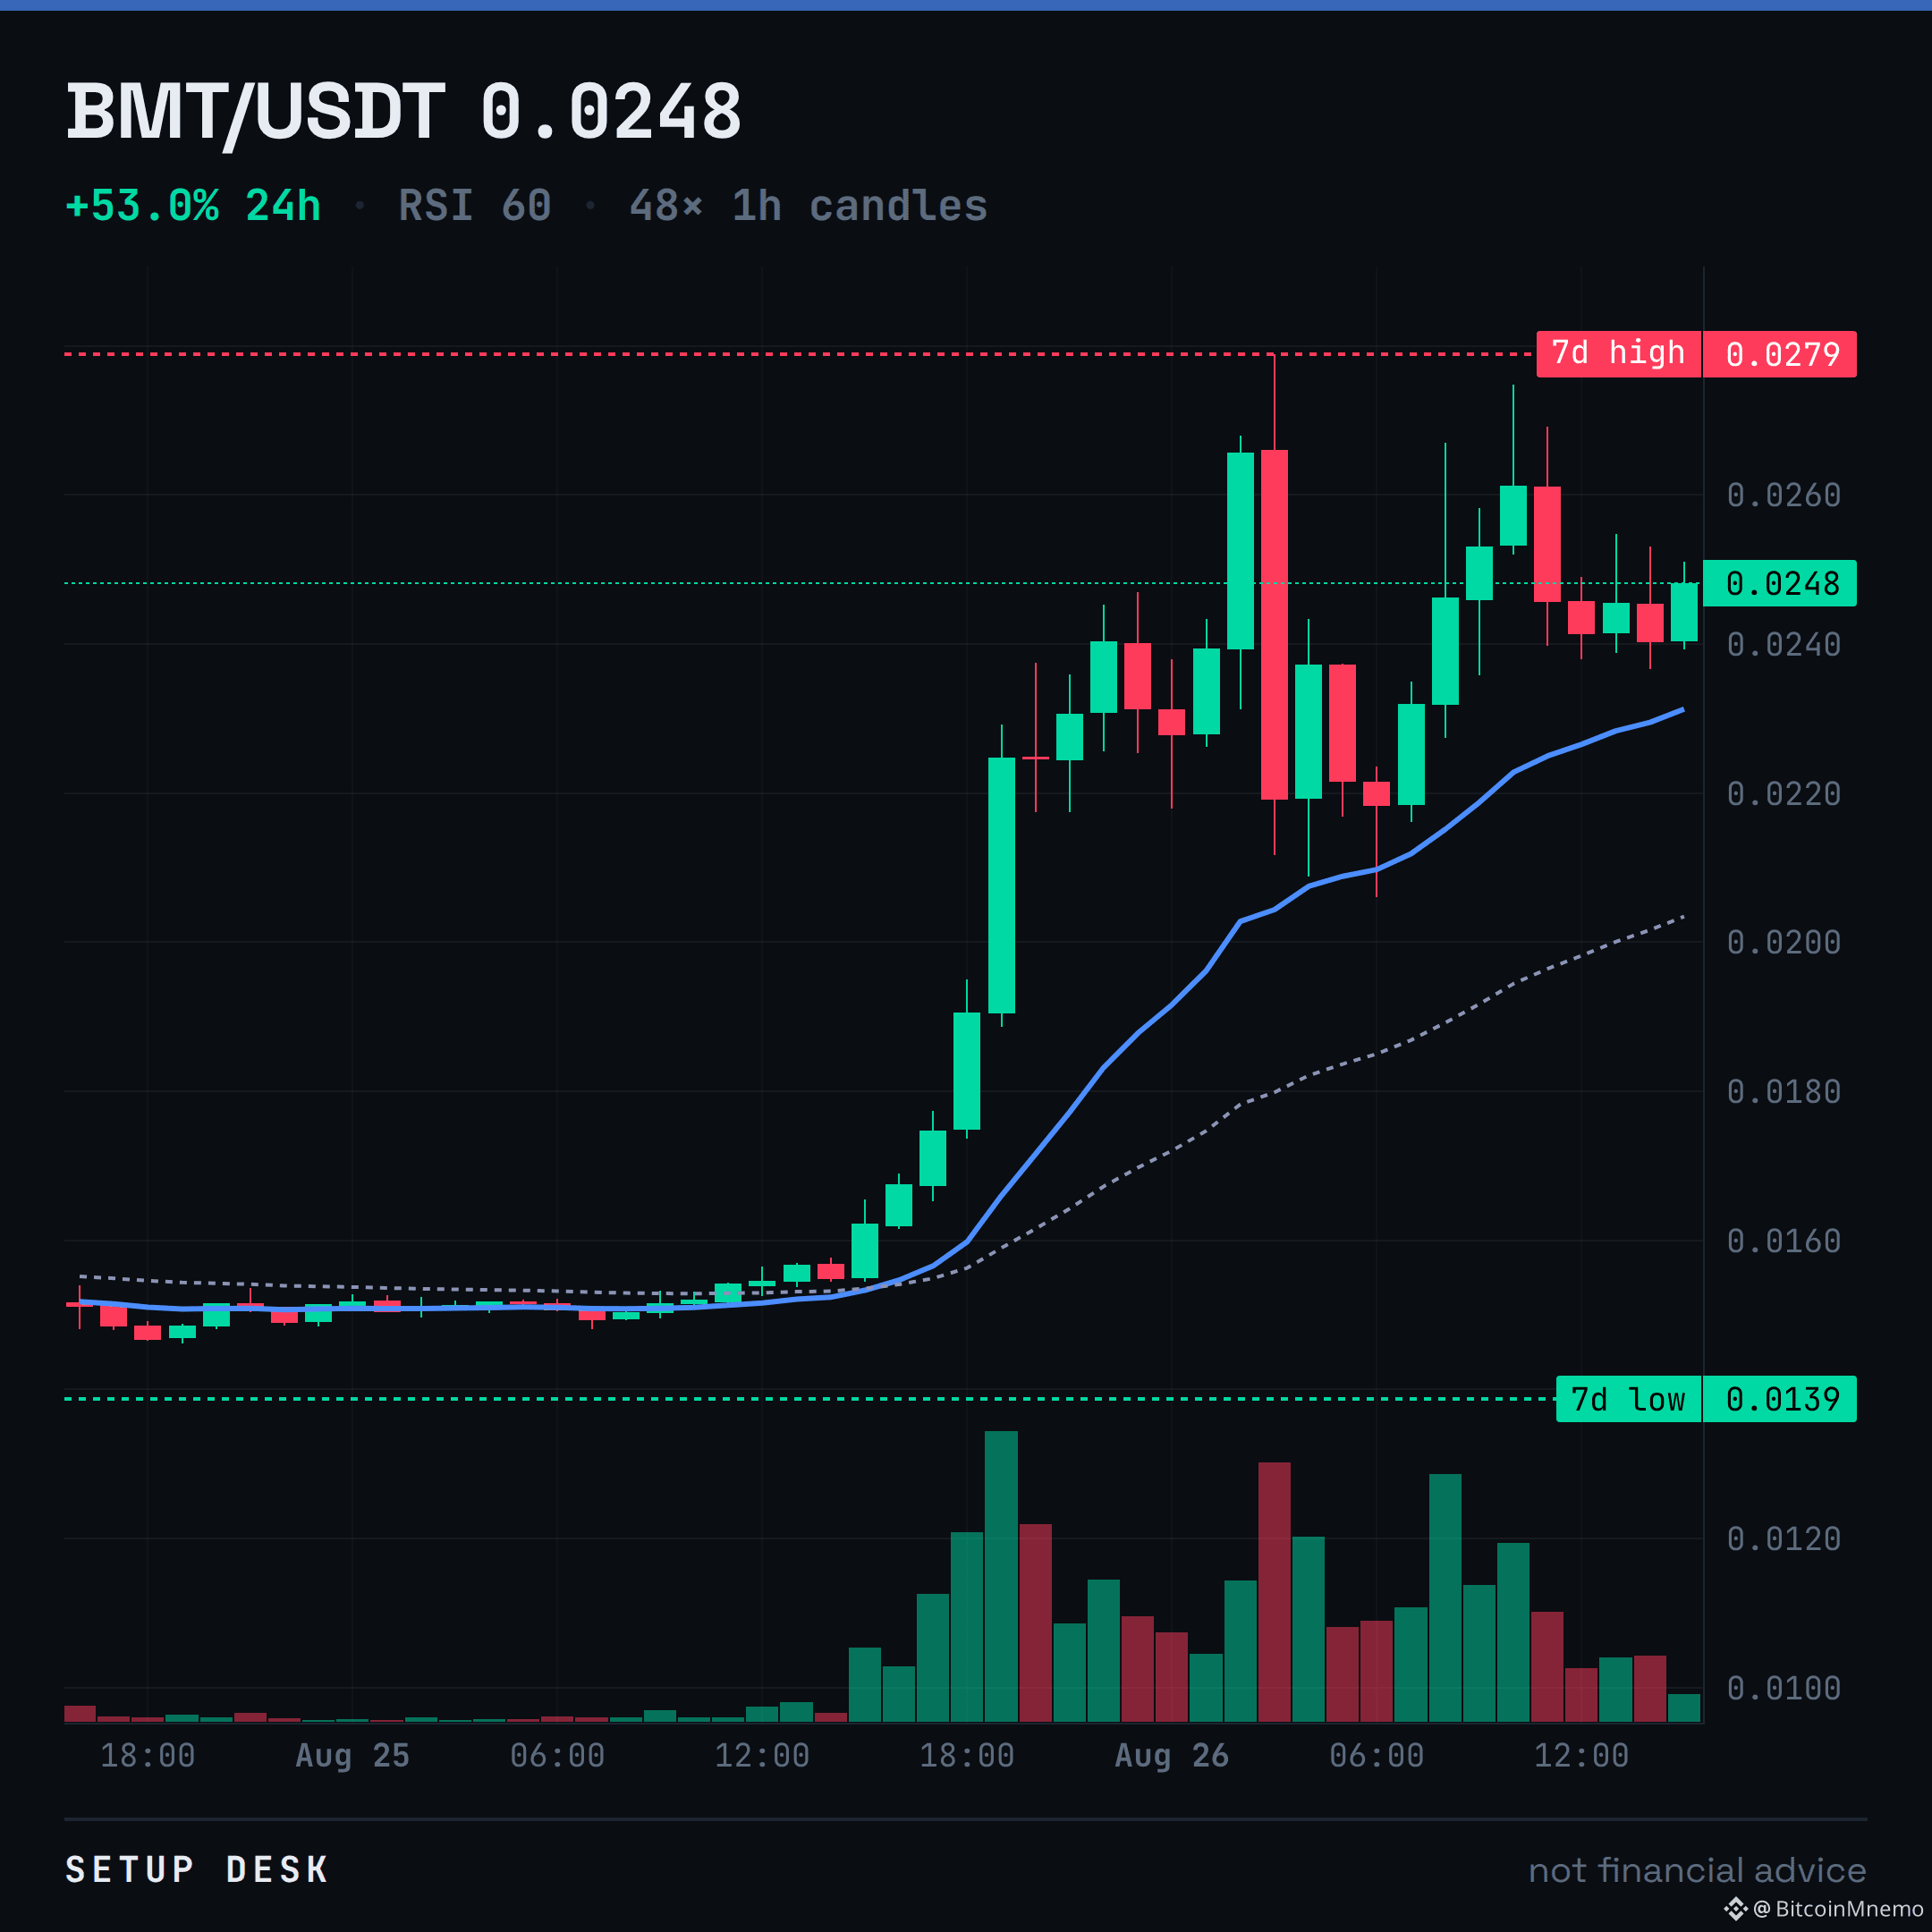
0.0279 was the high, BMT ran 58% to get there. Now it's looking for support on $35M volume.
Price is over the EMAs, RSI is 60. All looks fine until it isn't. The line is the EMA20 at 0.0231.
A bounce there is a new leg up. A break means the run is over. My read depends entirely on 0.0231.
$BMT
Price is over the EMAs, RSI is 60. All looks fine until it isn't. The line is the EMA20 at 0.0231.
A bounce there is a new leg up. A break means the run is over. My read depends entirely on 0.0231.
$BMT
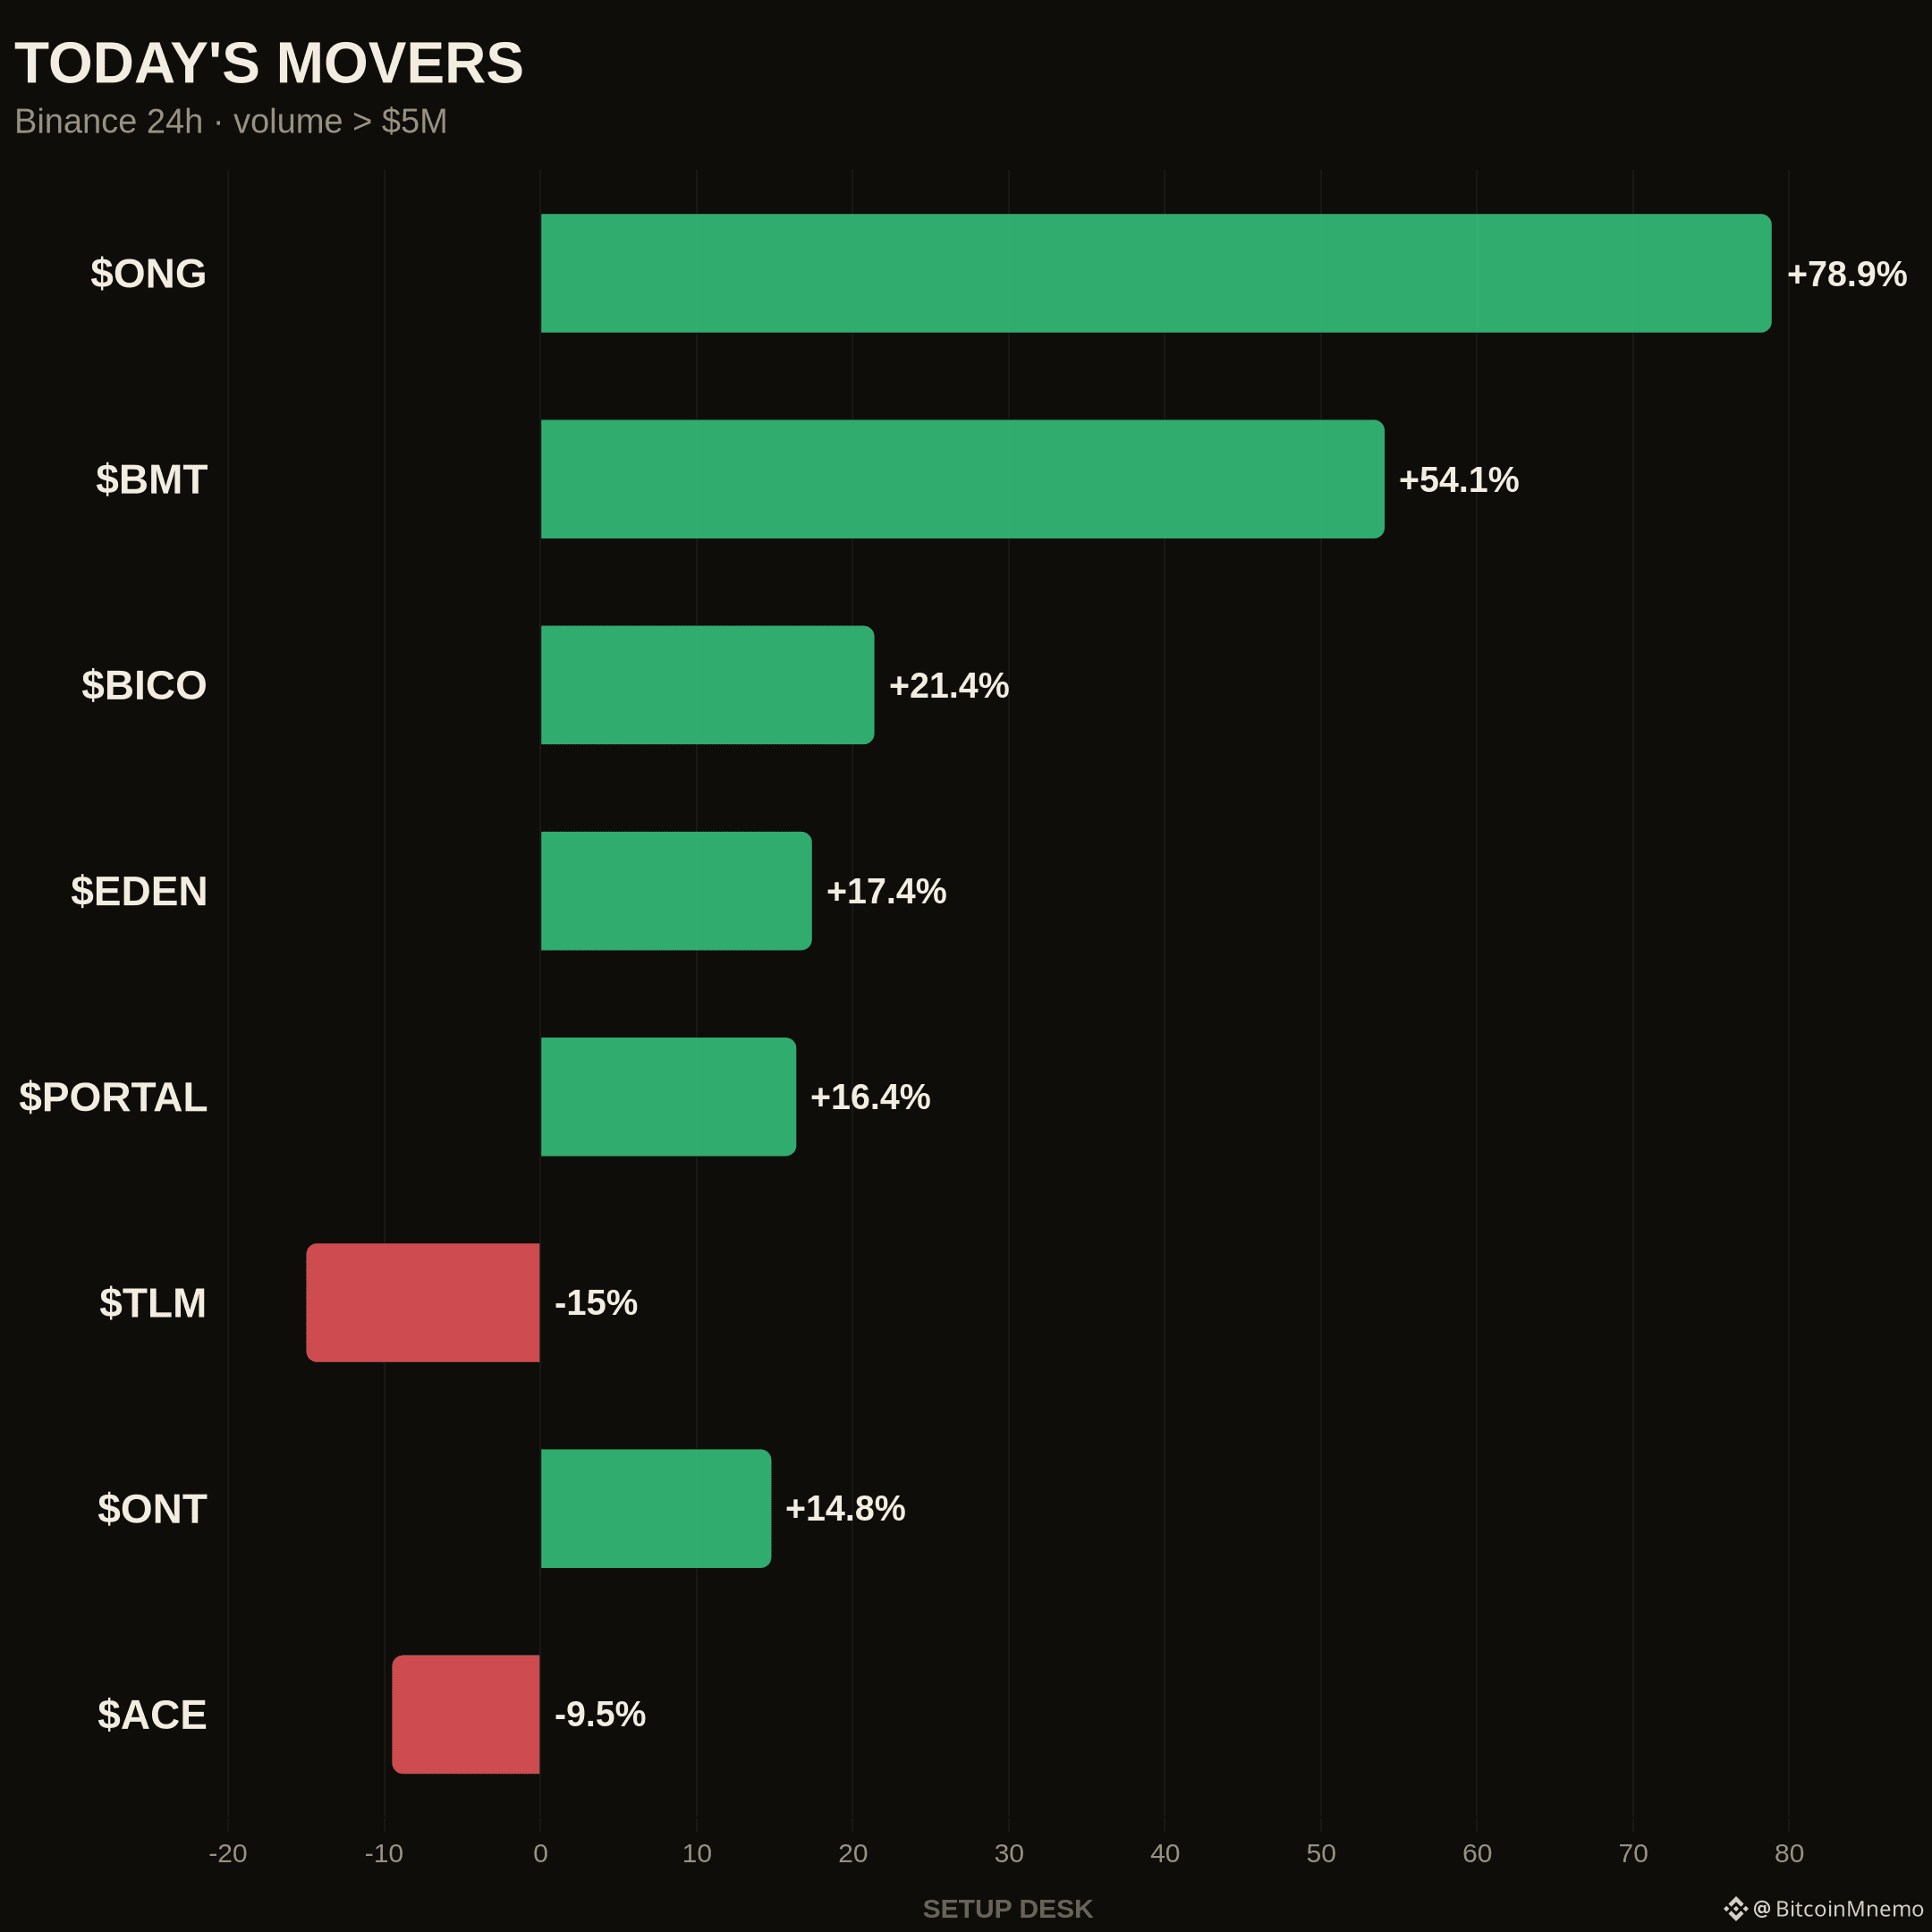
Today's board: $ONG +78.9%, $BMT +54.1%, $BICO +21.4%.
Breadth leans green: 8 movers up 3%+ vs 3 down in the >$5M pool.
Which name on this board are you actually trading?
New board, every day. Follow so it's in your feed before the open.
$ONG $BMT
Breadth leans green: 8 movers up 3%+ vs 3 down in the >$5M pool.
Which name on this board are you actually trading?
New board, every day. Follow so it's in your feed before the open.
$ONG $BMT
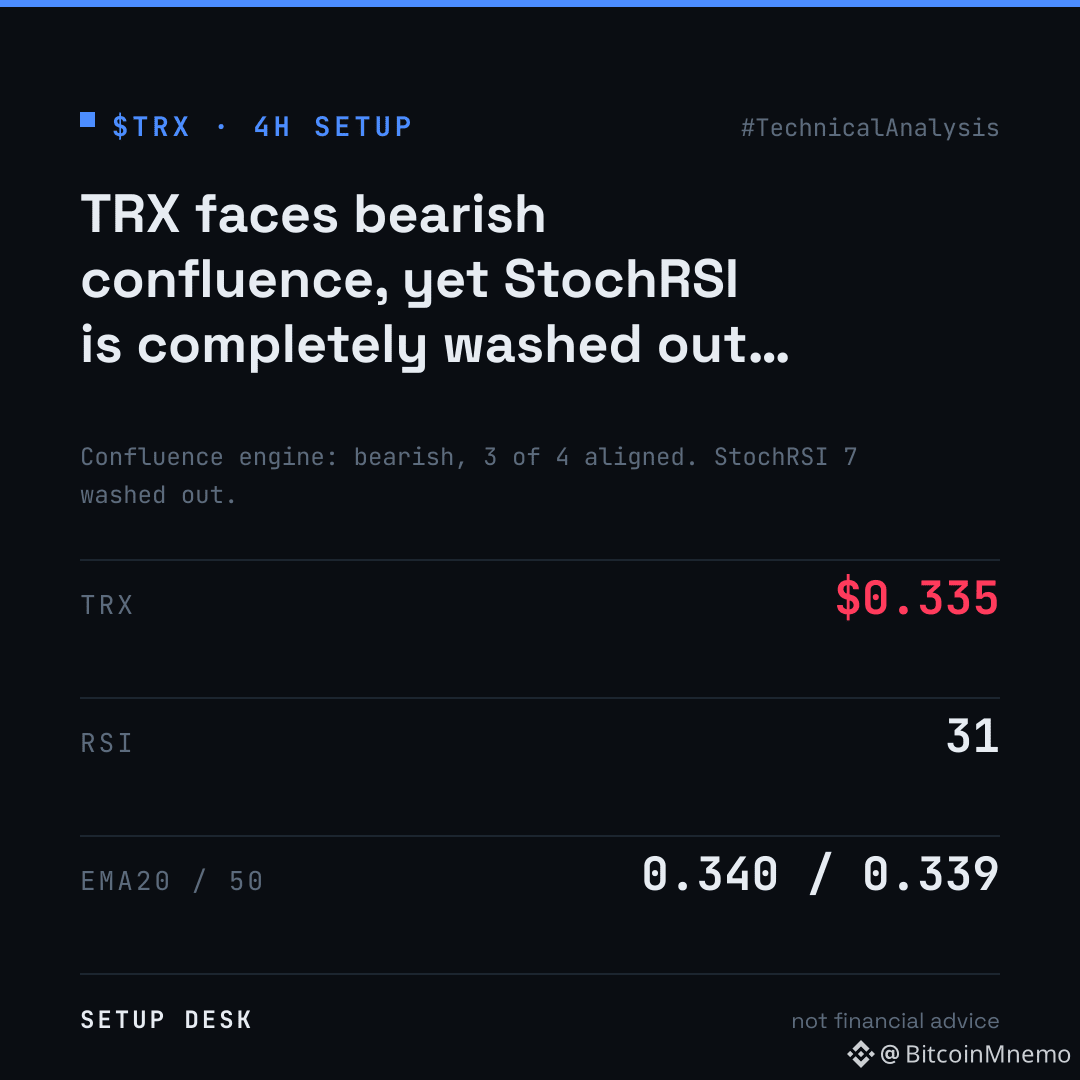
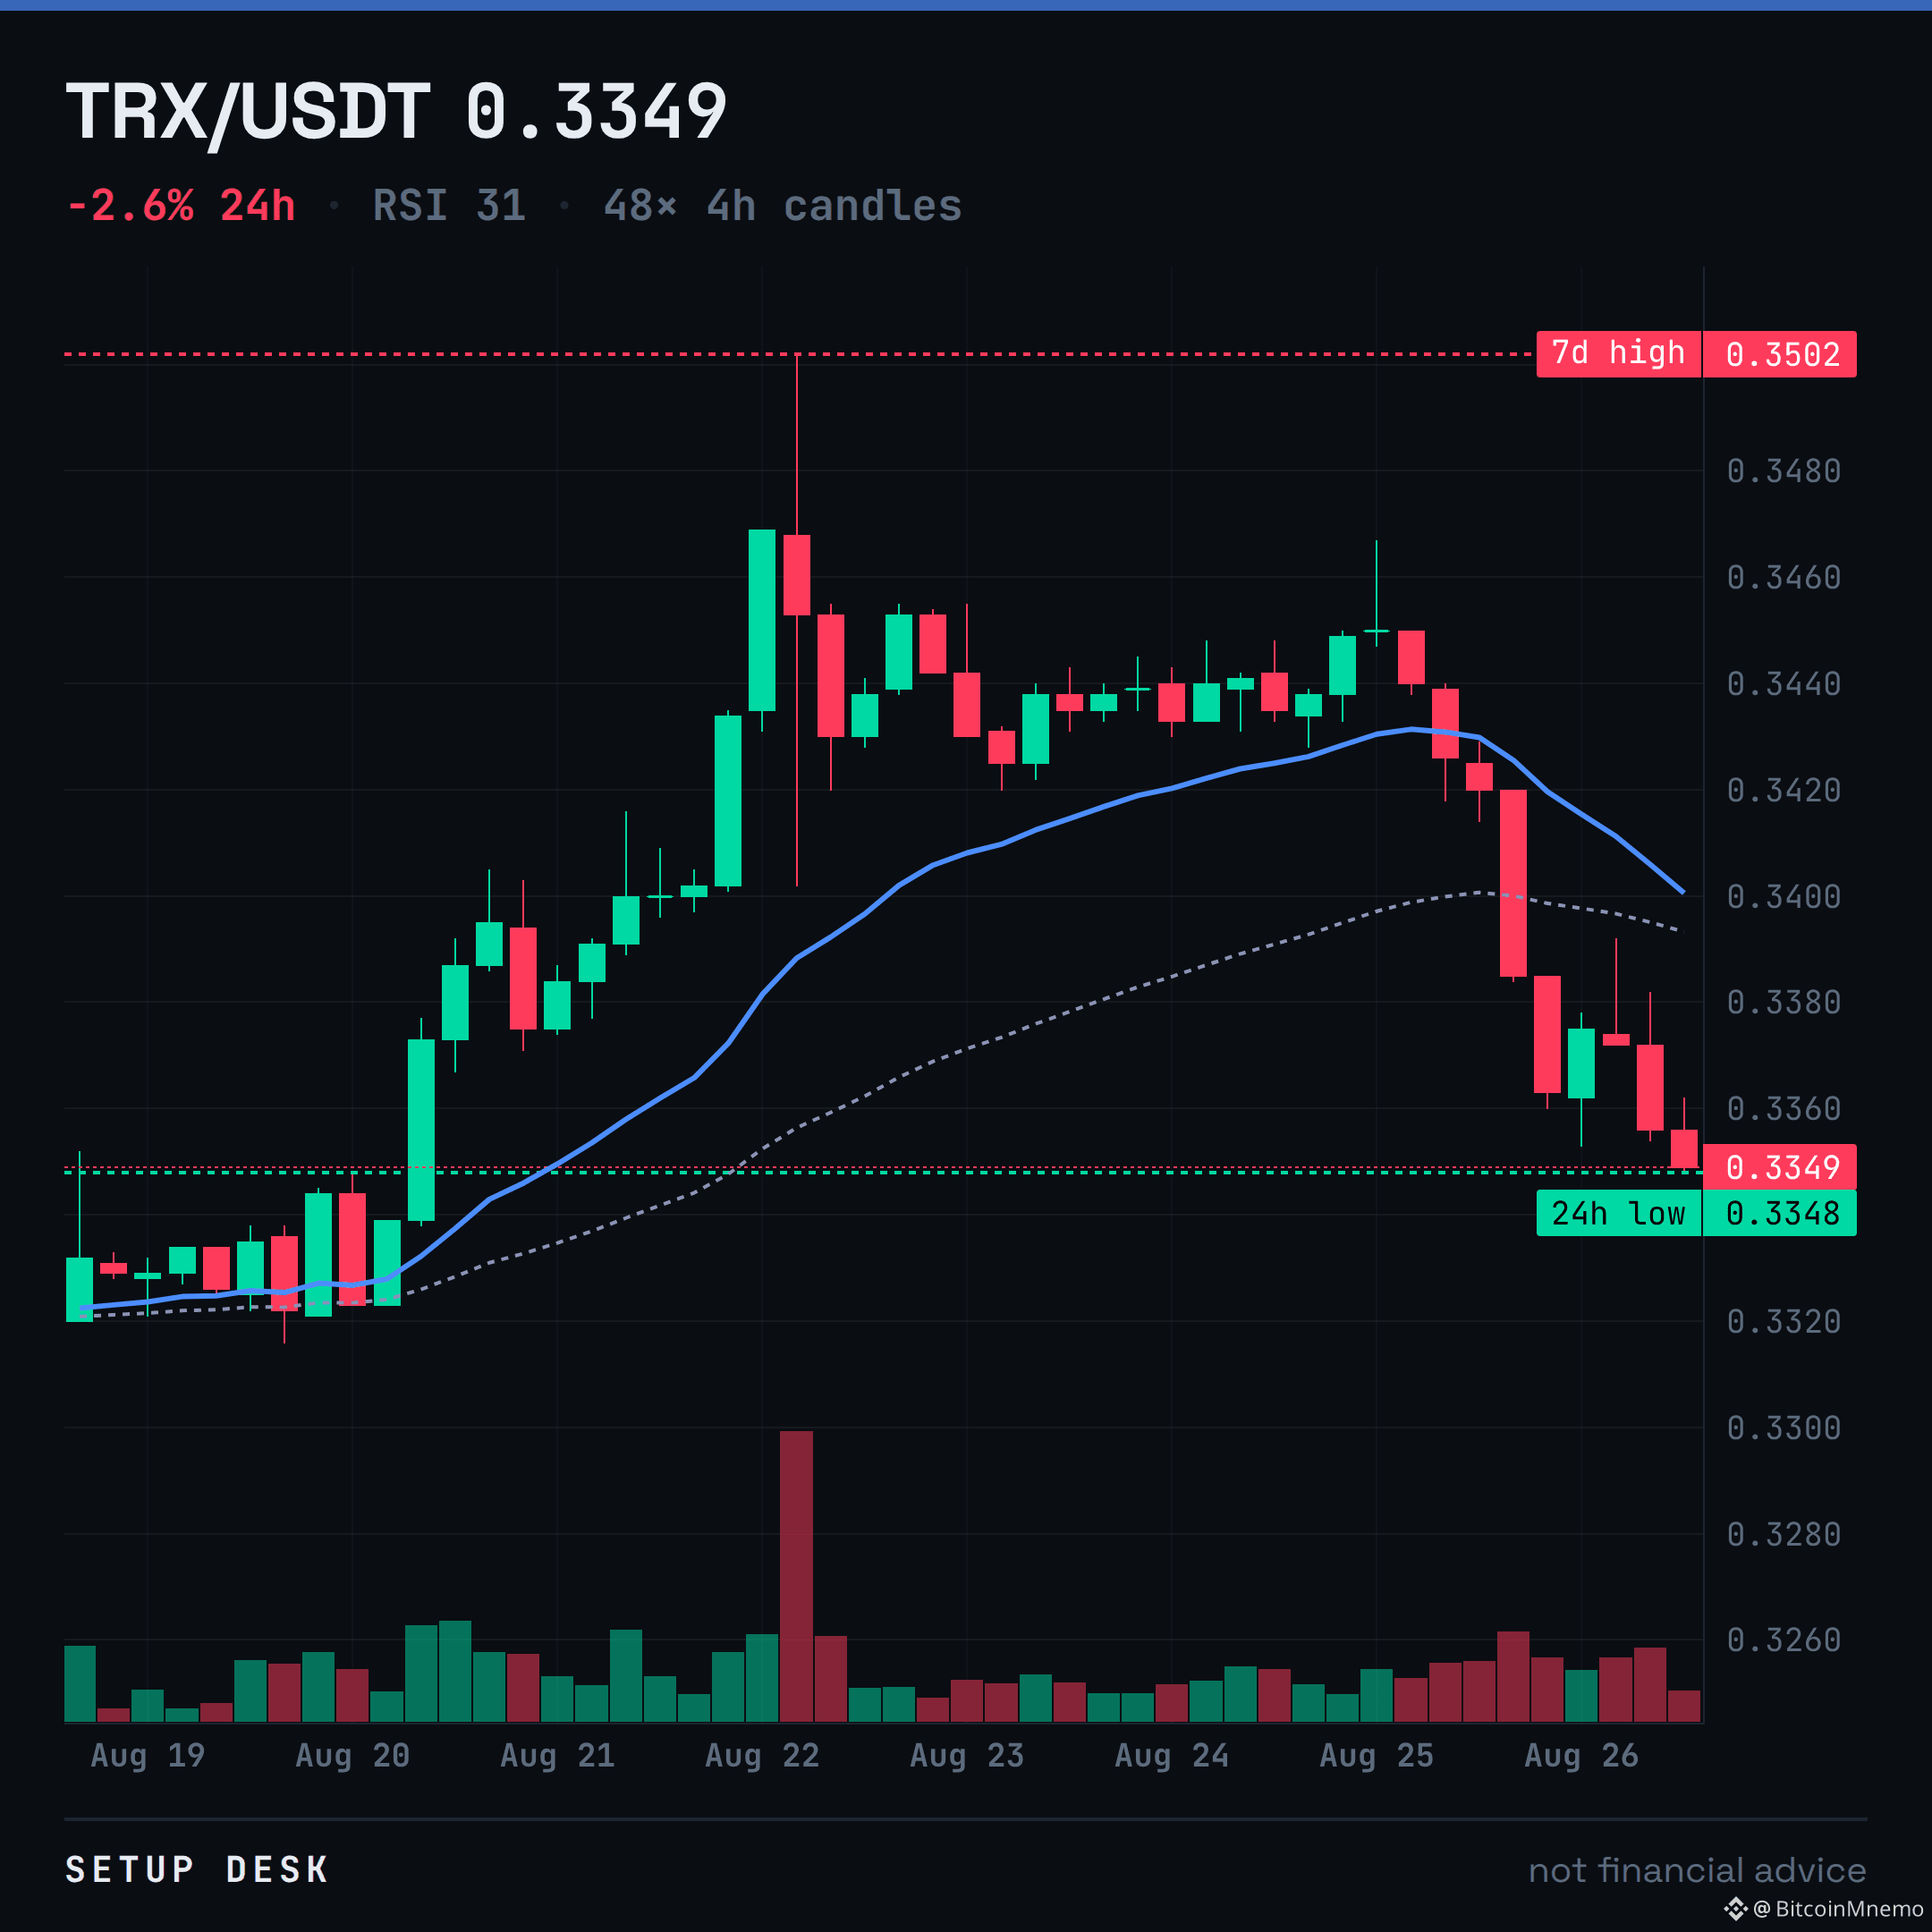
TRX faces bearish confluence, yet StochRSI is completely washed out at 7.
Price attempts to hold the EMA200 at 0.334. Any bounce from here hits a wall: Supertrend resistance at 0.342. This looks like a long trap.
I'm fading it. My read is wrong if TRX reclaims 0.342.
$TRX
Price attempts to hold the EMA200 at 0.334. Any bounce from here hits a wall: Supertrend resistance at 0.342. This looks like a long trap.
I'm fading it. My read is wrong if TRX reclaims 0.342.
$TRX
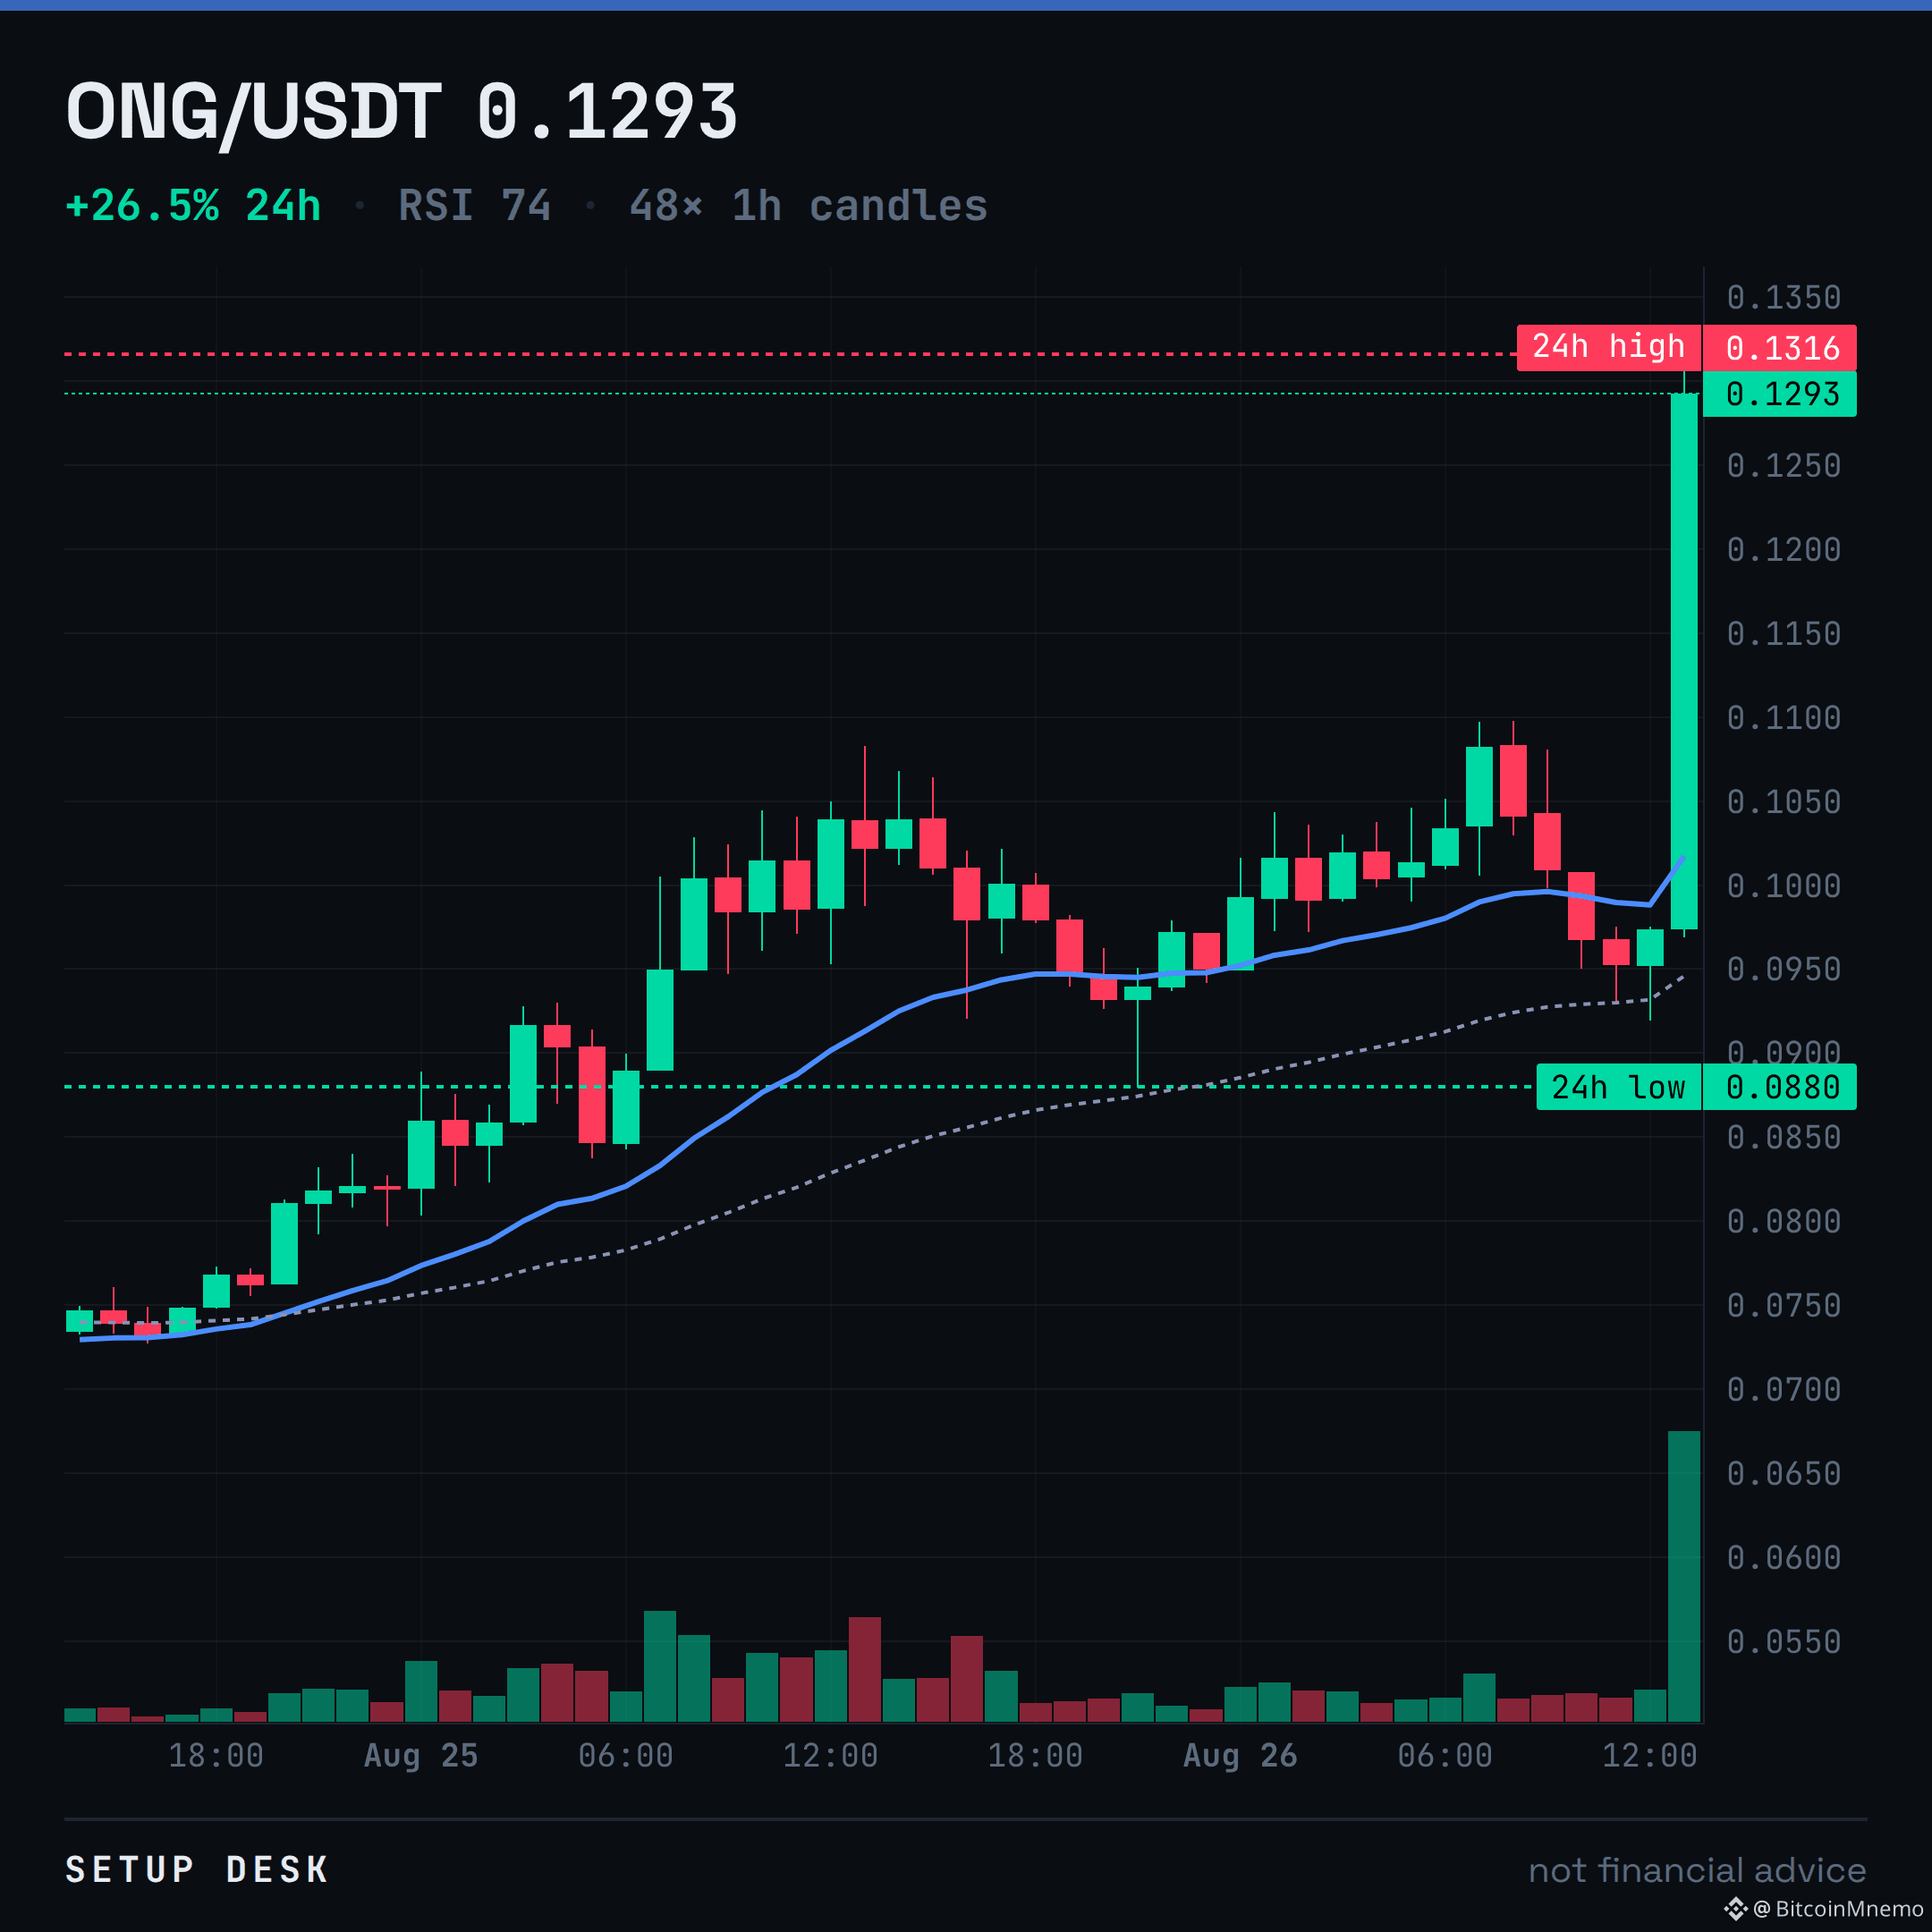
ONG up 24.6% with an RSI screaming 73.
It's pushing the daily high of 0.132 on $29M volume. Everything about this print says overbought.
I'm not the buyer here. This looks like a spot to fade, not chase. If it can't clear 0.132 and hold, this was the top for now.
$ONG
It's pushing the daily high of 0.132 on $29M volume. Everything about this print says overbought.
I'm not the buyer here. This looks like a spot to fade, not chase. If it can't clear 0.132 and hold, this was the top for now.
$ONG
$BMT is up 57.1% on the day. Here is where it actually sits.
RSI 59. The 7d high is 0.02789, the 7d low 0.01387 — so the tape is in the upper half of its own week.
The levels are on the chart. Which one breaks first?
$BMT
RSI 59. The 7d high is 0.02789, the 7d low 0.01387 — so the tape is in the upper half of its own week.
The levels are on the chart. Which one breaks first?
$BMT
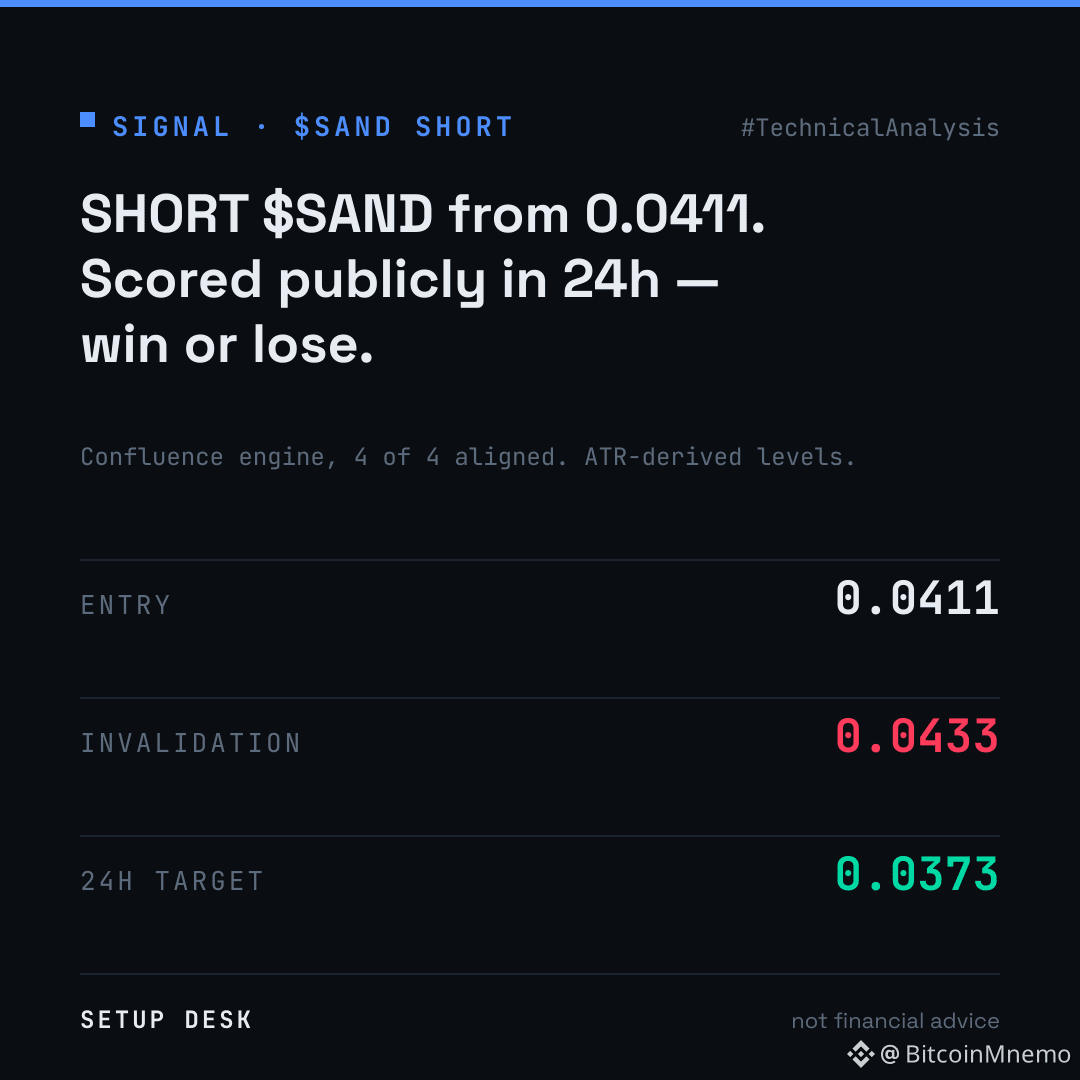
SAND 4h is a clean indicator-based short setup.
Four of four aligned: price below key MAs, Supertrend down, MACD histogram negative.
The read targets 0.0373. The risk is that it's washed out — StochRSI at 19 and MFI at 11 means money flow is completely drained. A bounce from here could be sharp.
This is just a snapshot of the indicators, not a desk call. The setup is invalid over 0.0433.
$SAND #TechnicalAnalysis
Four of four aligned: price below key MAs, Supertrend down, MACD histogram negative.
The read targets 0.0373. The risk is that it's washed out — StochRSI at 19 and MFI at 11 means money flow is completely drained. A bounce from here could be sharp.
This is just a snapshot of the indicators, not a desk call. The setup is invalid over 0.0433.
$SAND #TechnicalAnalysis
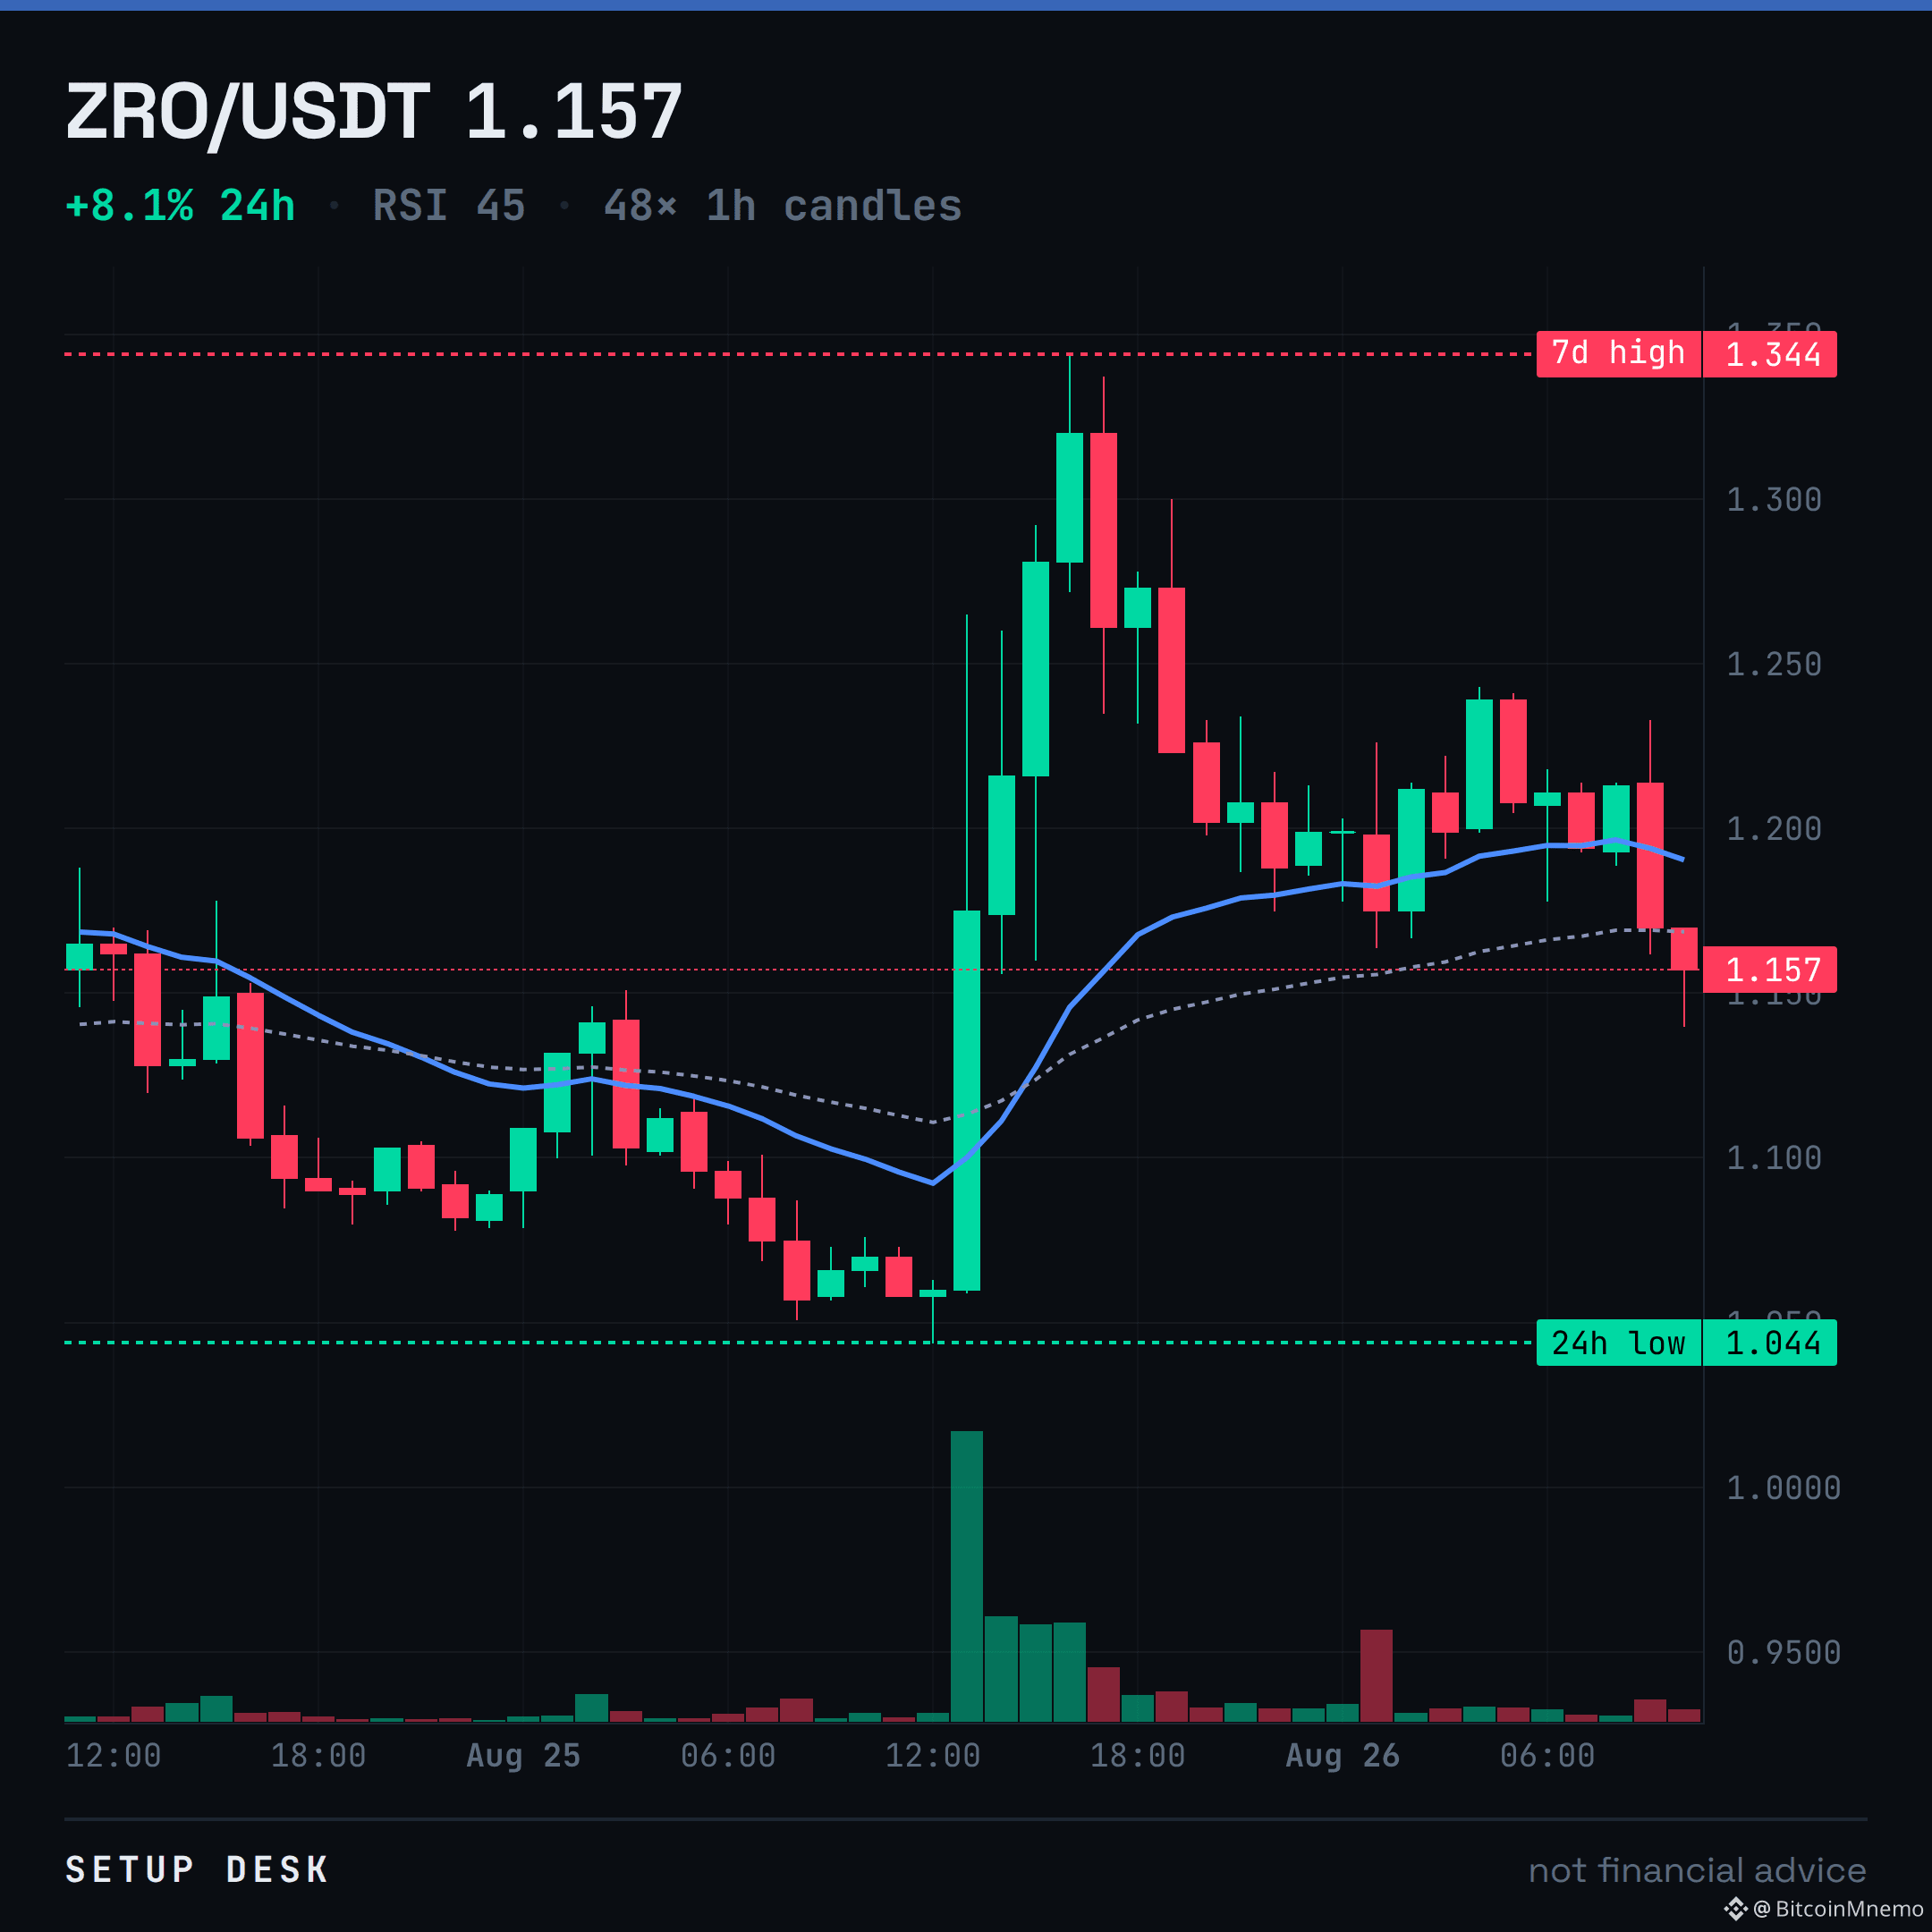
ZRO printed +8.1% today but the tape tells a different story.
Price wicked up to 1.34 and got sent straight back down to 1.16, now trading under its EMA20 at 1.19. A green day that can't even reclaim short-term averages is weakness.
The desk's read is this strength gets sold. It's a liquidity grab, not a new leg up. That changes if buyers can hold over 1.19.
Selling this rip or buying the dip?
$ZRO
Price wicked up to 1.34 and got sent straight back down to 1.16, now trading under its EMA20 at 1.19. A green day that can't even reclaim short-term averages is weakness.
The desk's read is this strength gets sold. It's a liquidity grab, not a new leg up. That changes if buyers can hold over 1.19.
Selling this rip or buying the dip?
$ZRO
سجّل الدخول لاستكشاف المزيد من المُحتوى