Binance Square
#etheretfspost$697mweeklyinflow

etheretfspost$697mweeklyinflow

Khan 62
·
--
#EtherETFsPost$697MWeeklyInflow 🚨 ETH ETF INFLOWS JUST HIT A 2026 RECORD! 🍋Ethereum is getting a lot of attention from investors. Spot Ether ETFs brought in $697M in money for the week that ended August 21. That is the week of 2026. 🔥 💥ETH jumped 31.3%. It crossed its 200‑day moving average again. That gives support and shows the new money is strong. 🌐 A softer DXY, below 99 is helping the risk‑on mood. The next test is coming. Jackson Hole, U.S. Core PCE and Nvidia earnings may decide if the trend keeps going. 👀 Is ETH starting a phase where big investors keep buying or is a pullback coming? 💬 Do I see ETH as bullish. Should I be cautious?🔥#ETH #crypto #Ethereum #Khan62 $ETH {future}(ETHUSDT) $BTC {future}(BTCUSDT) $BNB {future}(BNBUSDT)
#EtherETFsPost$697MWeeklyInflow 🚨 ETH ETF INFLOWS JUST HIT A 2026 RECORD!

🍋Ethereum is getting a lot of attention from investors. Spot Ether ETFs brought in $697M in money for the week that ended August 21. That is the week of 2026. 🔥

💥ETH jumped 31.3%. It crossed its 200‑day moving average again. That gives support and shows the new money is strong.

🌐 A softer DXY, below 99 is helping the risk‑on mood.

The next test is coming. Jackson Hole, U.S. Core PCE and Nvidia earnings may decide if the trend keeps going.

👀 Is ETH starting a phase where big investors keep buying or is a pullback coming?

💬 Do I see ETH as bullish. Should I be cautious?🔥#ETH #crypto #Ethereum #Khan62
$ETH
$BTC
$BNB

مقالة
Crypto Today: Bitcoin, Ethereum and XRP pull back as rally cools•Bitcoin stalls below the $80,000 resistance level while $77,000 offers short-term support. •Ethereum corrects toward the $2,400 demand zone despite $697 million in weekly ETF inflows. •XRP accelerates its decline after a stretched rally, defined by an overbought RSI. The cryptocurrency market is broadly correcting on Monday as investors shift focus to profit-taking after last week’s rally. Bitcoin (BTC) is edging lower amid capped upside below $80,000, with immediate support at $77,000. Meanwhile, Ethereum (ETH) holds above short-term support at $2,400 but lags upward momentum toward the next key resistance at $2,600. On the other hand, Ripple (XRP) hovers around $1.48 as momentum cools against the backdrop of a 72% surge last week from $1.00 to highs around $1.70. 🗣️ Bitcoin, Ethereum and XRP ETFs draw notable inflows Bitcoin spot Exchange-Traded Funds (ETFs) recorded a significant jump in inflows, totaling $1.92 billion last week through Friday. This was the largest inflow volume since October, underpinning improving risk-on sentiment. Cumulative inflows now stand at $53.71 billion, rising from $51.79 billion posted the week before. Ethereum spot ETFs saw renewed demand, with inflows totaling $697 million through Friday. This marks a massive upswing from roughly $2.26 million in outflows observed the previous week. Meanwhile, cumulative inflows stand at $12.15 billion, up from $11.45 billion the week before. Institutional investors are also showing more appetite for XRP, with inflows totaling $40 million through Friday, up from $2.25 million the week before. According to SoSoValue data, cumulative inflows average $1.55 billion, with total assets under management at $1.33 billion. If sustained, increasing demand for crypto investment products could boost the broader market’s recovery outlook. However, traders should temper expectations, as profit-taking could impede momentum and raise the chances of a deeper correction. 🚨Technical analysis: Bitcoin stalls amid a capped upside Bitcoin trades at $77,240, holding well above the key Exponential Moving Averages (EMAs) and maintaining a clear bullish near-term bias. The 50-day EMA at $66,777, the 100-day EMA at $67,410, and the 200-day EMA at $71,805 all trail price and reinforce a well-supported uptrend, while the SuperTrend line at $70,570 also sits below spot, hinting at an intact bullish structure. Although Bitcoin has corrected from the next key resistance level near $80,000, momentum remains stretched, with the Relative Strength Index (RSI) at 78 lodged in overbought territory and the Moving Average Convergence Divergence (MACD) above zero with a strong positive histogram, suggesting the latest rally could be vulnerable to consolidation rather than a straight extension higher. Immediate support lies at the current price region near $77,000, ahead of a more structural cushion at the 200-day EMA around $71,805. Below that, the SuperTrend line at $70,570 and the clustered 100-day and 50-day EMAs at $67,410 and $66,777 form a broader demand zone that should attract buyers on deeper pullbacks. The topside remains technically open, but the overbought RSI and elevated MACD readings suggest new long positions would be better timed on dips toward the cited support layers rather than chasing price at current highs. 📊😱Altcoins outlook: Ethereum and XRP eye higher support levels Ethereum trades at $2,444, extending its advance well above the key moving averages, which keeps the near-term bias bullish. Price is comfortably above the 50-day EMA around $1,985 and the 100-day EMA near $1,973, while also holding over the longer-term 200-day EMA at approximately $2,141, suggesting a constructive trend structure. Momentum remains strong, with the MACD in positive territory and the RSI hovering in overbought territory near 77, hinting that upside pressure persists even as the rally starts to look stretched. Immediate support is found around $2,400, followed by the 200-day EMA at $2,141, which marks a more significant structural floor. Below that, the 50-day EMA at $1,985 and the 100-day EMA at $1,973 form a dense support cluster that should attract buyers on deeper pullbacks if the current overbought conditions trigger a corrective phase. Meanwhile, a decisive break above the next hurdle at $2,600 could pave the way for gains targeting $3,000. XRP, on the other hand, trades at $1.45, extending its sharp rebound and holding well above key moving averages, which tilts the near-term bias firmly bullish. The spot price has broken above the 50-day EMA at $1.14, the 100-day EMA at $1.18 and the 200-day EMA at $1.35, suggesting a strong impulsive move rather than a gradual trend shift. The RSI around 77 shows overbought conditions, while the MACD remains positive, hinting that upside momentum is robust but increasingly stretched. On the downside, the SuperTrend line at $1.25 acts as the first meaningful support level, where dip-buying interest could emerge if price retreats from current highs. On the topside, the reclaimed 200-day EMA at $1.35, followed by the 100-day EMA at $1.18 and the 50-day EMA at $1.14, now sit below market and reinforce the broader constructive structure, although the overbought RSI warns that consolidation or a corrective pullback toward the $1.25 area would be healthy before any fresh rally extension. #Todaycryptoupdates #BitcoinOpenInterestFallsToTwoMonthLow #BitcoinRises23.6%Weekly #AIHardwareStocksFallPreMarketAAOIDown11.66% #EtherETFsPost$697MWeeklyInflow $BTC

Crypto Today: Bitcoin, Ethereum and XRP pull back as rally cools

•Bitcoin stalls below the $80,000 resistance level while $77,000 offers short-term support.
•Ethereum corrects toward the $2,400 demand zone despite $697 million in weekly ETF inflows.
•XRP accelerates its decline after a stretched rally, defined by an overbought RSI.
The cryptocurrency market is broadly correcting on Monday as investors shift focus to profit-taking after last week’s rally. Bitcoin (BTC) is edging lower amid capped upside below $80,000, with immediate support at $77,000.
Meanwhile, Ethereum (ETH) holds above short-term support at $2,400 but lags upward momentum toward the next key resistance at $2,600. On the other hand, Ripple (XRP) hovers around $1.48 as momentum cools against the backdrop of a 72% surge last week from $1.00 to highs around $1.70.
🗣️ Bitcoin, Ethereum and XRP ETFs draw notable inflows
Bitcoin spot Exchange-Traded Funds (ETFs) recorded a significant jump in inflows, totaling $1.92 billion last week through Friday. This was the largest inflow volume since October, underpinning improving risk-on sentiment. Cumulative inflows now stand at $53.71 billion, rising from $51.79 billion posted the week before.
Ethereum spot ETFs saw renewed demand, with inflows totaling $697 million through Friday. This marks a massive upswing from roughly $2.26 million in outflows observed the previous week. Meanwhile, cumulative inflows stand at $12.15 billion, up from $11.45 billion the week before.
Institutional investors are also showing more appetite for XRP, with inflows totaling $40 million through Friday, up from $2.25 million the week before. According to SoSoValue data, cumulative inflows average $1.55 billion, with total assets under management at $1.33 billion.
If sustained, increasing demand for crypto investment products could boost the broader market’s recovery outlook. However, traders should temper expectations, as profit-taking could impede momentum and raise the chances of a deeper correction.
🚨Technical analysis: Bitcoin stalls amid a capped upside
Bitcoin trades at $77,240, holding well above the key Exponential Moving Averages (EMAs) and maintaining a clear bullish near-term bias. The 50-day EMA at $66,777, the 100-day EMA at $67,410, and the 200-day EMA at $71,805 all trail price and reinforce a well-supported uptrend, while the SuperTrend line at $70,570 also sits below spot, hinting at an intact bullish structure.
Although Bitcoin has corrected from the next key resistance level near $80,000, momentum remains stretched, with the Relative Strength Index (RSI) at 78 lodged in overbought territory and the Moving Average Convergence Divergence (MACD) above zero with a strong positive histogram, suggesting the latest rally could be vulnerable to consolidation rather than a straight extension higher.
Immediate support lies at the current price region near $77,000, ahead of a more structural cushion at the 200-day EMA around $71,805. Below that, the SuperTrend line at $70,570 and the clustered 100-day and 50-day EMAs at $67,410 and $66,777 form a broader demand zone that should attract buyers on deeper pullbacks. The topside remains technically open, but the overbought RSI and elevated MACD readings suggest new long positions would be better timed on dips toward the cited support layers rather than chasing price at current highs.
📊😱Altcoins outlook: Ethereum and XRP eye higher support levels
Ethereum trades at $2,444, extending its advance well above the key moving averages, which keeps the near-term bias bullish. Price is comfortably above the 50-day EMA around $1,985 and the 100-day EMA near $1,973, while also holding over the longer-term 200-day EMA at approximately $2,141, suggesting a constructive trend structure.
Momentum remains strong, with the MACD in positive territory and the RSI hovering in overbought territory near 77, hinting that upside pressure persists even as the rally starts to look stretched.
Immediate support is found around $2,400, followed by the 200-day EMA at $2,141, which marks a more significant structural floor. Below that, the 50-day EMA at $1,985 and the 100-day EMA at $1,973 form a dense support cluster that should attract buyers on deeper pullbacks if the current overbought conditions trigger a corrective phase. Meanwhile, a decisive break above the next hurdle at $2,600 could pave the way for gains targeting $3,000.
XRP, on the other hand, trades at $1.45, extending its sharp rebound and holding well above key moving averages, which tilts the near-term bias firmly bullish. The spot price has broken above the 50-day EMA at $1.14, the 100-day EMA at $1.18 and the 200-day EMA at $1.35, suggesting a strong impulsive move rather than a gradual trend shift.
The RSI around 77 shows overbought conditions, while the MACD remains positive, hinting that upside momentum is robust but increasingly stretched.
On the downside, the SuperTrend line at $1.25 acts as the first meaningful support level, where dip-buying interest could emerge if price retreats from current highs. On the topside, the reclaimed 200-day EMA at $1.35, followed by the 100-day EMA at $1.18 and the 50-day EMA at $1.14, now sit below market and reinforce the broader constructive structure, although the overbought RSI warns that consolidation or a corrective pullback toward the $1.25 area would be healthy before any fresh rally extension.
#Todaycryptoupdates
#BitcoinOpenInterestFallsToTwoMonthLow #BitcoinRises23.6%Weekly #AIHardwareStocksFallPreMarketAAOIDown11.66% #EtherETFsPost$697MWeeklyInflow
$BTC
·
--
صاعد
#EtherETFsPost$697MWeeklyInflow Ethereum’s ETF Story Just Got a Lot More Interesting Ethereum's ETF story may have just become one of the more interesting numbers in the market. Spot Ether ETFs pulled in roughly $697 million during the week ending August 21 — their strongest weekly inflow of 2026 and their best result since October 2025. The buying was consistent too, with inflows recorded across five consecutive sessions, rising from roughly $31 million on Monday to $221 million by Thursday. BlackRock's ETHA accounted for a large share of the total. At the same time, ETH gained roughly 30% for the week, briefly reaching around $2,546 and outperforming Bitcoin over the same period. Combined with roughly $1.92 billion flowing into U.S. Bitcoin ETFs, total crypto ETF inflows reached about $2.6 billion for the week. That's a sharp turnaround from the previous week's roughly $392 million in outflows. But the number I find most interesting isn't the price move. It's where the capital is flowing. Ether ETF assets now stand around $14.3 billion, representing a meaningful share of ETH's overall market value. That doesn't automatically prove long-term institutional conviction. Strong price momentum can attract capital just as easily as fundamental conviction can. So the next few weeks matter more than this one. Are these flows the beginning of durable institutional demand for Ethereum — or are institutions simply riding the momentum of the latest crypto breakout? $PROM $UAI $ETH {future}(ETHUSDT) {future}(UAIUSDT) {future}(PROMUSDT)

#EtherETFsPost$697MWeeklyInflow
Ethereum’s ETF Story Just Got a Lot More Interesting
Ethereum's ETF story may have just become one of the more interesting numbers in the market.
Spot Ether ETFs pulled in roughly $697 million during the week ending August 21 — their strongest weekly inflow of 2026 and their best result since October 2025.
The buying was consistent too, with inflows recorded across five consecutive sessions, rising from roughly $31 million on Monday to $221 million by Thursday. BlackRock's ETHA accounted for a large share of the total.
At the same time, ETH gained roughly 30% for the week, briefly reaching around $2,546 and outperforming Bitcoin over the same period.
Combined with roughly $1.92 billion flowing into U.S. Bitcoin ETFs, total crypto ETF inflows reached about $2.6 billion for the week.
That's a sharp turnaround from the previous week's roughly $392 million in outflows.
But the number I find most interesting isn't the price move.
It's where the capital is flowing.
Ether ETF assets now stand around $14.3 billion, representing a meaningful share of ETH's overall market value.
That doesn't automatically prove long-term institutional conviction. Strong price momentum can attract capital just as easily as fundamental conviction can.
So the next few weeks matter more than this one.
Are these flows the beginning of durable institutional demand for Ethereum — or are institutions simply riding the momentum of the latest crypto breakout?

$PROM $UAI $ETH

BTC+2.99%
ETH+3.08%
ETHAETF+4.21%
·
--
صاعد
#bitcoinrises23.6%weekly — best week in 3 years, and the dip is getting bought $BTC  printed its strongest week since Nov 2024 — +23.6% , from below $63K to a $79,550 peak — on $1.9B weekly ETF inflows, a textbook short squeeze, and the fiscal-fear trade. Monday's profit-taking flush to 76,689 was absorbed within hours: price reclaimed 77K, broke 78K, tagged 78,587 . Strategy is back in the green ($830M), Strive scooped 1,100 $BTC ($85M), and $BTC reclaimed the bear-market trend line for the first time since 2025. 1H structure: Overnight flush → 76,689 (Asia low) → V-recovery through 77,500 (resistance flipped to support) → breakout above 78,000 → now consolidating 78.3–78.6K against the 78,600–78,700 shelf. {future}(BTCUSDT) Setup — continuation long (buy the retest):  ▪ Entry: 77,300–77,700 retest of the flipped 77.5K shelf (aggressive: 76,900–77,100 flush zone, R/R ~1:2.7) ▪ SL: 76,400 | Invalidation: 1H close < 76,200 — below that, the rally is paused, not broken ▪ TP1: 78,600–78,700 (24h high, take 50%) ▪ TP2: 79,550 (week high) ▪ TP3: 80,000 (round + reported sell wall — break it and shorts panic-cover) R/R from 77,500: ~1:1.1 → 1:2.3 ⚠️ The catch: 80K is a wall (reported sell orders), Fear & Greed is 73 Greed, and we're extended after a 24% week — a healthy pause would be a flush into 76,200–75,400 (Strategy's cost basis). Don't chase strength; wait for the retest. Trigger: Buy the pullback, or does the 80K wall win first? 👇 #BitcoinOpenInterestFallsToTwoMonthLow #BitcoinRises23.6%Weekly #EtherETFsPost$697MWeeklyInflow #USTreasuryDoublesBuybackCapTo$4B

#bitcoinrises23.6%weekly — best week in 3 years, and the dip is getting bought

$BTC printed its strongest week since Nov 2024 — +23.6% , from below $63K to a $79,550 peak — on $1.9B weekly ETF inflows, a textbook short squeeze, and the fiscal-fear trade. Monday's profit-taking flush to 76,689 was absorbed within hours: price reclaimed 77K, broke 78K, tagged 78,587 . Strategy is back in the green ($830M), Strive scooped 1,100 $BTC ($85M), and $BTC reclaimed the bear-market trend line for the first time since 2025.

1H structure: Overnight flush → 76,689 (Asia low) → V-recovery through 77,500 (resistance flipped to support) → breakout above 78,000 → now consolidating 78.3–78.6K against the 78,600–78,700 shelf.

Setup — continuation long (buy the retest):
▪ Entry: 77,300–77,700 retest of the flipped 77.5K shelf (aggressive: 76,900–77,100 flush zone, R/R ~1:2.7)
▪ SL: 76,400 | Invalidation: 1H close < 76,200 — below that, the rally is paused, not broken
▪ TP1: 78,600–78,700 (24h high, take 50%)
▪ TP2: 79,550 (week high)
▪ TP3: 80,000 (round + reported sell wall — break it and shorts panic-cover)

R/R from 77,500: ~1:1.1 → 1:2.3

⚠️ The catch: 80K is a wall (reported sell orders), Fear & Greed is 73 Greed, and we're extended after a 24% week — a healthy pause would be a flush into 76,200–75,400 (Strategy's cost basis). Don't chase strength; wait for the retest.

Trigger: Buy the pullback, or does the 80K wall win first? 👇

#BitcoinOpenInterestFallsToTwoMonthLow #BitcoinRises23.6%Weekly #EtherETFsPost$697MWeeklyInflow #USTreasuryDoublesBuybackCapTo$4B
·
--
Ethereum’s Next Move Could Be Decided Here 👀 #EtherETFsPost$697MWeeklyInflow Ethereum has already delivered a massive move, but the interesting part may be what happens next. ETH has climbed roughly 30% in the past week, pushing toward the $2,500 area as institutional ETF demand remains strong. Now the market is entering a completely different phase: instead of asking whether ETH can recover, traders are watching whether this rally can turn into a real trend reversal. The next few days could be crucial. If ETH breaks and holds above $2,500, momentum could accelerate toward the $2,600–$2,700 zone. A stronger breakout above that area could open the door toward $3,000, especially if ETF inflows continue and Bitcoin remains bullish. But there is another side to the story. ETH has risen extremely fast, and several market indicators are showing stretched conditions. That means a short-term pullback or profit-taking move would not be surprising. For traders, the key question is no longer simply “Will ETH go up?” It is: Will ETH turn $2,500 into support—or get rejected from it? The next few daily candles could reveal whether this is the beginning of Ethereum’s bigger comeback… or just a powerful relief rally. 🚀📊 #Ethereum #ETH #EthereumNews #ETHPrice #crypto #CryptoNews #CryptoMarket #Bitcoin #BTC #Altcoins #DeFi #EthereumETF #ETFInflows #CryptoTrading #Trading #TechnicalAnalysis #PriceAction #Bullish #Bearish #CryptoInvesting #Blockchain #Web3 #ETHUSDT #CryptoUpdate #MarketAnalysis #EthereumPrice #CryptoTraders #BTCUSDT #AltcoinSeason

Ethereum’s Next Move Could Be Decided Here 👀

#EtherETFsPost$697MWeeklyInflow

Ethereum has already delivered a massive move, but the interesting part may be what happens next.
ETH has climbed roughly 30% in the past week, pushing toward the $2,500 area as institutional ETF demand remains strong. Now the market is entering a completely different phase: instead of asking whether ETH can recover, traders are watching whether this rally can turn into a real trend reversal.
The next few days could be crucial.
If ETH breaks and holds above $2,500, momentum could accelerate toward the $2,600–$2,700 zone. A stronger breakout above that area could open the door toward $3,000, especially if ETF inflows continue and Bitcoin remains bullish.
But there is another side to the story.
ETH has risen extremely fast, and several market indicators are showing stretched conditions. That means a short-term pullback or profit-taking move would not be surprising.
For traders, the key question is no longer simply “Will ETH go up?”
It is:
Will ETH turn $2,500 into support—or get rejected from it?
The next few daily candles could reveal whether this is the beginning of Ethereum’s bigger comeback… or just a powerful relief rally. 🚀📊

#Ethereum #ETH #EthereumNews #ETHPrice #crypto #CryptoNews #CryptoMarket #Bitcoin #BTC #Altcoins #DeFi #EthereumETF #ETFInflows #CryptoTrading #Trading #TechnicalAnalysis #PriceAction #Bullish #Bearish #CryptoInvesting #Blockchain #Web3 #ETHUSDT #CryptoUpdate #MarketAnalysis #EthereumPrice #CryptoTraders #BTCUSDT #AltcoinSeason

مقالة
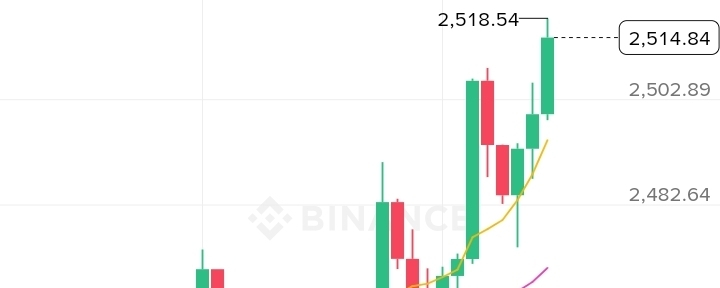
ETH/USDT — 15-Minute Trade Plan$ETH Current price: $2,514.84 Trend: Bullish 24h high: $2,518.54 24h low: $2,389.85 1. Market Structure The 15-minute chart shows a clear short-term bullish structure: - Price is making higher highs and higher lows. - ETH is trading above all three moving averages. - MA(7): $2,495.13 - MA(25): $2,470.54 - MA(99): $2,453.18 - MA7 > MA25 > MA99 confirms bullish momentum. - Recent candles show strong buying pressure, supported by increased volume. - Price is currently testing the $2,518–$2,523 resistance zone. The key issue is that ETH is already close to resistance, so chasing the current candle carries higher risk. 2. Key Levels Resistance - R1: $2,518.50 - R2: $2,523.15 - R3: $2,540–$2,550 - R4: $2,575–$2,600 Support - S1: $2,502–$2,495 - S2: $2,482–$2,470 - S3: $2,462–$2,453 - Major invalidation zone: below $2,440 3. Preferred Long Setup — Breakout Do not enter simply because price touches $2,518. Entry: $2,520–$2,525 Only enter after a 15-minute candle closes convincingly above $2,518–$2,523 with healthy volume. Stop-loss: $2,498 Targets: - TP1: $2,540 - TP2: $2,555 - TP3: $2,575 - TP4: $2,600 After TP1, consider moving the stop toward breakeven. 4. Safer Long Setup — Pullback This is the preferred risk-controlled setup if ETH fails to break resistance immediately. Entry zone: $2,495–$2,505 Look for: - Bullish rejection wick - Bullish engulfing candle - Higher low - Volume returning on the bounce Stop-loss: $2,478 Targets: - TP1: $2,518 - TP2: $2,540 - TP3: $2,555 - TP4: $2,575 A deeper pullback toward $2,470–$2,482 can provide another long opportunity if buyers defend that zone. 5. Rejection / Short Scenario A short should not be taken merely because ETH reaches resistance. Consider a short only if price: 1. Rejects $2,518–$2,523 strongly. 2. Produces a bearish reversal candle. 3. Breaks below approximately $2,502 with increasing selling volume. Possible short entry: $2,500–$2,505 after confirmation Stop-loss: $2,525 Targets: - TP1: $2,482 - TP2: $2,470 - TP3: $2,453 This is a countertrend setup, so the long side remains preferable while the bullish structure is intact. 6. $500 Example Position Plan For a $500 trading account, avoid risking the entire $500. If using the pullback setup: Entry: $2,500 Stop: $2,478 Risk per ETH: approximately $22 For a maximum 1% account risk = $5, position size would be approximately: $5 ÷ $22 = 0.227 ETH Approximate position value: 0.227 × $2,500 ≈ $568 This illustrates why position size should be calculated from the stop distance rather than simply allocating the whole account. 7. Trade Management - Take partial profit at TP1. - Move the stop toward breakeven after a confirmed continuation. - Take another partial at TP2. - Trail the remaining position beneath recent 15-minute higher lows. - Do not add aggressively to a losing position. - If volume disappears during the breakout, avoid chasing. - If ETH closes back below $2,495 after a failed breakout, reassess rather than forcing the trade. 8. Bullish Confirmation The strongest bullish signal would be: $2,523 breakout → 15m close above resistance → successful retest of $2,518–$2,523 → higher low → continuation. That structure would open the way toward $2,540, $2,555 and potentially $2,575–$2,600. 9. Invalidation The immediate bullish setup weakens if ETH loses $2,482 with strong selling pressure. A deeper breakdown below $2,462–$2,453 would significantly weaken the current 15-minute bullish structure. Final Trading Bias Bias: BULLISH, but resistance is very close. Best approach: Do not chase $2,514–$2,518. Prefer either: A) confirmed breakout above $2,523, or B) controlled pullback into $2,495–$2,505 followed by bullish confirmation. Key decision level: $2,523. Above it with confirmation: bullish continuation. Repeated rejection: wait for a pullback. Breakdown below $2,482: bullish setup requires reassessment.#EtherETFsPost$697MWeeklyInflow This is a technical chart-based plan, not a guarantee of future price movement. Use position sizing and a predefined maximum loss.

ETH/USDT — 15-Minute Trade Plan

$ETH Current price: $2,514.84
Trend: Bullish
24h high: $2,518.54
24h low: $2,389.85
1. Market Structure
The 15-minute chart shows a clear short-term bullish structure:
- Price is making higher highs and higher lows.
- ETH is trading above all three moving averages.
- MA(7): $2,495.13
- MA(25): $2,470.54
- MA(99): $2,453.18
- MA7 > MA25 > MA99 confirms bullish momentum.
- Recent candles show strong buying pressure, supported by increased volume.
- Price is currently testing the $2,518–$2,523 resistance zone.
The key issue is that ETH is already close to resistance, so chasing the current candle carries higher risk.
2. Key Levels
Resistance
- R1: $2,518.50
- R2: $2,523.15
- R3: $2,540–$2,550
- R4: $2,575–$2,600
Support
- S1: $2,502–$2,495
- S2: $2,482–$2,470
- S3: $2,462–$2,453
- Major invalidation zone: below $2,440
3. Preferred Long Setup — Breakout
Do not enter simply because price touches $2,518.
Entry: $2,520–$2,525
Only enter after a 15-minute candle closes convincingly above $2,518–$2,523 with healthy volume.
Stop-loss: $2,498
Targets:
- TP1: $2,540
- TP2: $2,555
- TP3: $2,575
- TP4: $2,600
After TP1, consider moving the stop toward breakeven.
4. Safer Long Setup — Pullback
This is the preferred risk-controlled setup if ETH fails to break resistance immediately.
Entry zone: $2,495–$2,505
Look for:
- Bullish rejection wick
- Bullish engulfing candle
- Higher low
- Volume returning on the bounce
Stop-loss: $2,478
Targets:
- TP1: $2,518
- TP2: $2,540
- TP3: $2,555
- TP4: $2,575
A deeper pullback toward $2,470–$2,482 can provide another long opportunity if buyers defend that zone.
5. Rejection / Short Scenario
A short should not be taken merely because ETH reaches resistance.
Consider a short only if price:
1. Rejects $2,518–$2,523 strongly.
2. Produces a bearish reversal candle.
3. Breaks below approximately $2,502 with increasing selling volume.
Possible short entry: $2,500–$2,505 after confirmation
Stop-loss: $2,525
Targets:
- TP1: $2,482
- TP2: $2,470
- TP3: $2,453
This is a countertrend setup, so the long side remains preferable while the bullish structure is intact.
6. $500 Example Position Plan
For a $500 trading account, avoid risking the entire $500.
If using the pullback setup:
Entry: $2,500
Stop: $2,478
Risk per ETH: approximately $22
For a maximum 1% account risk = $5, position size would be approximately:
$5 ÷ $22 = 0.227 ETH
Approximate position value:
0.227 × $2,500 ≈ $568
This illustrates why position size should be calculated from the stop distance rather than simply allocating the whole account.
7. Trade Management
- Take partial profit at TP1.
- Move the stop toward breakeven after a confirmed continuation.
- Take another partial at TP2.
- Trail the remaining position beneath recent 15-minute higher lows.
- Do not add aggressively to a losing position.
- If volume disappears during the breakout, avoid chasing.
- If ETH closes back below $2,495 after a failed breakout, reassess rather than forcing the trade.
8. Bullish Confirmation
The strongest bullish signal would be:
$2,523 breakout → 15m close above resistance → successful retest of $2,518–$2,523 → higher low → continuation.
That structure would open the way toward $2,540, $2,555 and potentially $2,575–$2,600.
9. Invalidation
The immediate bullish setup weakens if ETH loses $2,482 with strong selling pressure.
A deeper breakdown below $2,462–$2,453 would significantly weaken the current 15-minute bullish structure.
Final Trading Bias
Bias: BULLISH, but resistance is very close.
Best approach: Do not chase $2,514–$2,518. Prefer either:
A) confirmed breakout above $2,523, or
B) controlled pullback into $2,495–$2,505 followed by bullish confirmation.
Key decision level: $2,523.
Above it with confirmation: bullish continuation.
Repeated rejection: wait for a pullback.
Breakdown below $2,482: bullish setup requires reassessment.#EtherETFsPost$697MWeeklyInflow
This is a technical chart-based plan, not a guarantee of future price movement. Use position sizing and a predefined maximum loss.
Treasury doubled its long-end buyback cap from $2B to ≥$4B per operation (Sept 9–Nov 4) — and CNBC says it may fund bigger rounds from its ~$950B TGA , a potential ~$1T "Bessent Put". Not QE, but Washington capping its own yield curve with its own checkbook. Tape: 30Y dropped 9bps to 5.194% on the news → gave it all back to 5.276% . DXY at multi-month lows, gold +5.2%/wk , BTC >$78K with ~$1.4B shorts liquidated . The line in the sand: ▪ 30Y must hold below 5.30% (19-yr high) — a close above kills the "cap" narrative ▪ Today's 2pm ET presser (a real fiscal number changes everything) · PCE Wed · NVDA Wed · Jackson Hole/Warsh Fri ▪ Buyback ops begin Sept 9 Trade: stay long gold & $BTC while 30Y < 5.30% and DXY stays weak. Invalidation: 30Y closes > 5.30% or a hawkish surprise today. Trigger: Real put, or $4B against a $40T debt market? The 30-year answers first. 👇 {future}(BTCUSDT) #BitcoinOpenInterestFallsToTwoMonthLow #BitcoinRises23.6%Weekly #EtherETFsPost$697MWeeklyInflow #USTreasuryDoublesBuybackCapTo$4B #GoldReboundsAbove$4600
Treasury doubled its long-end buyback cap from $2B to ≥$4B per operation (Sept 9–Nov 4) — and CNBC says it may fund bigger rounds from its ~$950B TGA , a potential ~$1T "Bessent Put". Not QE, but Washington capping its own yield curve with its own checkbook.

Tape: 30Y dropped 9bps to 5.194% on the news → gave it all back to 5.276% . DXY at multi-month lows, gold +5.2%/wk , BTC >$78K with ~$1.4B shorts liquidated .

The line in the sand: ▪ 30Y must hold below 5.30% (19-yr high) — a close above kills the "cap" narrative ▪ Today's 2pm ET presser (a real fiscal number changes everything) · PCE Wed · NVDA Wed · Jackson Hole/Warsh Fri ▪ Buyback ops begin Sept 9

Trade: stay long gold & $BTC while 30Y < 5.30% and DXY stays weak. Invalidation: 30Y closes > 5.30% or a hawkish surprise today.

Trigger: Real put, or $4B against a $40T debt market? The 30-year answers first. 👇

#BitcoinOpenInterestFallsToTwoMonthLow #BitcoinRises23.6%Weekly #EtherETFsPost$697MWeeklyInflow #USTreasuryDoublesBuybackCapTo$4B #GoldReboundsAbove$4600
$VELVET 's market maker is DWF Labs. June: pumped 0.09 → 0.9 (10x). During the run, project-linked wallets moved 22M VELVET ($19.8M) to exchanges; DWF Labs moved 6.68M ($6M). Aug 18: dumped 0.815 → 0.538. On-chain caught 3 addresses dumping 47.9M tokens combined — 4.2% of circulating supply. Today: 0.9 → 0.17, then a bounce 0.17 → 0.4. Same pump → distribute → dump → bait pipeline. New protagonist, same script. On-chain says: someone is waiting for you at 0.4. OI collapsed from 15M → 4.9M, then bounced. That's not fresh money — that's shorts covering after leveraged longs got flushed. "Coins whales finish distributing grind lower ~80% of the time — bounces are exits, not recoveries." At 0.4, the air above is full of trapped bags. The sell wall is far thicker than the bid. To push through? Someone has to pay real money to free the prisoners above. 0.4 isn't the bottom. It's the new distribution zone. Today's low: 0.1756. The 0.17 → 0.4 bounce is +120% — but violent bounces after deep dumps are usually not reversals. That's shorts covering and the MM baiting. Once enough FOMO retail bags the top, one more wick is all it takes. {future}(VELVETUSDT) #BitcoinOpenInterestFallsToTwoMonthLow #BitcoinRises23.6%Weekly #EtherETFsPost$697MWeeklyInflow #USTreasuryDoublesBuybackCapTo$4B #GoldReboundsAbove$4600
$VELVET 's market maker is DWF Labs.

June: pumped 0.09 → 0.9 (10x). During the run, project-linked wallets moved 22M VELVET ($19.8M) to exchanges; DWF Labs moved 6.68M ($6M).

Aug 18: dumped 0.815 → 0.538. On-chain caught 3 addresses dumping 47.9M tokens combined — 4.2% of circulating supply.
Today: 0.9 → 0.17, then a bounce 0.17 → 0.4. Same pump → distribute → dump → bait pipeline. New protagonist, same script.
On-chain says: someone is waiting for you at 0.4.

OI collapsed from 15M → 4.9M, then bounced. That's not fresh money — that's shorts covering after leveraged longs got flushed.
"Coins whales finish distributing grind lower ~80% of the time — bounces are exits, not recoveries."

At 0.4, the air above is full of trapped bags. The sell wall is far thicker than the bid. To push through? Someone has to pay real money to free the prisoners above.

0.4 isn't the bottom. It's the new distribution zone.

Today's low: 0.1756. The 0.17 → 0.4 bounce is +120% — but violent bounces after deep dumps are usually not reversals. That's shorts covering and the MM baiting. Once enough FOMO retail bags the top, one more wick is all it takes.

#BitcoinOpenInterestFallsToTwoMonthLow #BitcoinRises23.6%Weekly #EtherETFsPost$697MWeeklyInflow #USTreasuryDoublesBuybackCapTo$4B #GoldReboundsAbove$4600
·
--
هابط
#sp500futuresfall — the Bessent bounce just got sold S&P 500 futures opened red as the ~$1T TGA repurchase boost faded within 24 hours. The 773.07 spike was sold straight down to 763.99 overnight. $NVDA 's chip price-hike report is dragging Nasdaq (5-day slump), while gold is the only safe haven bid (+1.5% at $4,670). 1H structure: Rejection at 773.07 → breakdown through 771.87 → 767.22 → 765.12 — lower lows all night → double-touch at 763.99/764.01. Price is now retesting the broken shelf at 765.5–766.0 from below. Setup — continuation short: ▪ Entry: 766.3–767.5 retest of the broken 767 floor (aggressive: re-break of 763.90) ▪ SL: 769.20 | Invalidation: 1H close > 769.0 — breakdown candle reclaimed = thesis dead ▪ TP1: 764.00 (overnight low, take 50%) ▪ TP2: 762.30  ▪ TP3: 760.50 (measured move of the 773→764 flush) R/R from 766.9: ~1:1.3 → 1:2.8 ⚠️ The catch: Iran sanction details (Bessent) and NVDA news are binary and headline-driven. If futures gap back above 769, the short is invalid — don't argue with the open. Size small, don't hold through the announcement. Trigger: Fade the bounce, or is this dip the buy? 👇 #BitcoinRises23.6%Weekly #TheoDõiFOMC #EtherETFsPost$697MWeeklyInflow #USTreasuryDoublesBuybackCapTo$4B
#sp500futuresfall — the Bessent bounce just got sold

S&P 500 futures opened red as the ~$1T TGA repurchase boost faded within 24 hours. The 773.07 spike was sold straight down to 763.99 overnight. $NVDA 's chip price-hike report is dragging Nasdaq (5-day slump), while gold is the only safe haven bid (+1.5% at $4,670).

1H structure: Rejection at 773.07 → breakdown through 771.87 → 767.22 → 765.12 — lower lows all night → double-touch at 763.99/764.01. Price is now retesting the broken shelf at 765.5–766.0 from below.

Setup — continuation short: ▪ Entry: 766.3–767.5 retest of the broken 767 floor (aggressive: re-break of 763.90)
▪ SL: 769.20 | Invalidation: 1H close > 769.0 — breakdown candle reclaimed = thesis dead
▪ TP1: 764.00 (overnight low, take 50%)
▪ TP2: 762.30
▪ TP3: 760.50 (measured move of the 773→764 flush)

R/R from 766.9: ~1:1.3 → 1:2.8

⚠️ The catch: Iran sanction details (Bessent) and NVDA news are binary and headline-driven. If futures gap back above 769, the short is invalid — don't argue with the open. Size small, don't hold through the announcement.

Trigger: Fade the bounce, or is this dip the buy? 👇

#BitcoinRises23.6%Weekly #TheoDõiFOMC #EtherETFsPost$697MWeeklyInflow #USTreasuryDoublesBuybackCapTo$4B
ABO3ZAM:
تحليل فني دقيق وسيتوب صفقات مرتبة باحترافية، بانتظار تأكيد كسر الدعم لفرص قوية يا وحش 📊🎯
تمّ التحقق
Binance anunció el lanzamiento de Lite Loan, un producto de financiación que permite a los usuarios.Binance anunció el lanzamiento de Lite Loan, un producto de financiación que permite a los usuarios depositar Bitcoin como garantía y obtener hasta 1.000 Usdt, esto sin riesgo de liquidación por fluctuaciones de precio durante el plazo inicial de 30 días. Al cabo de de los primeros 30 días, los usuarios pueden mantenerse en mora por un depósito adicional de 30 días en el que se aplicarán cargos por intereses y el riesgo de liquidación por precio estándar, además la garantía podrá liquidarse si se superan los umbrales de relación entre el monto solicitado y su valor actualizado. "Si el valor solicitado sigue pendiente después de este período adicional de 30 días, la garantía se liquidará para el reembolso", explicaron desde Binance. Los usuarios también pueden aportar como garantía para Lite Loan el BTC que ya tengan suscrito en productos Simple Earn Flexible, lo que les permite seguir obteniendo rendimientos de Simple Earn mientras acceden a liquidez. "Lite Loan está diseñado para los usuarios que quieren acceder a liquidez sin la complejidad que suele acompañar a los préstamos cripto", anotó Jeff Li, vicepresidente de Producto de Binance. "A medida que Binance continúa evolucionando hacia una súper app financiera, nos enfocamos en alinear nuestros productos con la forma en que las personas realmente usan sus activos digitales, ya sea para operar, gastar o gestionar su flujo de caja", añadió. #BitcoinOpenInterestFallsToTwoMonthLow #EtherETFsPost$697MWeeklyInflow

Binance anunció el lanzamiento de Lite Loan, un producto de financiación que permite a los usuarios.

Binance anunció el lanzamiento de Lite Loan, un producto de financiación que permite a los usuarios depositar Bitcoin como garantía y obtener hasta 1.000 Usdt, esto sin riesgo de liquidación por fluctuaciones de precio durante el plazo inicial de 30 días.
Al cabo de de los primeros 30 días, los usuarios pueden mantenerse en mora por un depósito adicional de 30 días en el que se aplicarán cargos por intereses y el riesgo de liquidación por precio estándar, además la garantía podrá liquidarse si se superan los umbrales de relación entre el monto solicitado y su valor actualizado.
"Si el valor solicitado sigue pendiente después de este período adicional de 30 días, la garantía se liquidará para el reembolso", explicaron desde Binance.
Los usuarios también pueden aportar como garantía para Lite Loan el BTC que ya tengan suscrito en productos Simple Earn Flexible, lo que les permite seguir obteniendo rendimientos de Simple Earn mientras acceden a liquidez.
"Lite Loan está diseñado para los usuarios que quieren acceder a liquidez sin la complejidad que suele acompañar a los préstamos cripto", anotó Jeff Li, vicepresidente de Producto de Binance. "A medida que Binance continúa evolucionando hacia una súper app financiera, nos enfocamos en alinear nuestros productos con la forma en que las personas realmente usan sus activos digitales, ya sea para operar, gastar o gestionar su flujo de caja", añadió.
#BitcoinOpenInterestFallsToTwoMonthLow #EtherETFsPost$697MWeeklyInflow
سجّل الدخول لاستكشاف المزيد من المُحتوى
انضم إلى مُستخدمي العملات الرقمية حول العالم على Binance Square
⚡️ احصل على أحدث المعلومات المفيدة عن العملات الرقمية.
💬 موثوقة من قبل أكبر منصّة لتداول العملات الرقمية في العالم.
👍 اكتشف الرؤى الحقيقية من صنّاع المُحتوى الموثوقين.
البريد الإلكتروني / رقم الهاتف