

Huutruong
10.3k 貼文

Huutruong
舉報
封鎖用戶
💰 Theo dõi Crypto | Tìm kiếm cơ hội mỗi ngày ( KITE-277880 )
實盤交易
中頻交易者
5.5 年
3.6K+ 關注
2.4K+ 粉絲
846 點讚數
貼文
投資組合
全部
引用
影片
直播
·
--
看跌
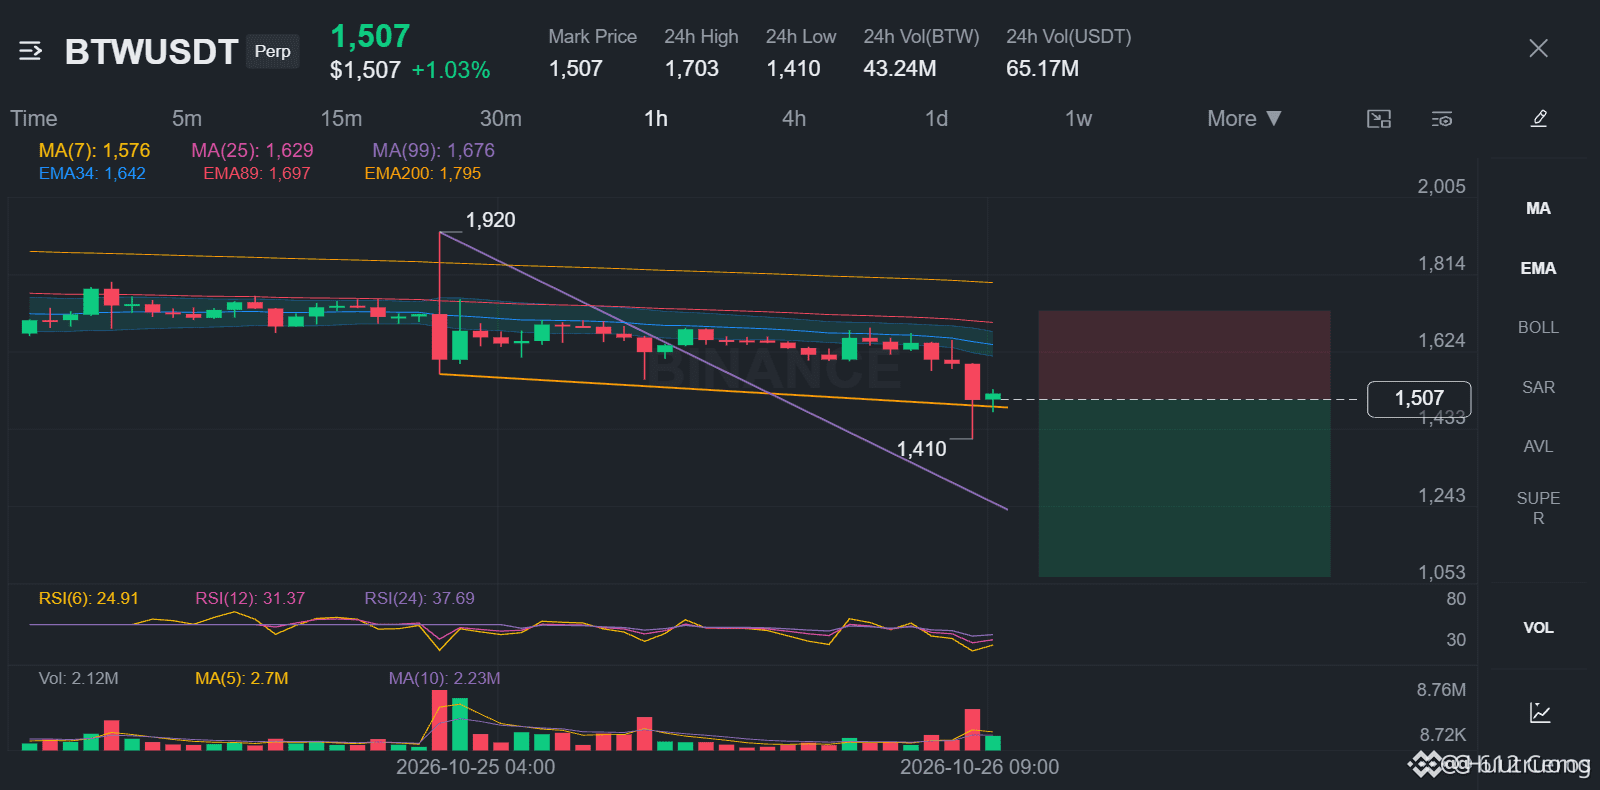
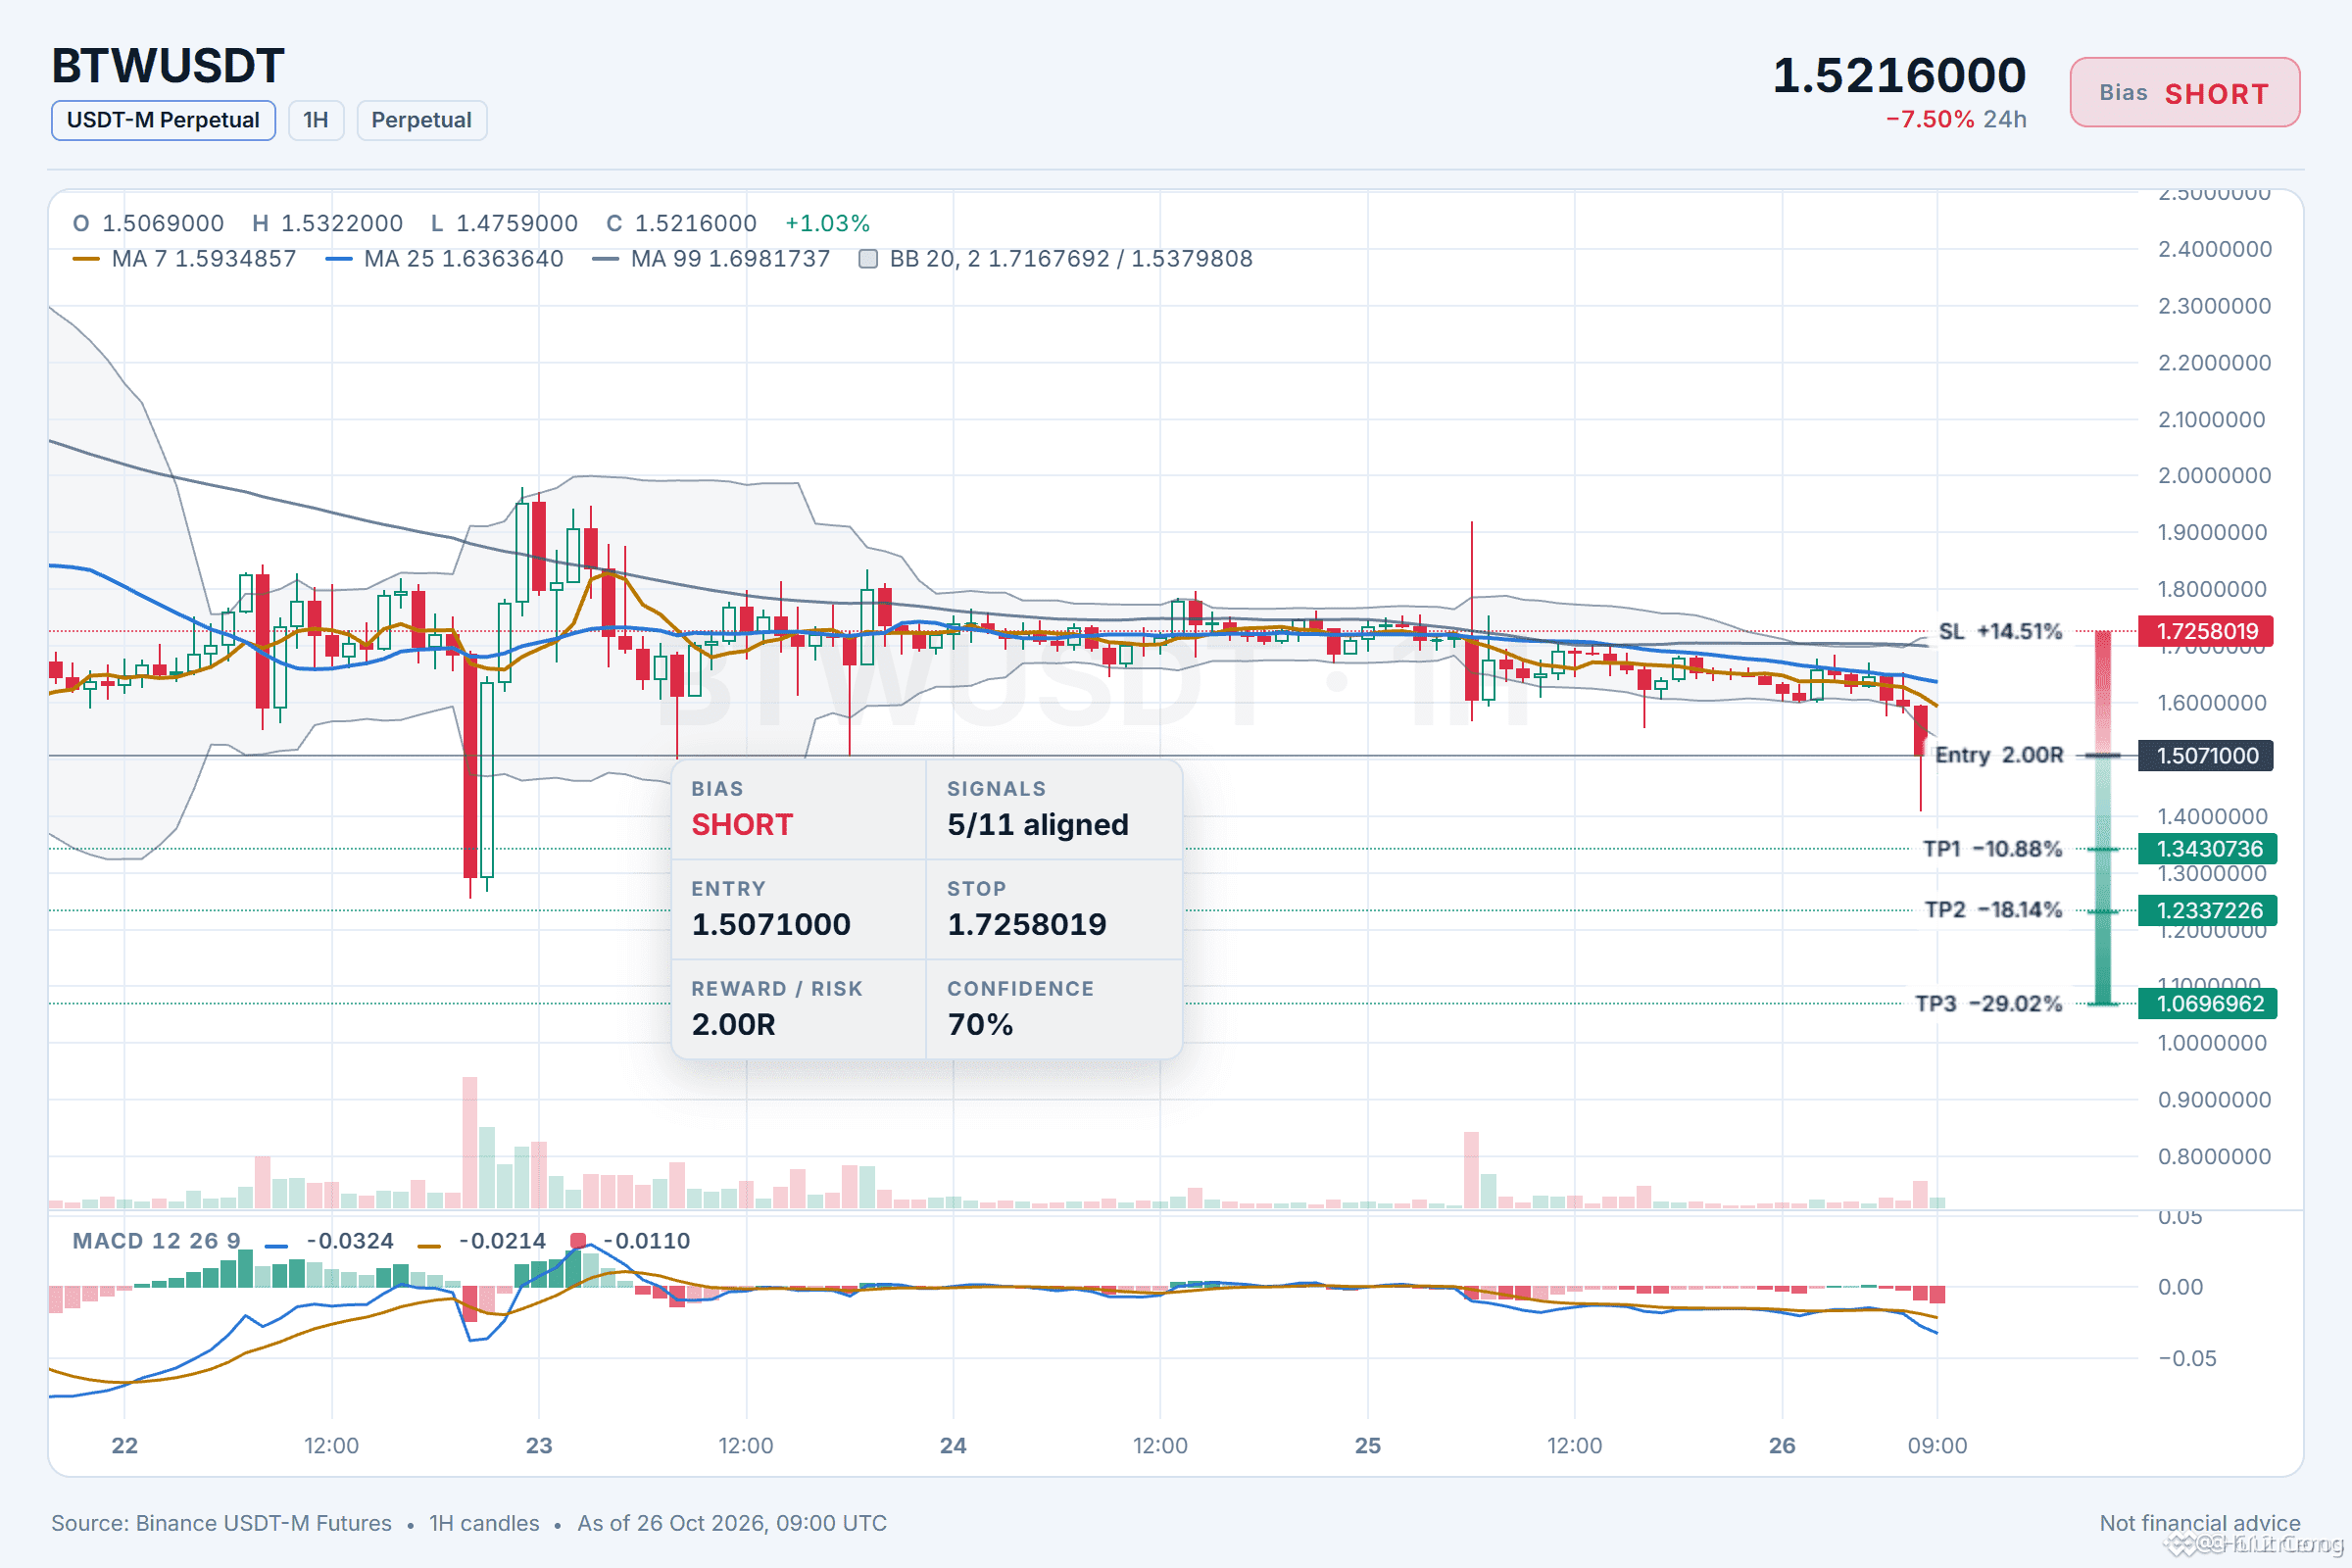
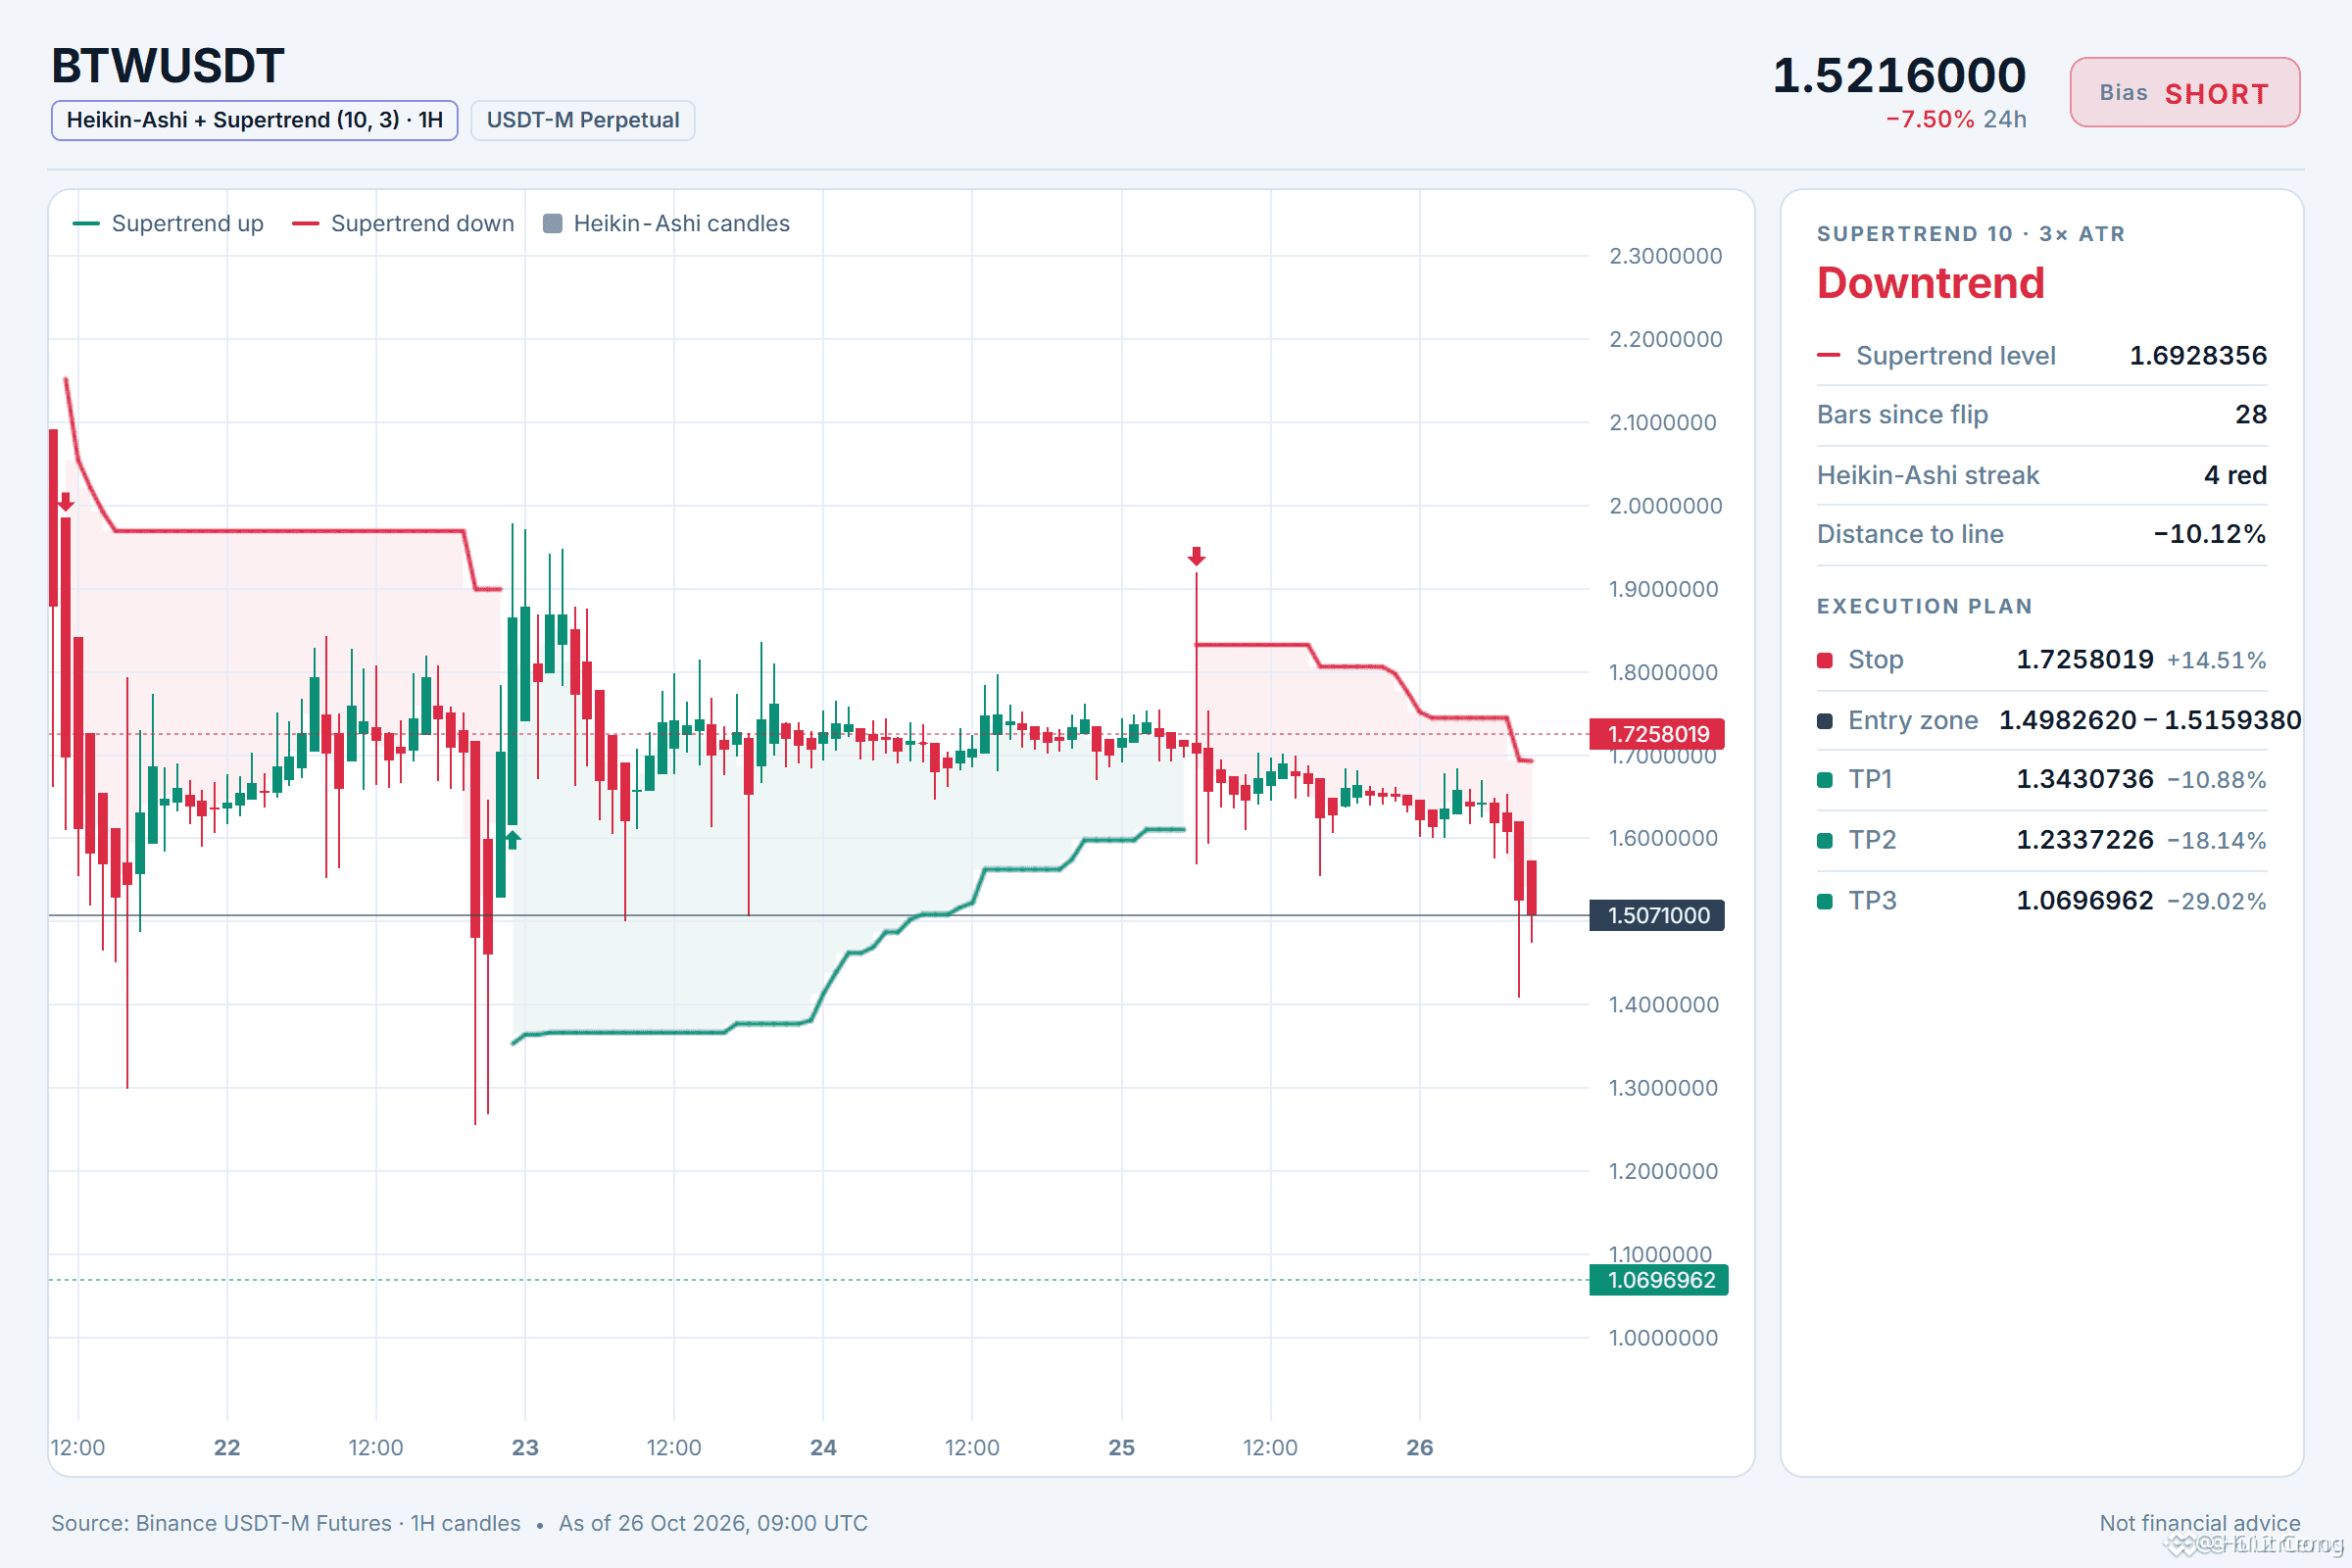
🔴 做空 $BTW /USDT:預期價格將下跌
偏向:做空 · 傾向
進場:1.4982620 – 1.5159380
TP1:1.3430736 (-10.9%)
TP2:1.2337226 (-18.1%)
TP3:1.0696962 (-29.0%)
SL:1.7258019 (+14.5%)
計畫:僅在區間內進場,TP1 平倉 50%,TP2 平倉 25%,TP3 平倉 25%,並在 TP1 後將止損移至進場價。
注意:信心程度僅屬中等,請控制倉位。
1 小時價格低於 EMA50 和 EMA200
為何做空?5/11 個訊號一致,0 個訊號相反。
• 1 小時趨勢向下(低於 EMA50 和 EMA200)
• 賣方正主導走勢(15 分鐘 ADX 35.0)
• 賣方動能強勁(4 小時 RSI 41.4)
1 小時 RSI 為 33,代表賣方動能明顯。進場價約為 1.5071000,失效位為 1.7258019。
這筆做空交易的失效位是多少?
·
--
看漲
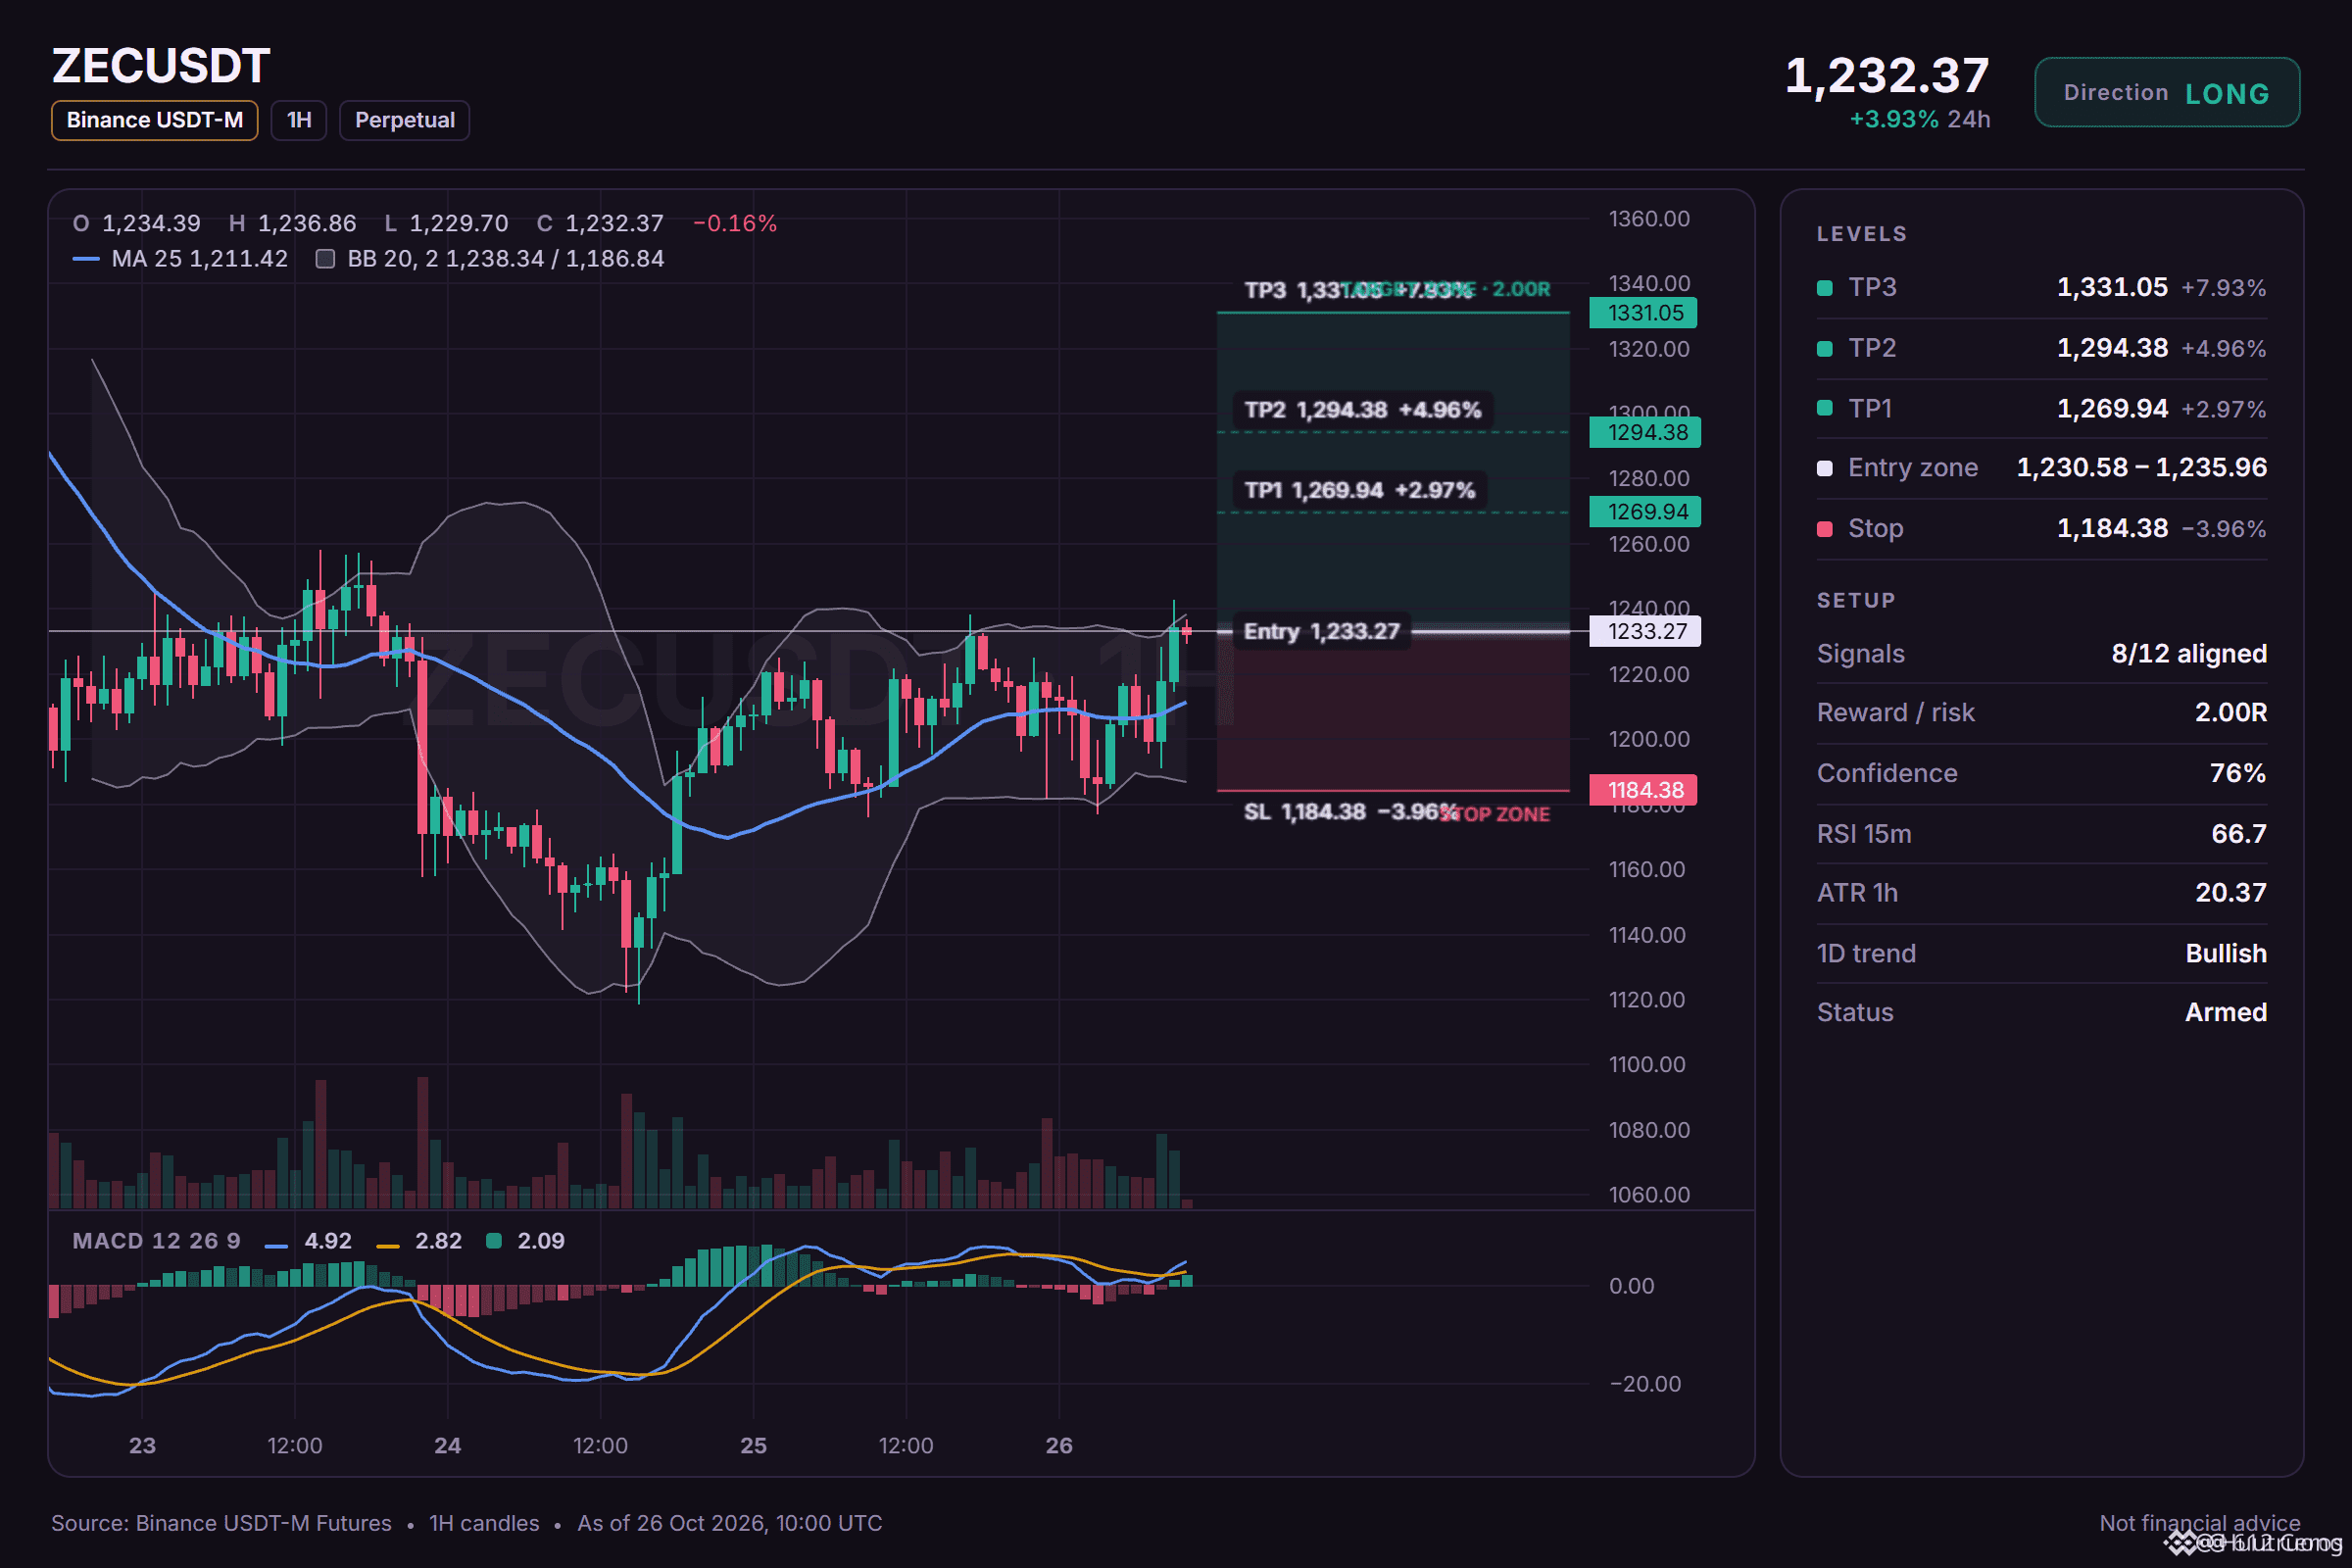
ZEC 做多布局:我關注的價位
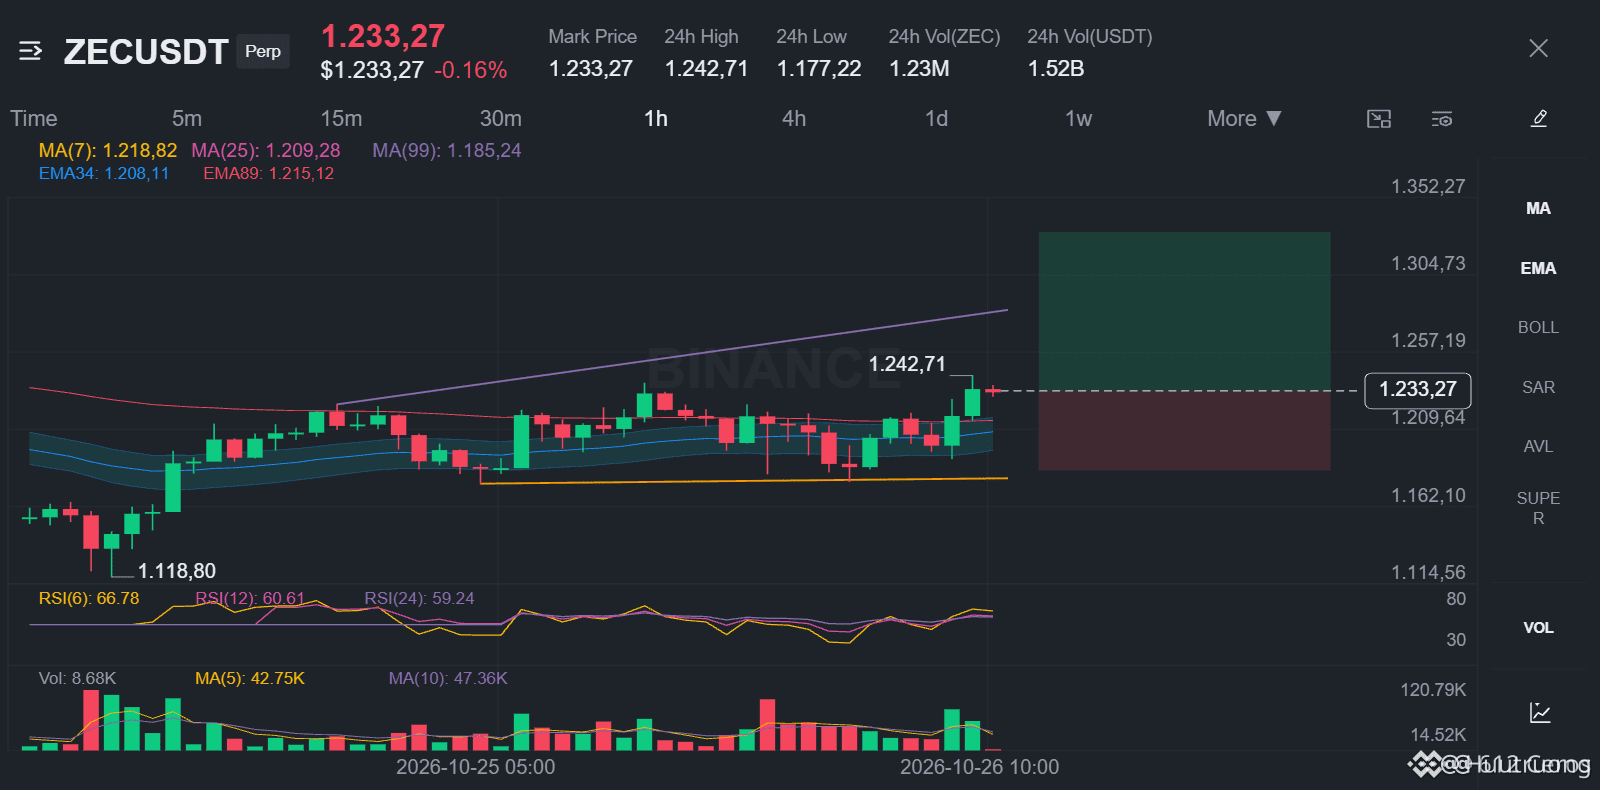
🟢 做多 $ZEC /USDT:預期價格上漲
偏向:做多 · 強
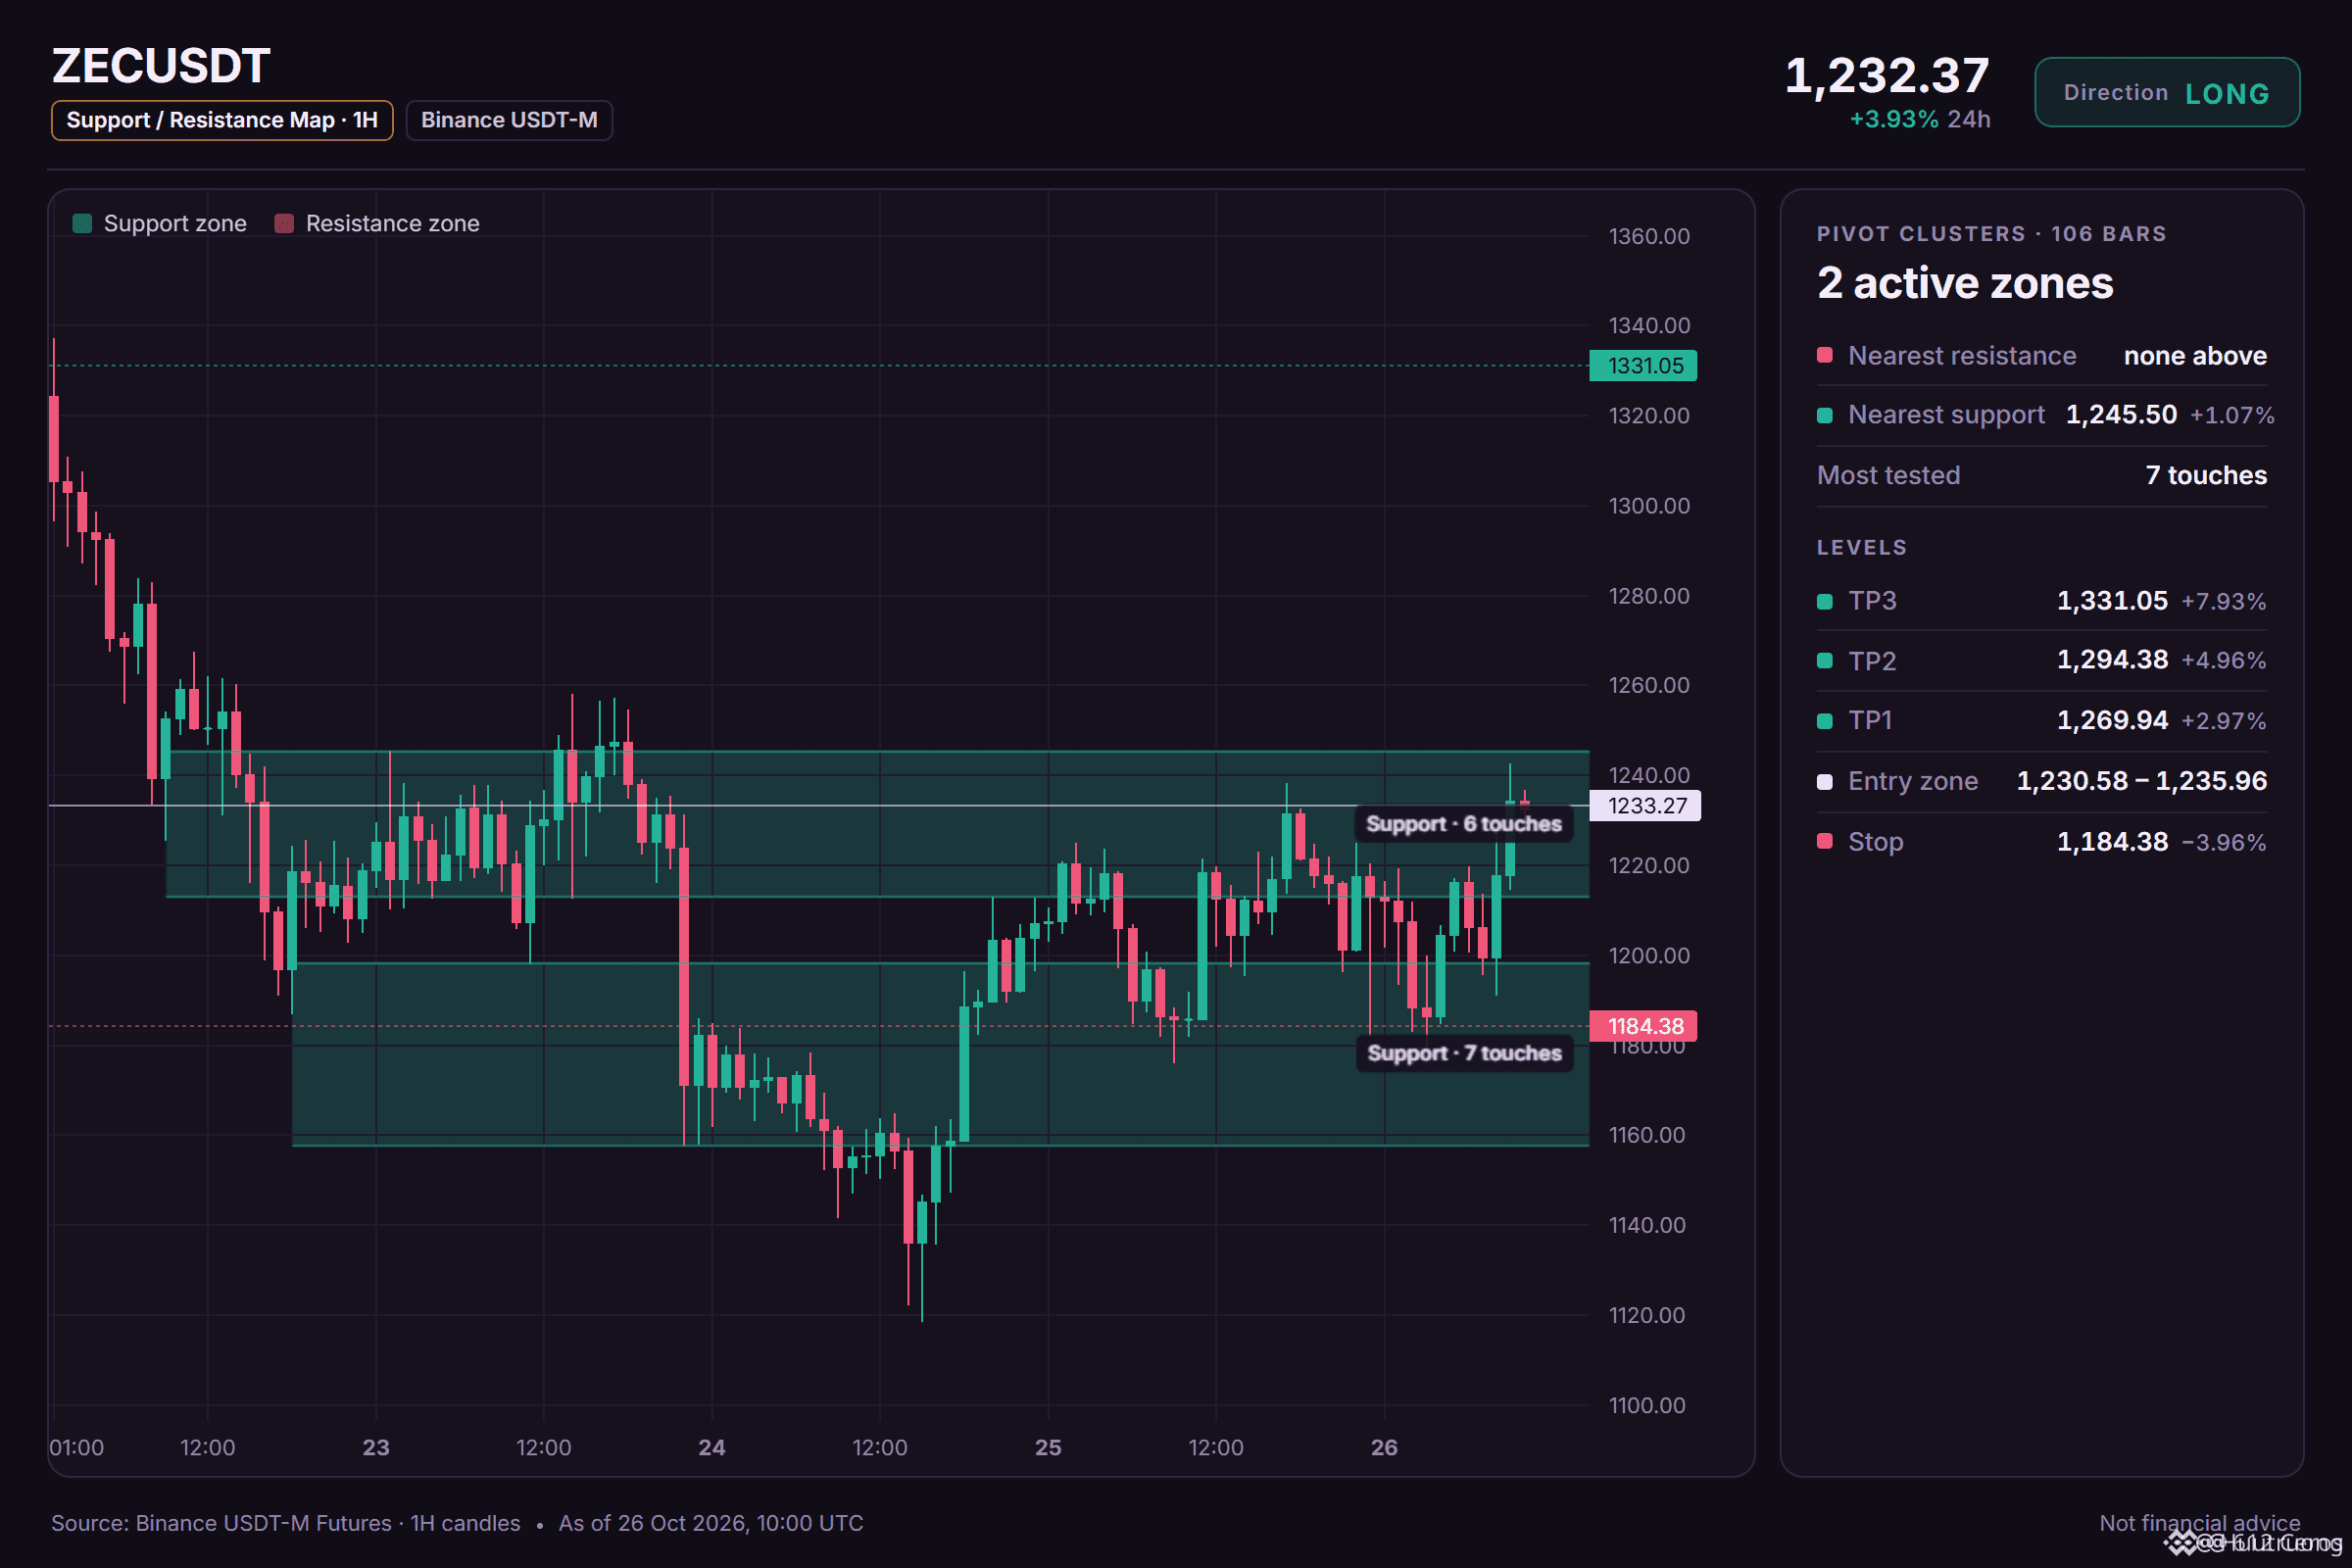
進場:1230.58 – 1235.96
TP1:1269.94 (+3.0%)
TP2:1294.38 (+5.0%)
TP3:1331.05 (+7.9%)
止損:1184.38 (-4.0%)
計畫:只在區間內進場,TP1 平倉 50%,TP2 平倉 25%,TP3 平倉 25%,並在 TP1 達成後將止損移至進場價。
為什麼做多?12 個訊號中有 8 個一致看多,1 個相反。
• 日線趨勢向上(位於 EMA50 和 EMA200 上方)
• 1 小時趨勢向上(位於 EMA50 和 EMA200 上方)
• BTC 正在上漲,這種幣也會跟著走(相關係數 0.82)
風險:接近區間頂部,賣方常會進場(RSI z +2.01)
我看好的原因:
日線趨勢呈現看漲訊號,12 個訊號中有 8 個一致偏向做多。計畫是在 1230.58 – 1235.96 區間操作,於 1269.94 和 1294.38 分批獲利了結,並耐心等待 1331.05。若價格跌破 1184.38,就代表這個想法錯了,止損也會發揮作用。
你覺得價格會先到 1269.94,還是先觸發止損?
·
--
看漲
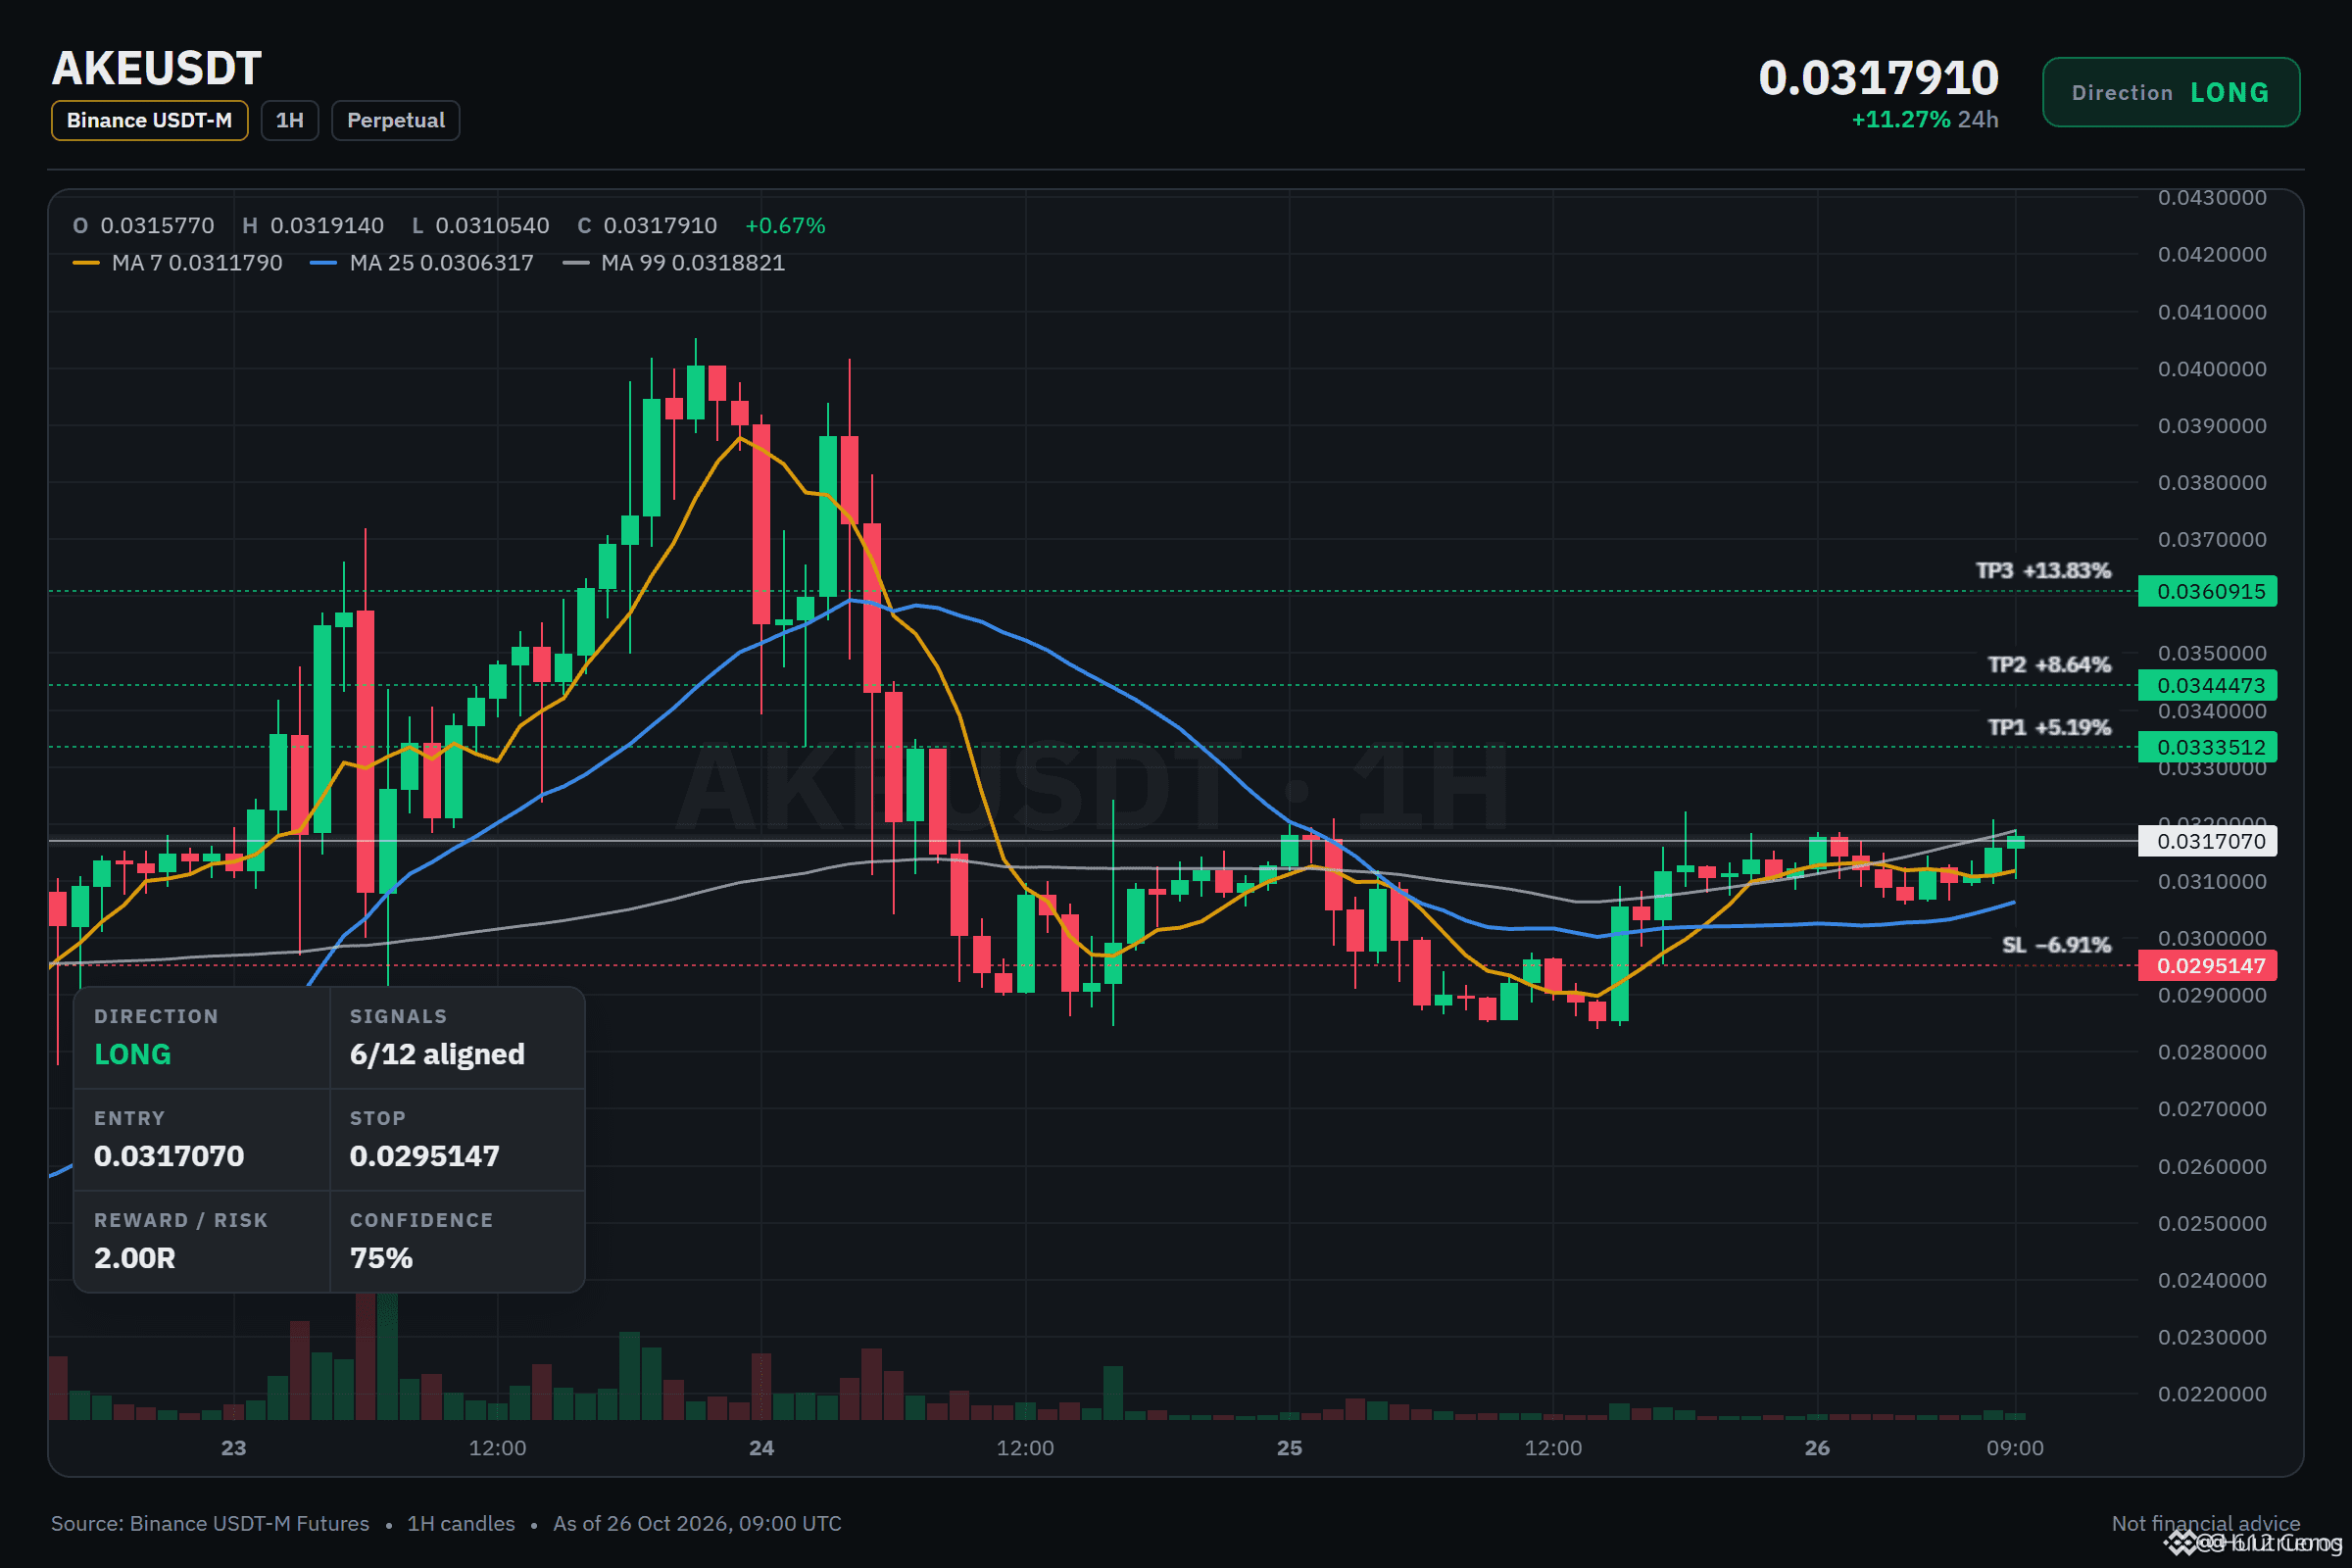
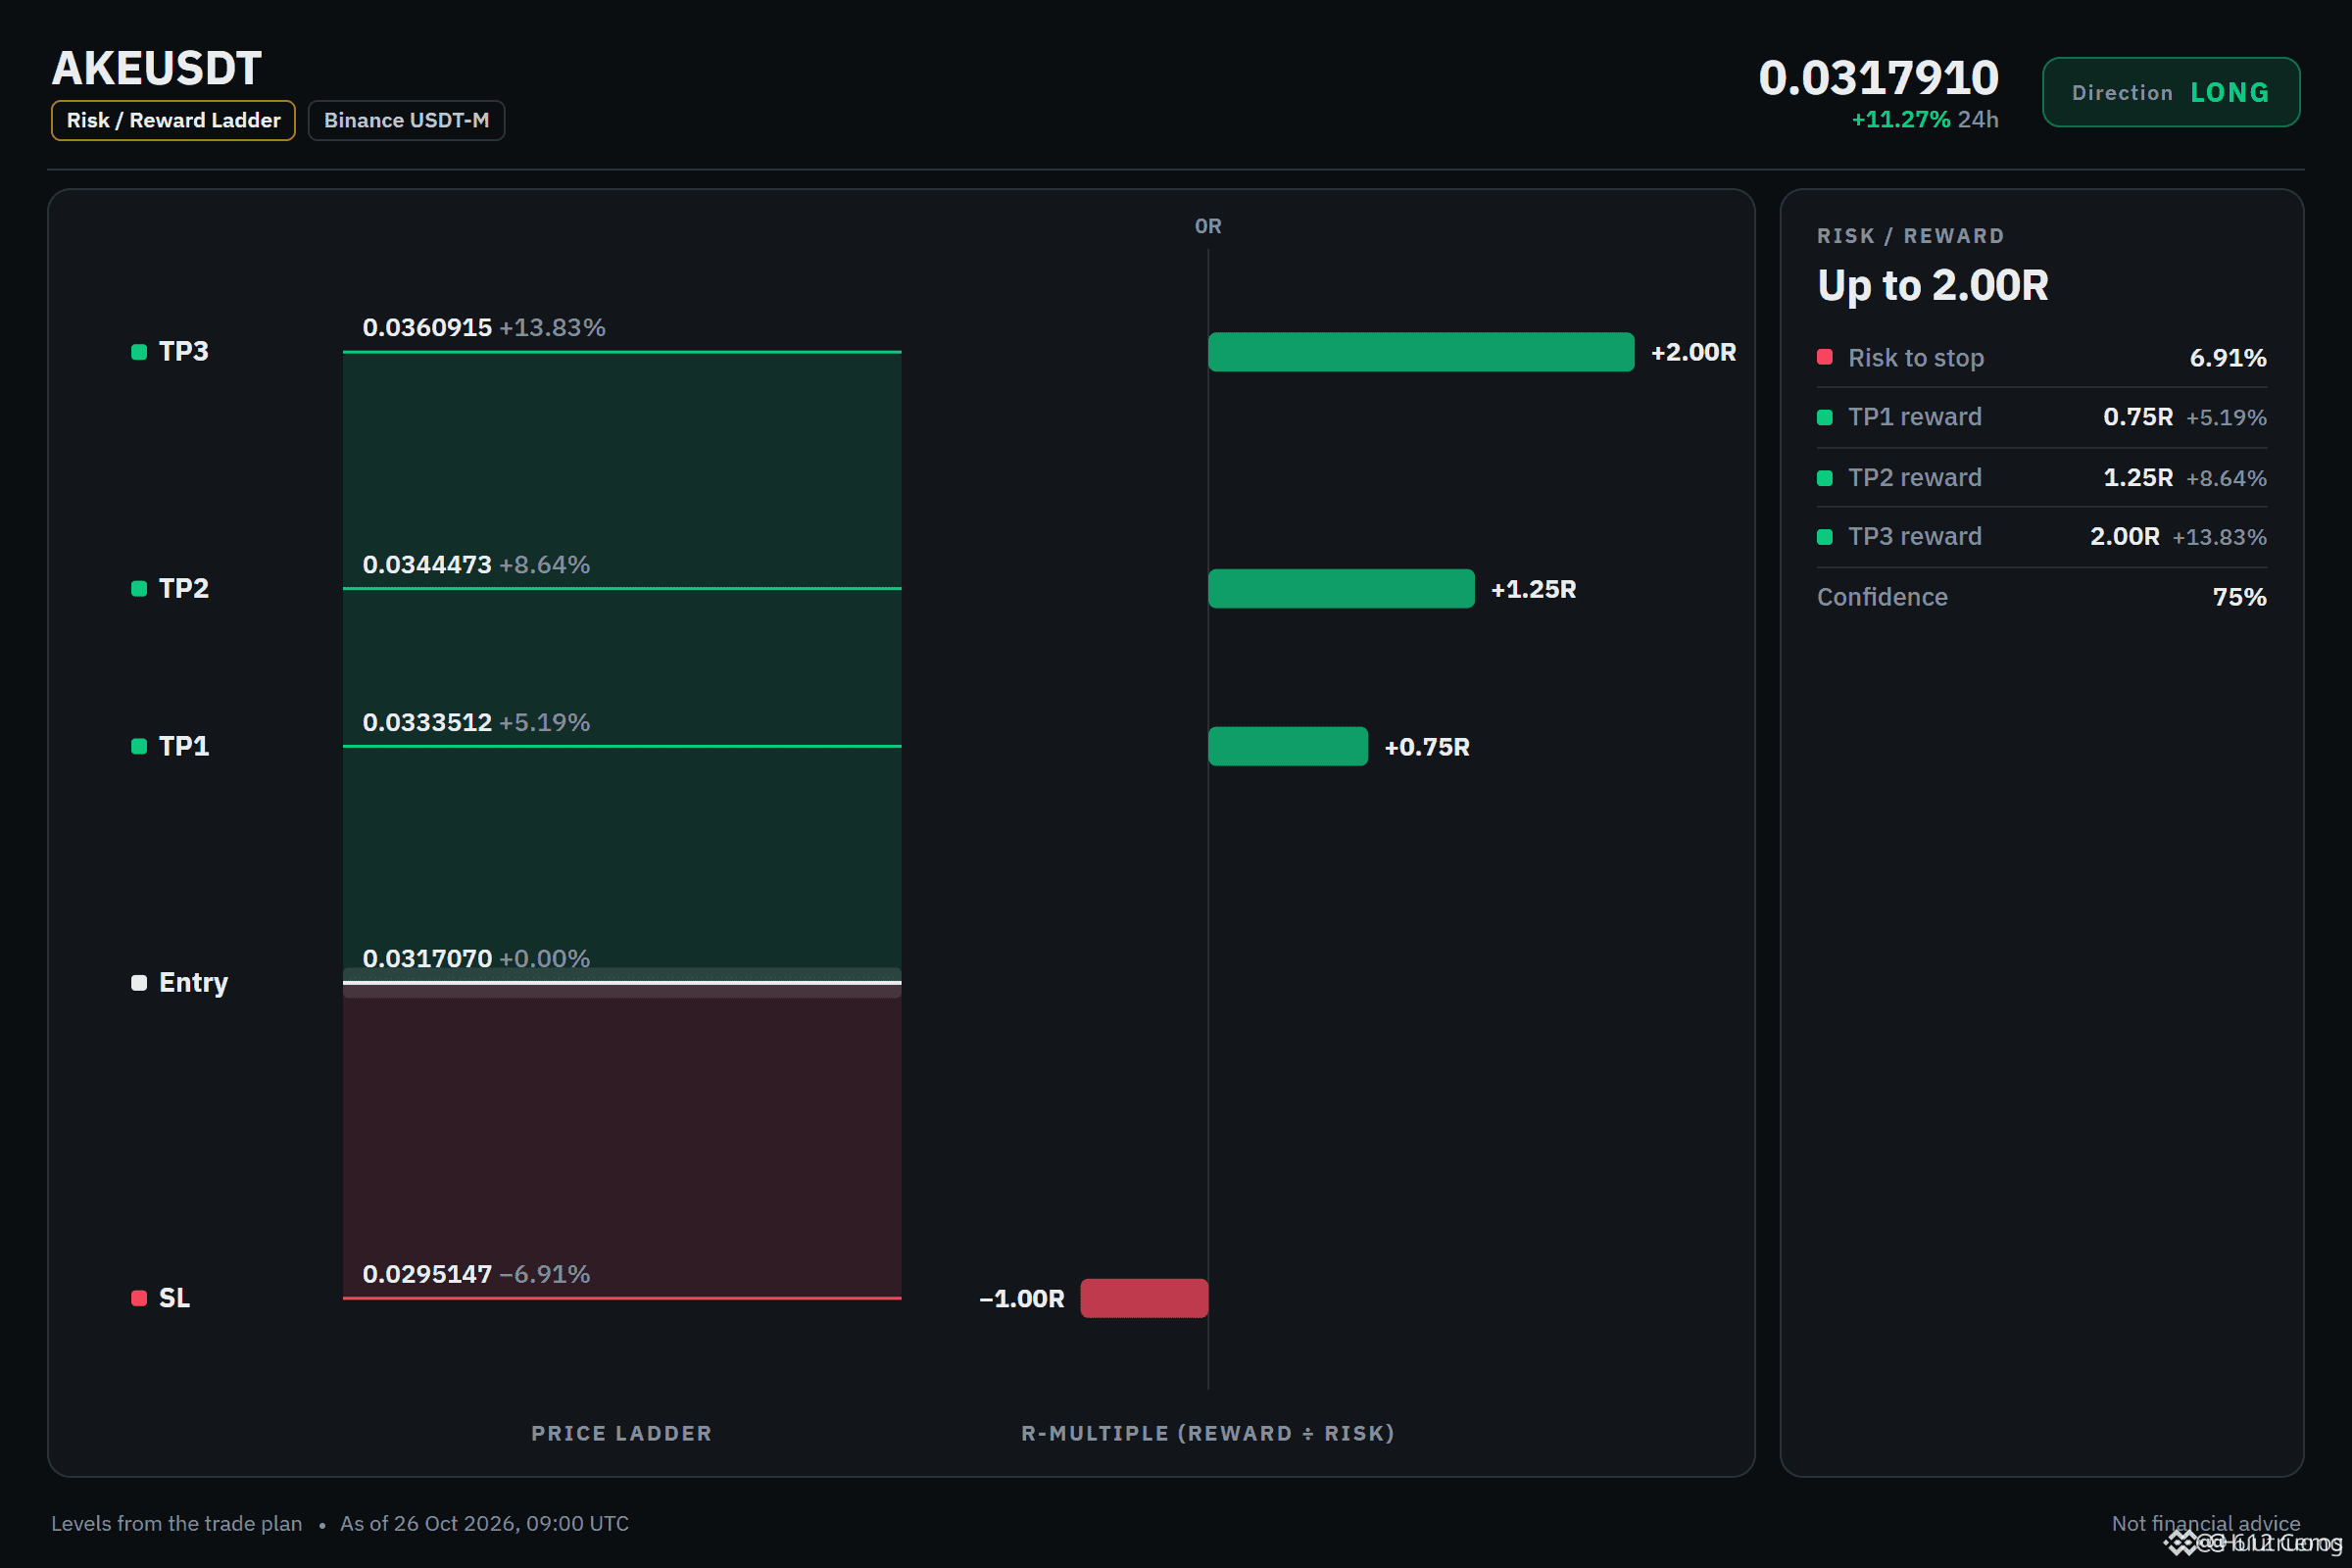
AKE 在各個趨勢週期均突破 EMA 多頭排列
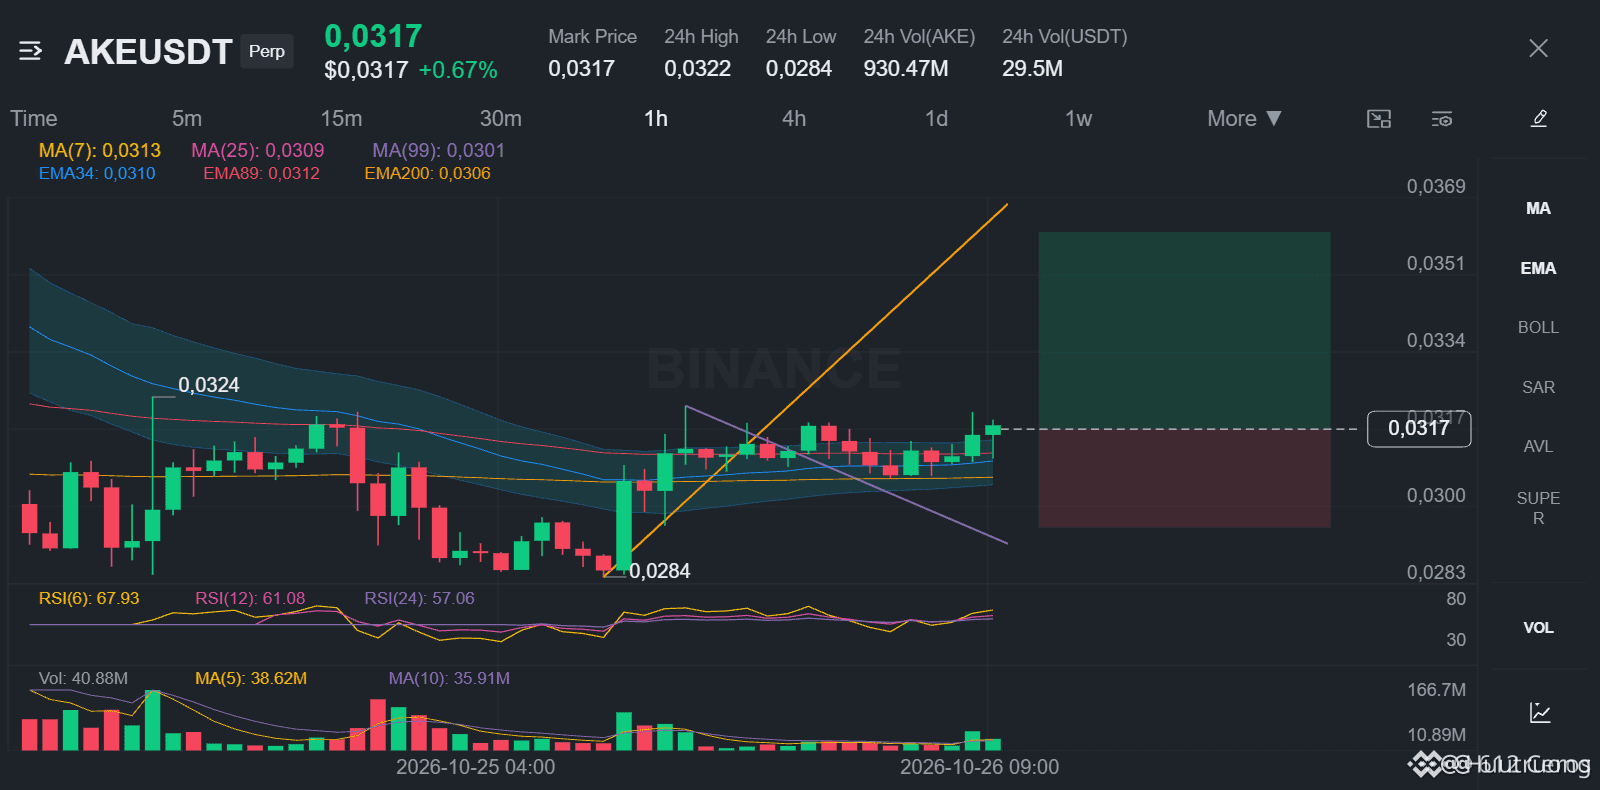
🟢 做多 $AKE /USDT:預期價格將上漲
方向:做多 · 強勢
進場:0.0316008 – 0.0318132
止盈1:0.0333512(+5.2%)
止盈2:0.0344473(+8.6%)
止盈3:0.0360915(+13.8%)
止損:0.0295147(-6.9%)
計畫:僅在此區間內進場,於止盈1平倉 50%、止盈2平倉 25%、止盈3平倉 25%,並在止盈1後將止損移至進場價。
為什麼做多?檢查結果:6/12 項支持,0 項反對。
• 日線趨勢向上(價格高於 EMA50 和 EMA200)
• 4 小時趨勢向上(價格高於 EMA50 和 EMA200)
• 1 小時趨勢向上(價格高於 EMA50 和 EMA200)
注意:若價格觸及 0.0295147 的止損位,則此判斷失效。
綜合判斷:日線的多頭排列(價格高於 EMA50 和 EMA200)是最強的助力;另一方面,4 小時 RSI 為 49.8,代表動能尚未明朗,無法提供助力。
如果 AKE 繼續上漲,你想在哪裡獲利了結?
·
--
看跌
查看翻譯
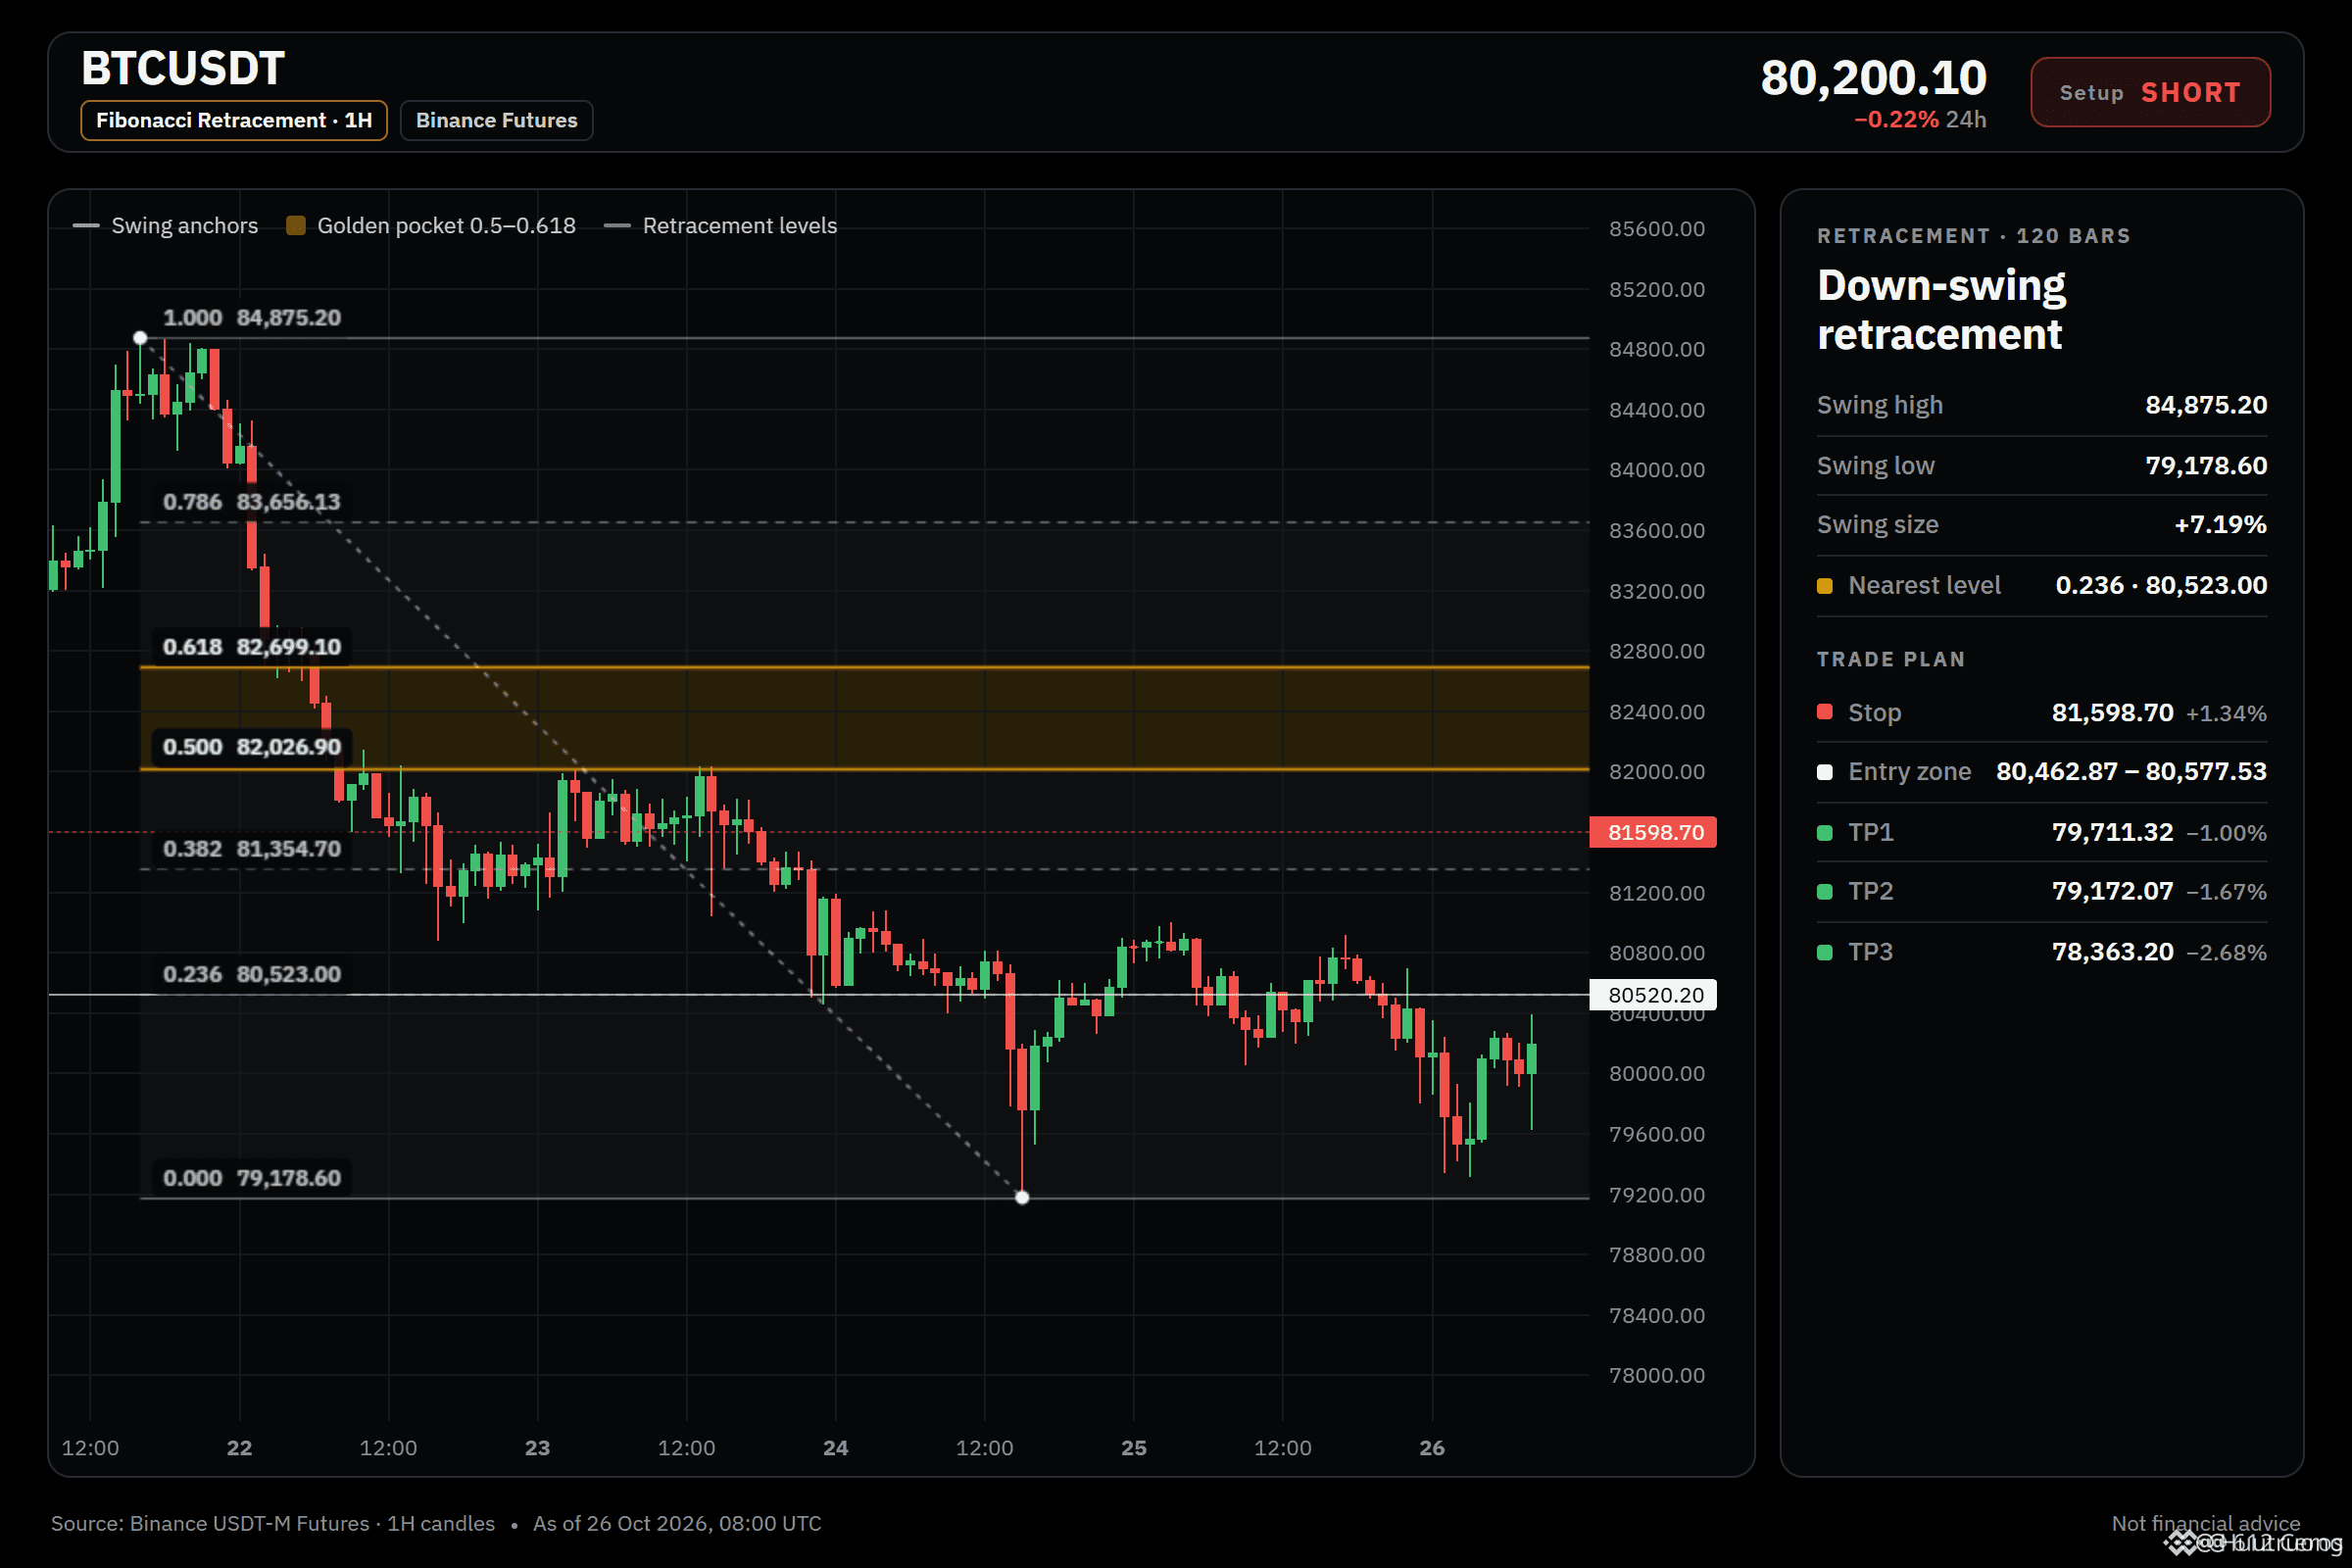
price below EMA50 and EMA200 on the 4h
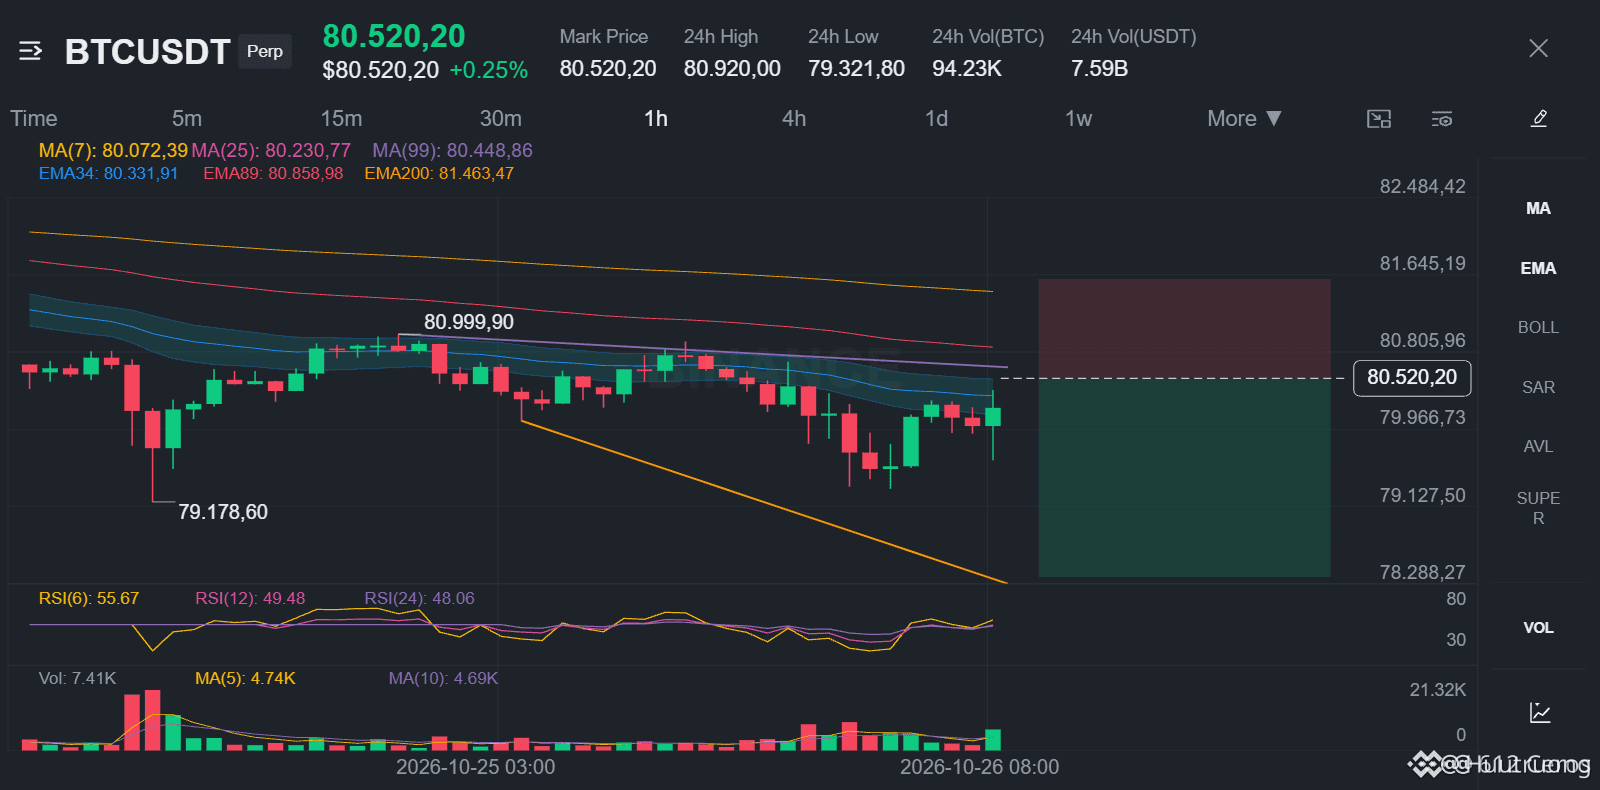
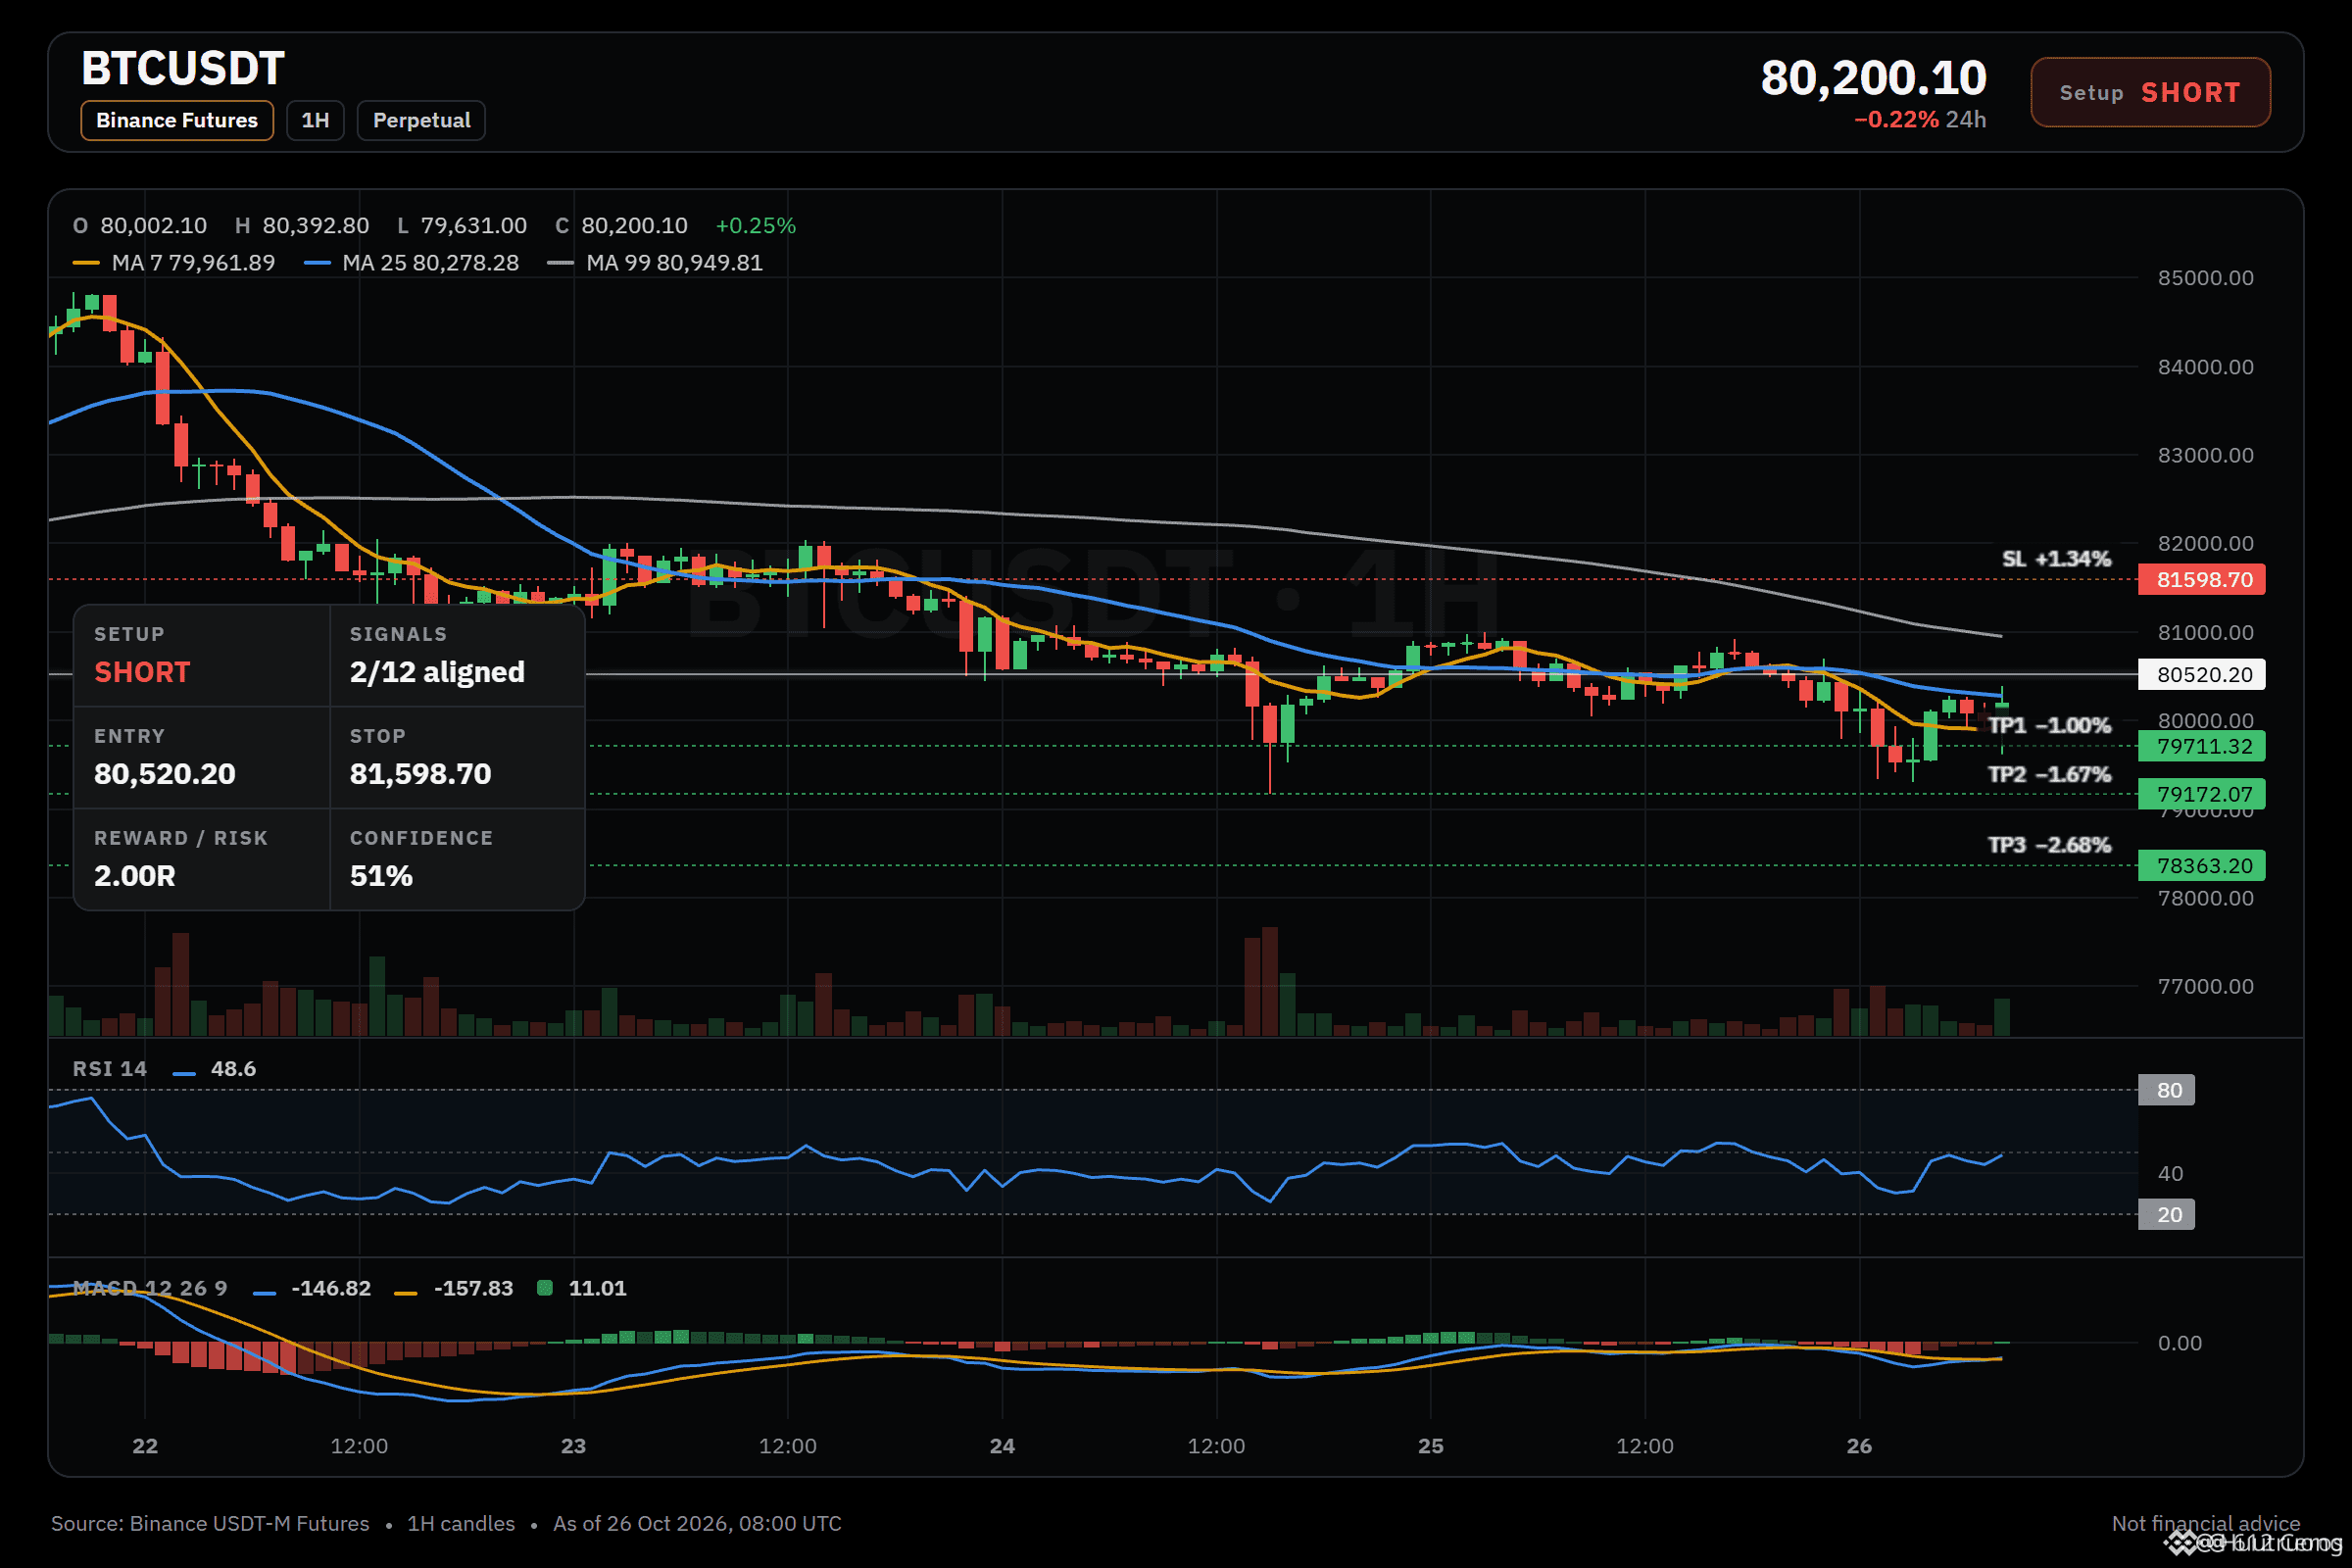
🔴 SHORT $BTC /USDT: expecting price to go DOWN
Bias: SHORT · Leaning
Entry: 80462.87 – 80577.53
TP1: 79711.32 (-1.0%)
TP2: 79172.07 (-1.7%)
TP3: 78363.20 (-2.7%)
SL: 81598.70 (+1.3%)
Plan: enter only inside the zone, close 50% at TP1, 25% at TP2, 25% at TP3, and move the stop to entry after TP1.
Note: moderate conviction only, keep size light.
Why SHORT? 2/12 signals agree, 2 against.
• 4h trend down (below EMA50 & EMA200)
• Sellers have the momentum (4h RSI 38.4)
Risk: BTC is rising, this coin follows (corr 1.00)
Q: Why short when the daily trend is range?
A: The 4h bearish stack keeps the swing trend down.
Q: What if buyers are pressing right now?
A: The 15m RSI z-score of +1.36 shows buyers pushing.
What level would make you take the other side?
·
--
📊 $AMZN 盈利預測 | 看漲還是看跌?🚀
我看好亞馬遜!AWS 強勁增長、AI 創新以及不斷擴大的電商業務,都有望提振其盈利。$AMZN 能否超出市場預期?讓我們拭目以待!📈🔥
你怎麼看?
#EarningsSeasonOnSquare #BinancePick $AMZN
{future}(AMZNUSDT)
📊 $AMZN 盈利預測 | 看漲還是看跌?🚀
我看好亞馬遜!AWS 強勁增長、AI 創新以及不斷擴大的電商業務,都有望提振其盈利。$AMZN 能否超出市場預期?讓我們拭目以待!📈🔥
你怎麼看?
#EarningsSeasonOnSquare #BinancePick $AMZN
我看好亞馬遜!AWS 強勁增長、AI 創新以及不斷擴大的電商業務,都有望提振其盈利。$AMZN 能否超出市場預期?讓我們拭目以待!📈🔥
你怎麼看?
#EarningsSeasonOnSquare #BinancePick $AMZN
1
·
--
看跌
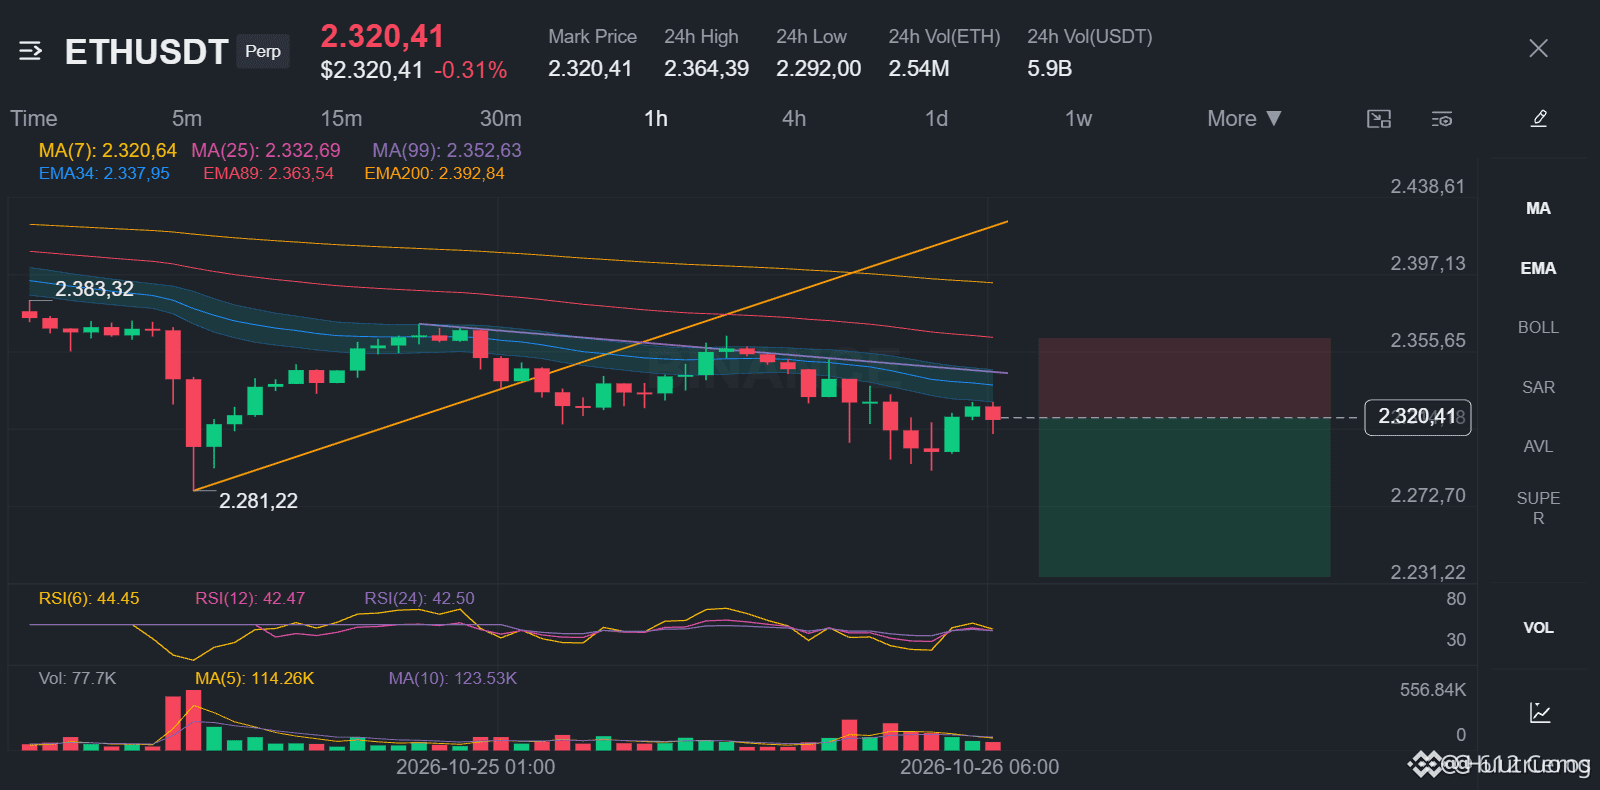
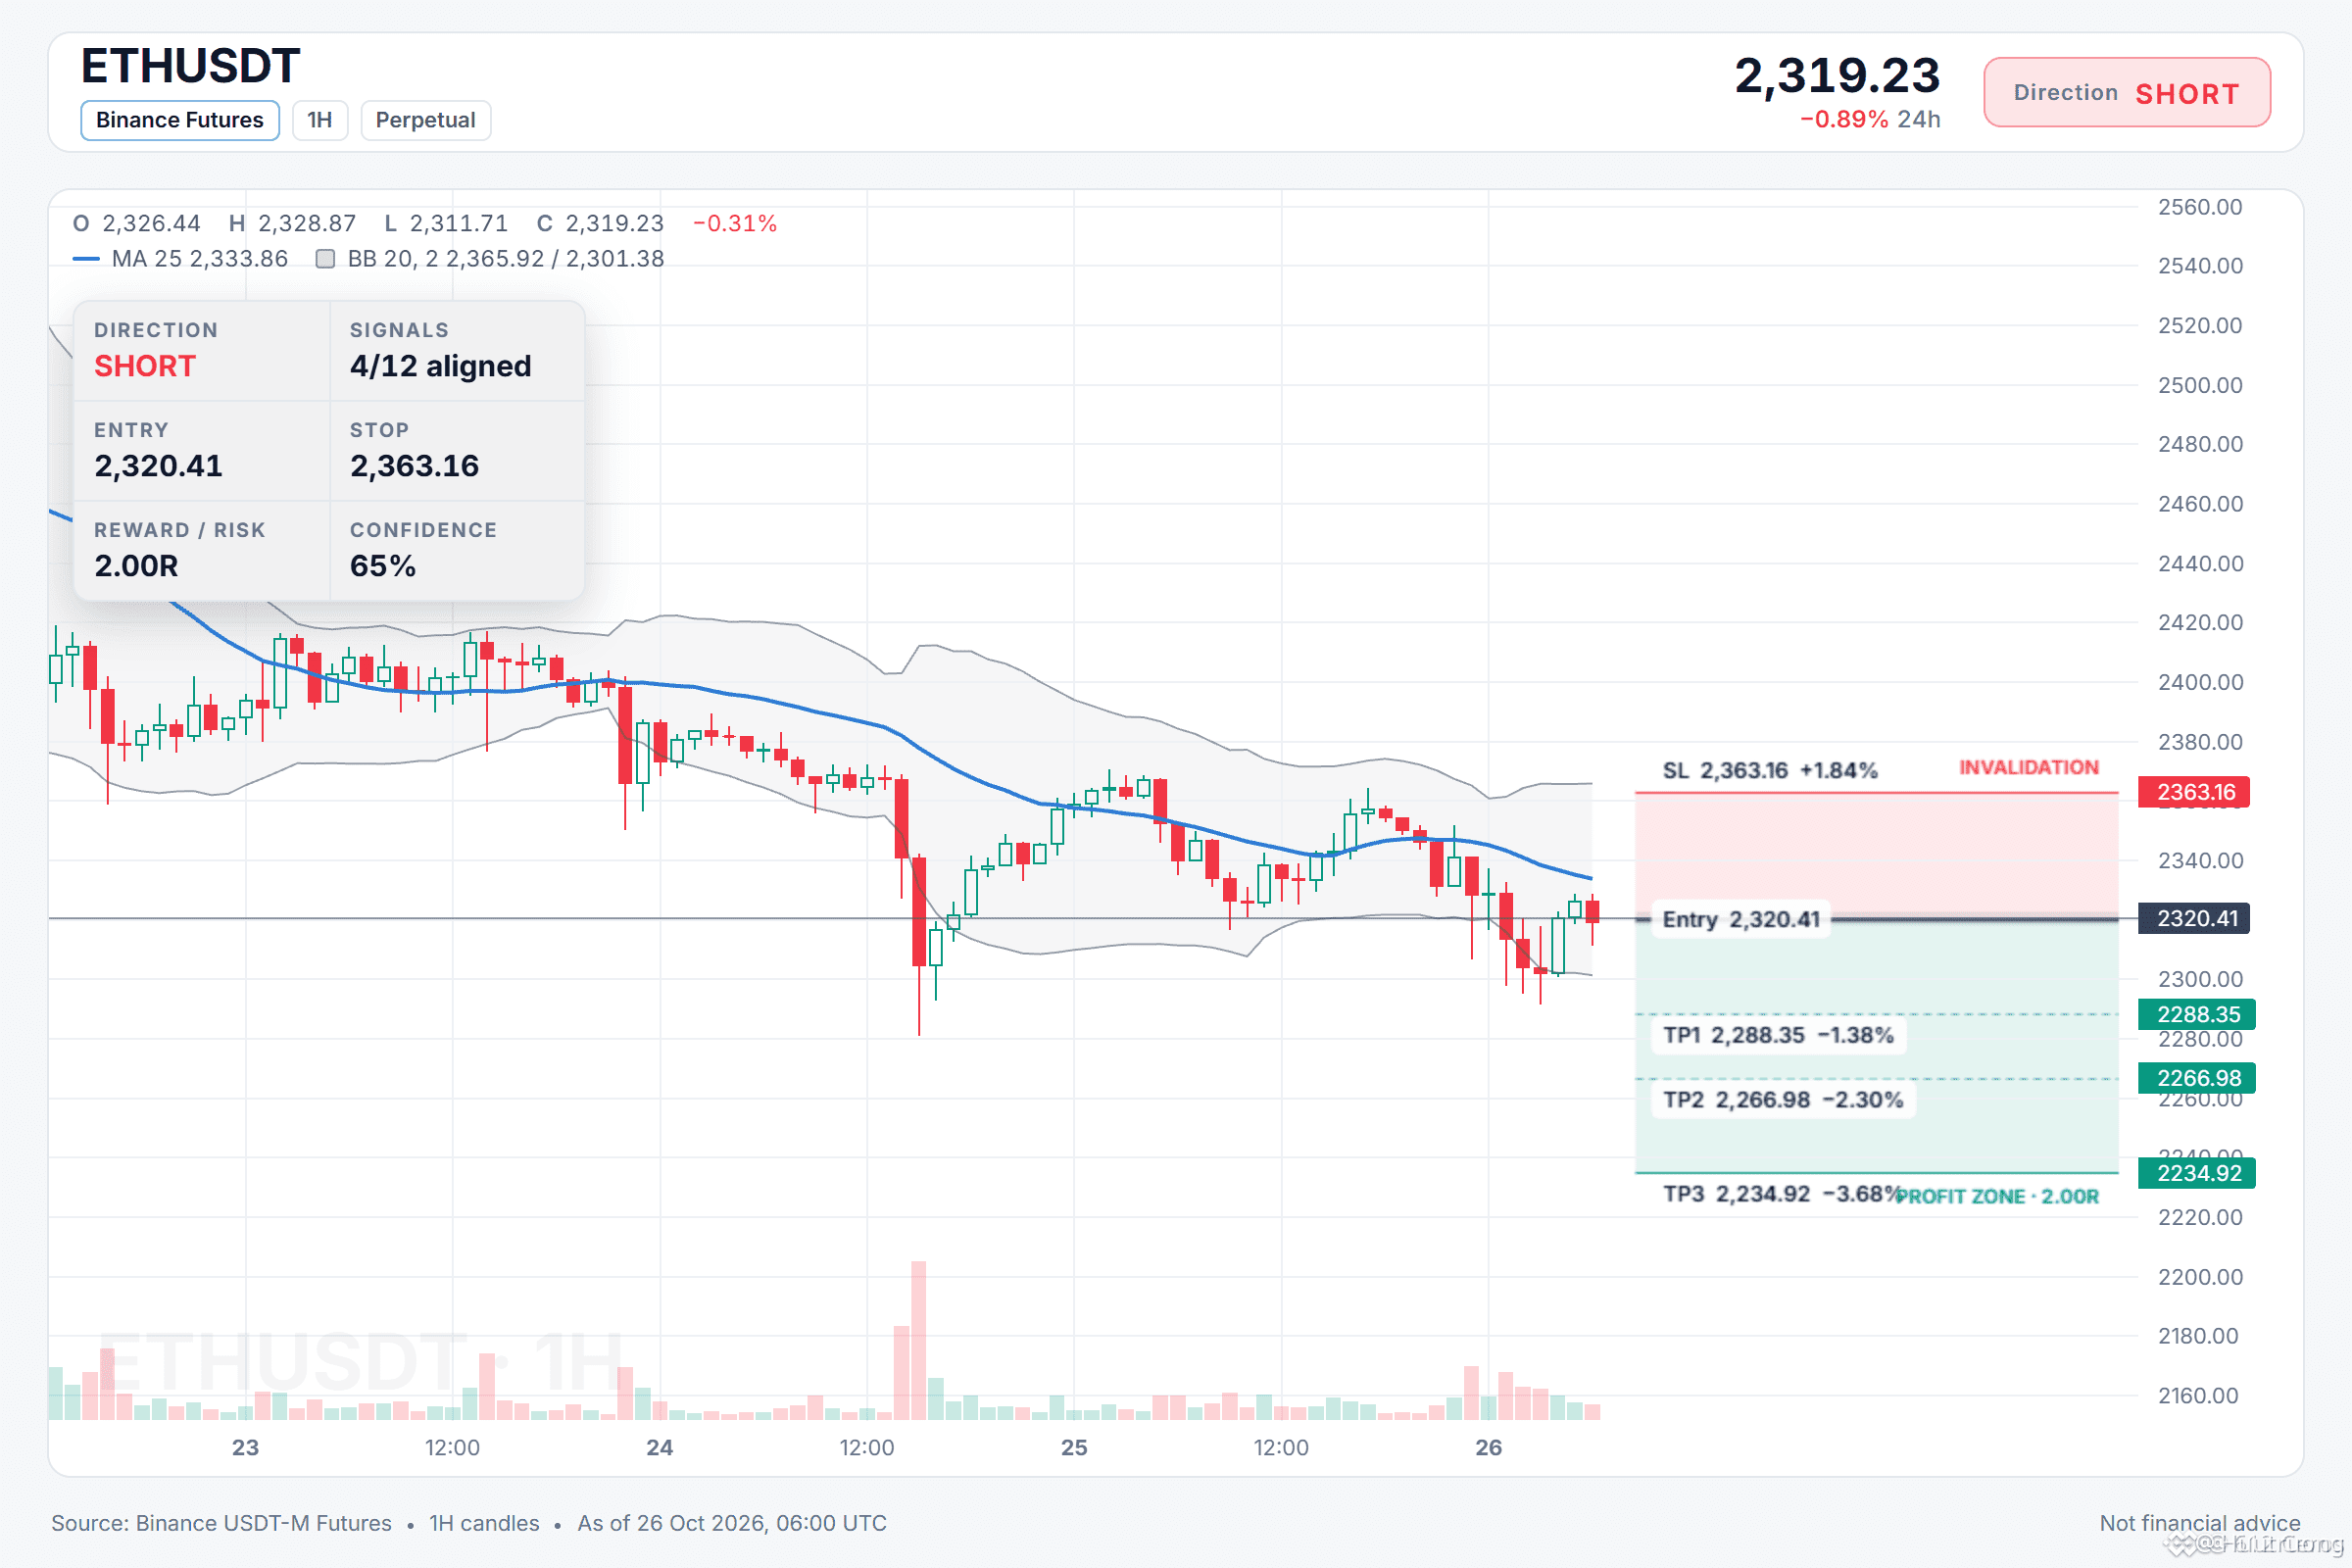
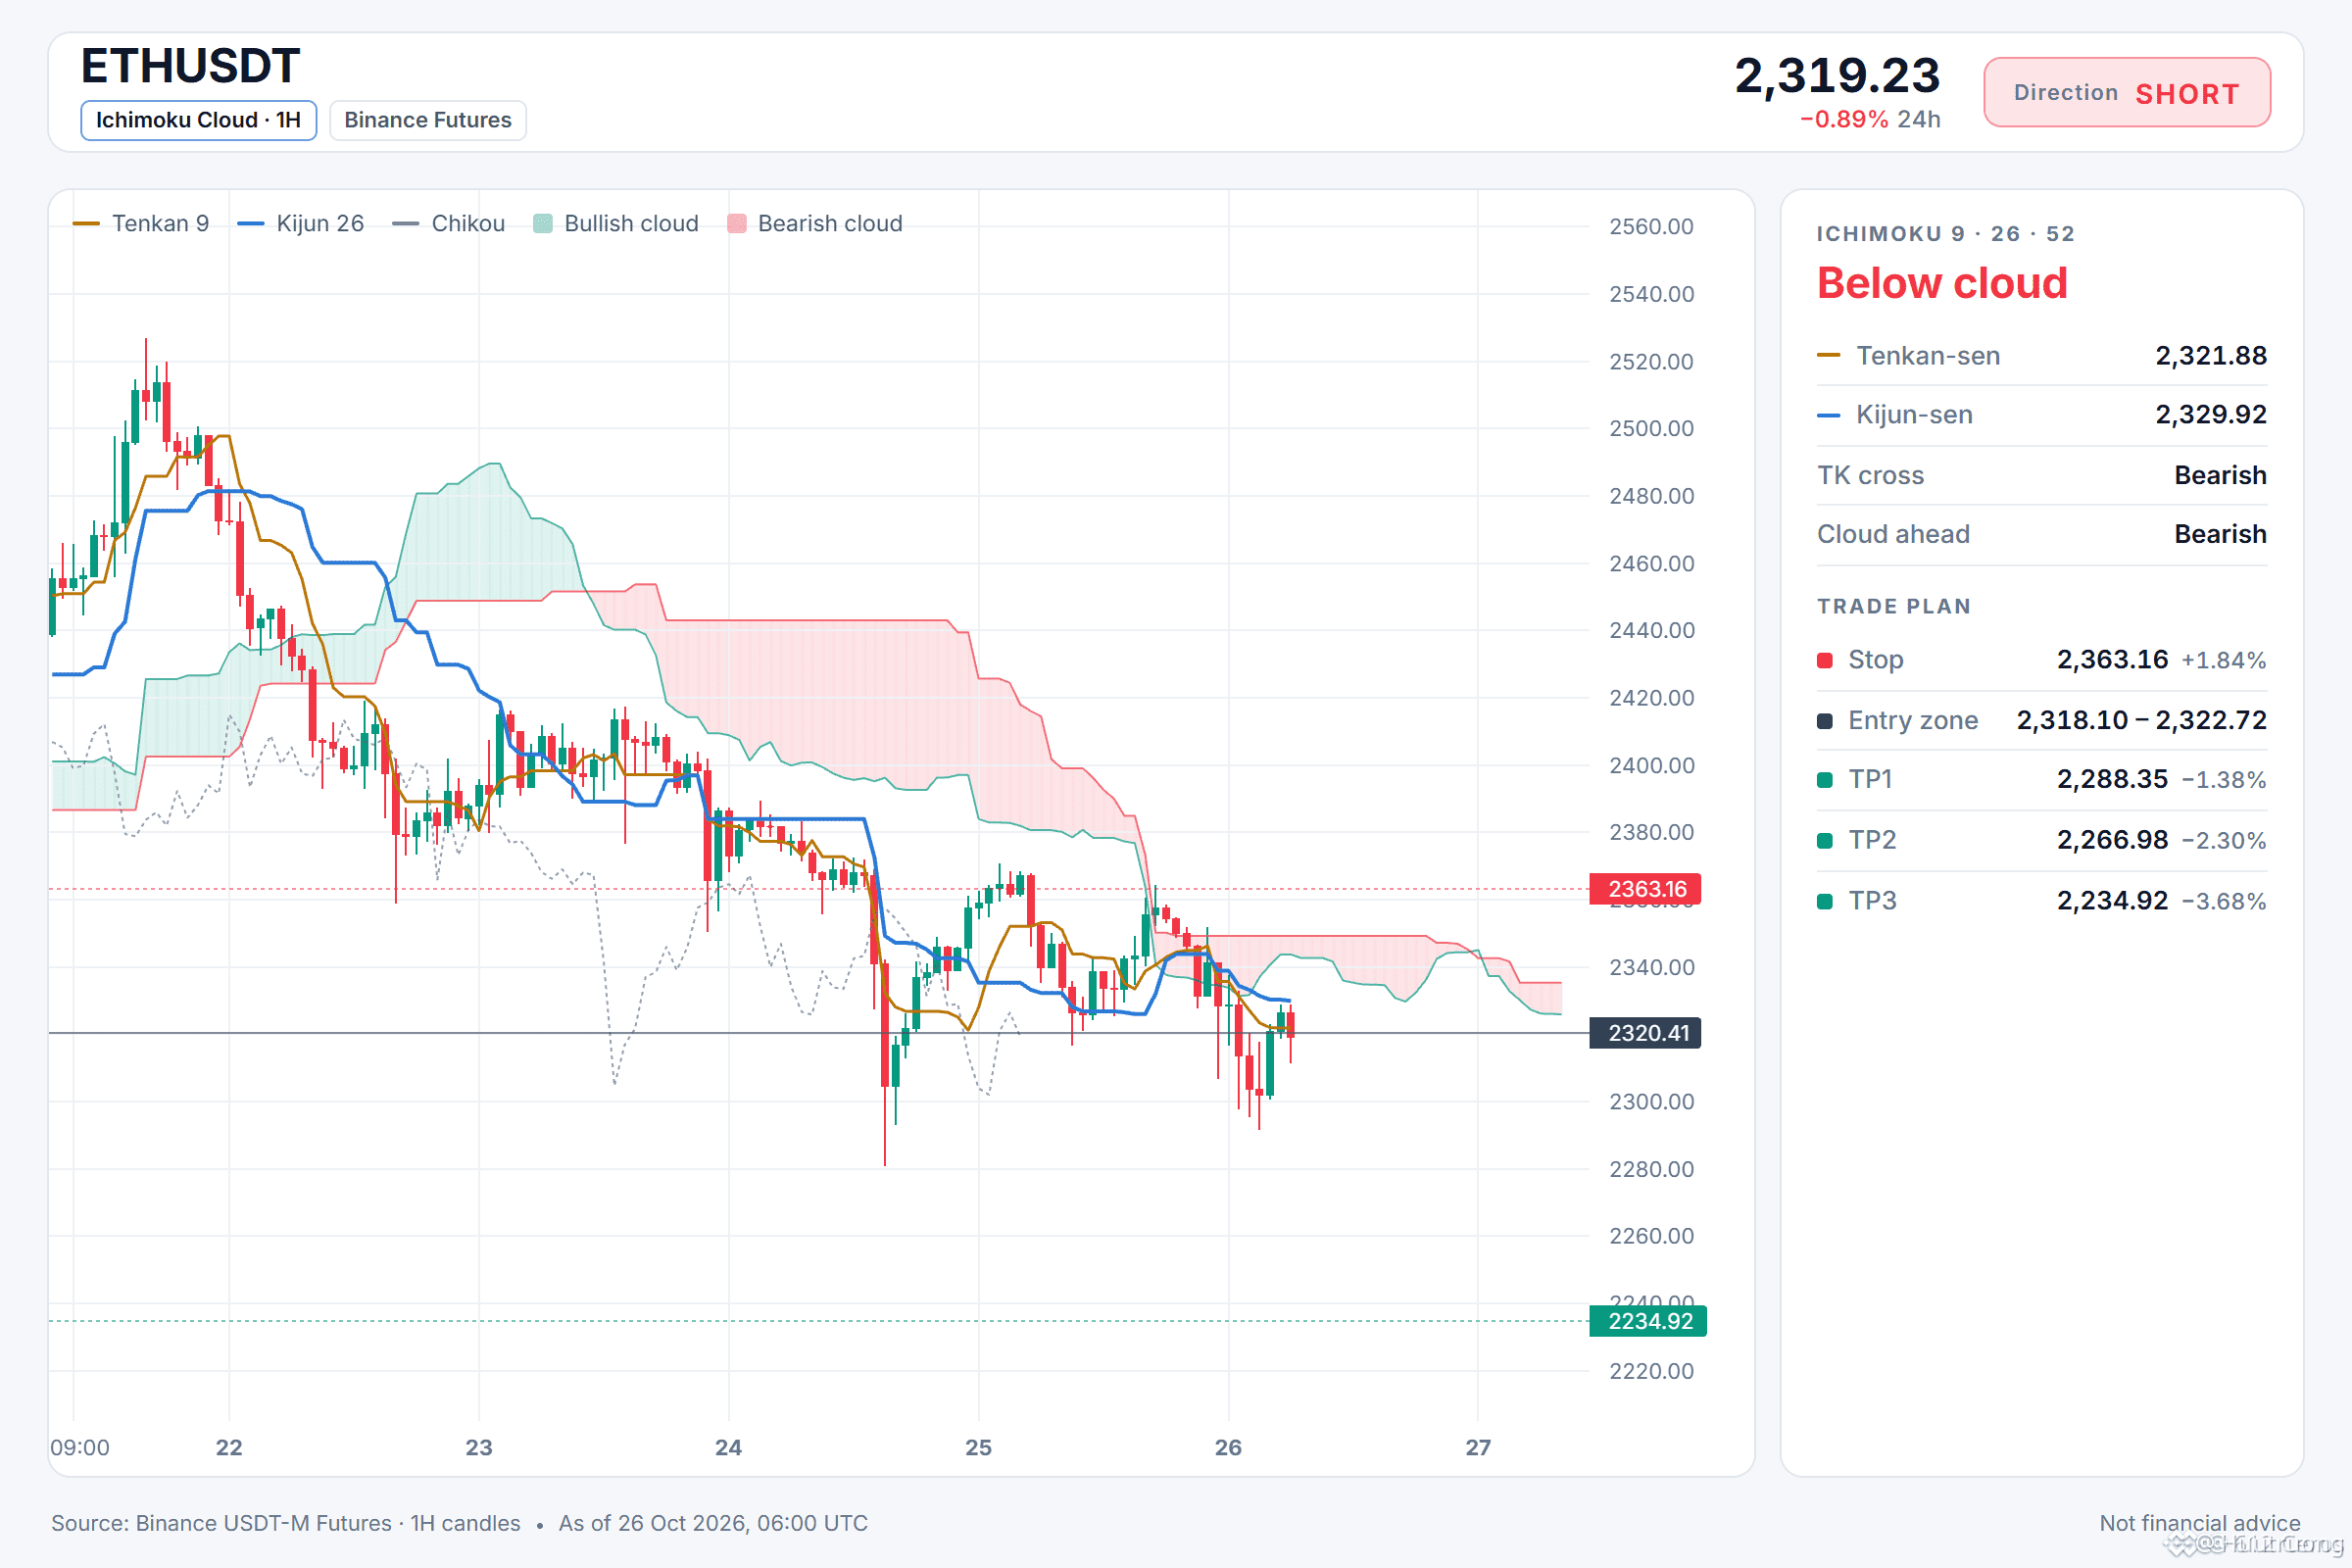
ETH 正處於明顯的空頭排列,走勢持續下滑。
🔴 做空 $ETH /USDT:預計價格將下跌
傾向:做空 · 偏向做空
入場:2318.10 – 2322.72
止盈1:2288.35(-1.4%)
止盈2:2266.98(-2.3%)
止盈3:2234.92(-3.7%)
止損:2363.16(+1.8%)
計劃:僅在區間內入場;止盈1時平倉50%,止盈2時平倉25%,止盈3時平倉25%;達到止盈1後,將止損位移至入場價。
備註:信心一般,倉位宜輕。
爲什麼做空?12個信號中有4個一致看空,0個反對。
• 4小時趨勢向下(價格低於EMA50和EMA200)
• 1小時趨勢向下(價格低於EMA50和EMA200)
• 賣方佔據動能優勢(4小時RSI爲33.4)
計劃A:
如果4小時趨勢使價格繼續低於兩條均線,1小時的空頭排列可能推動價格靠近止盈1區域。
計劃B(失效條件):
如果價格重新站上入場價並穩住,我會平掉空單並等待。
你會把ETH的價位設在哪裏?
·
--
看跌
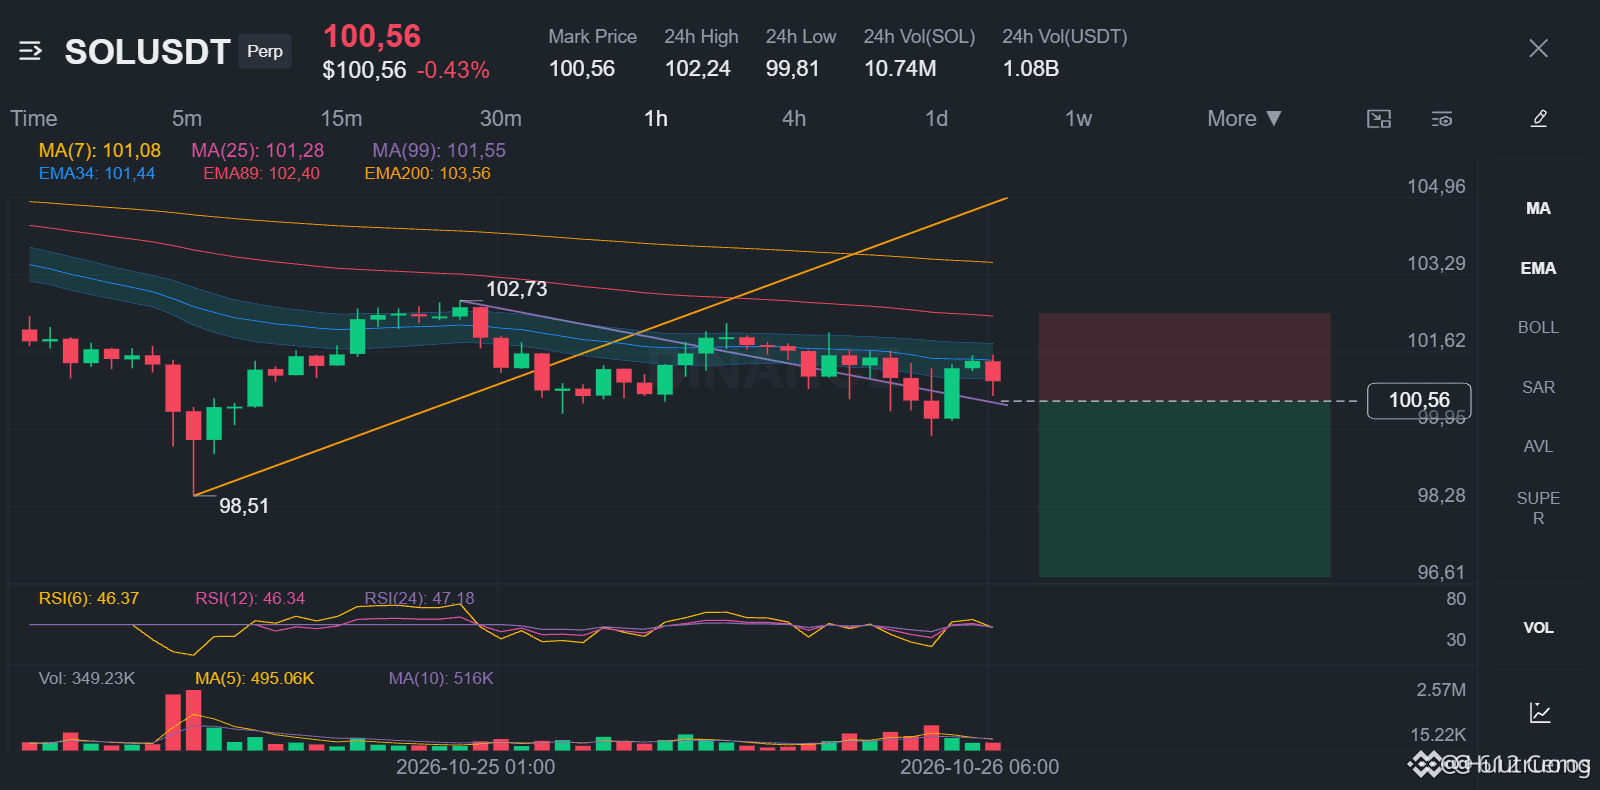
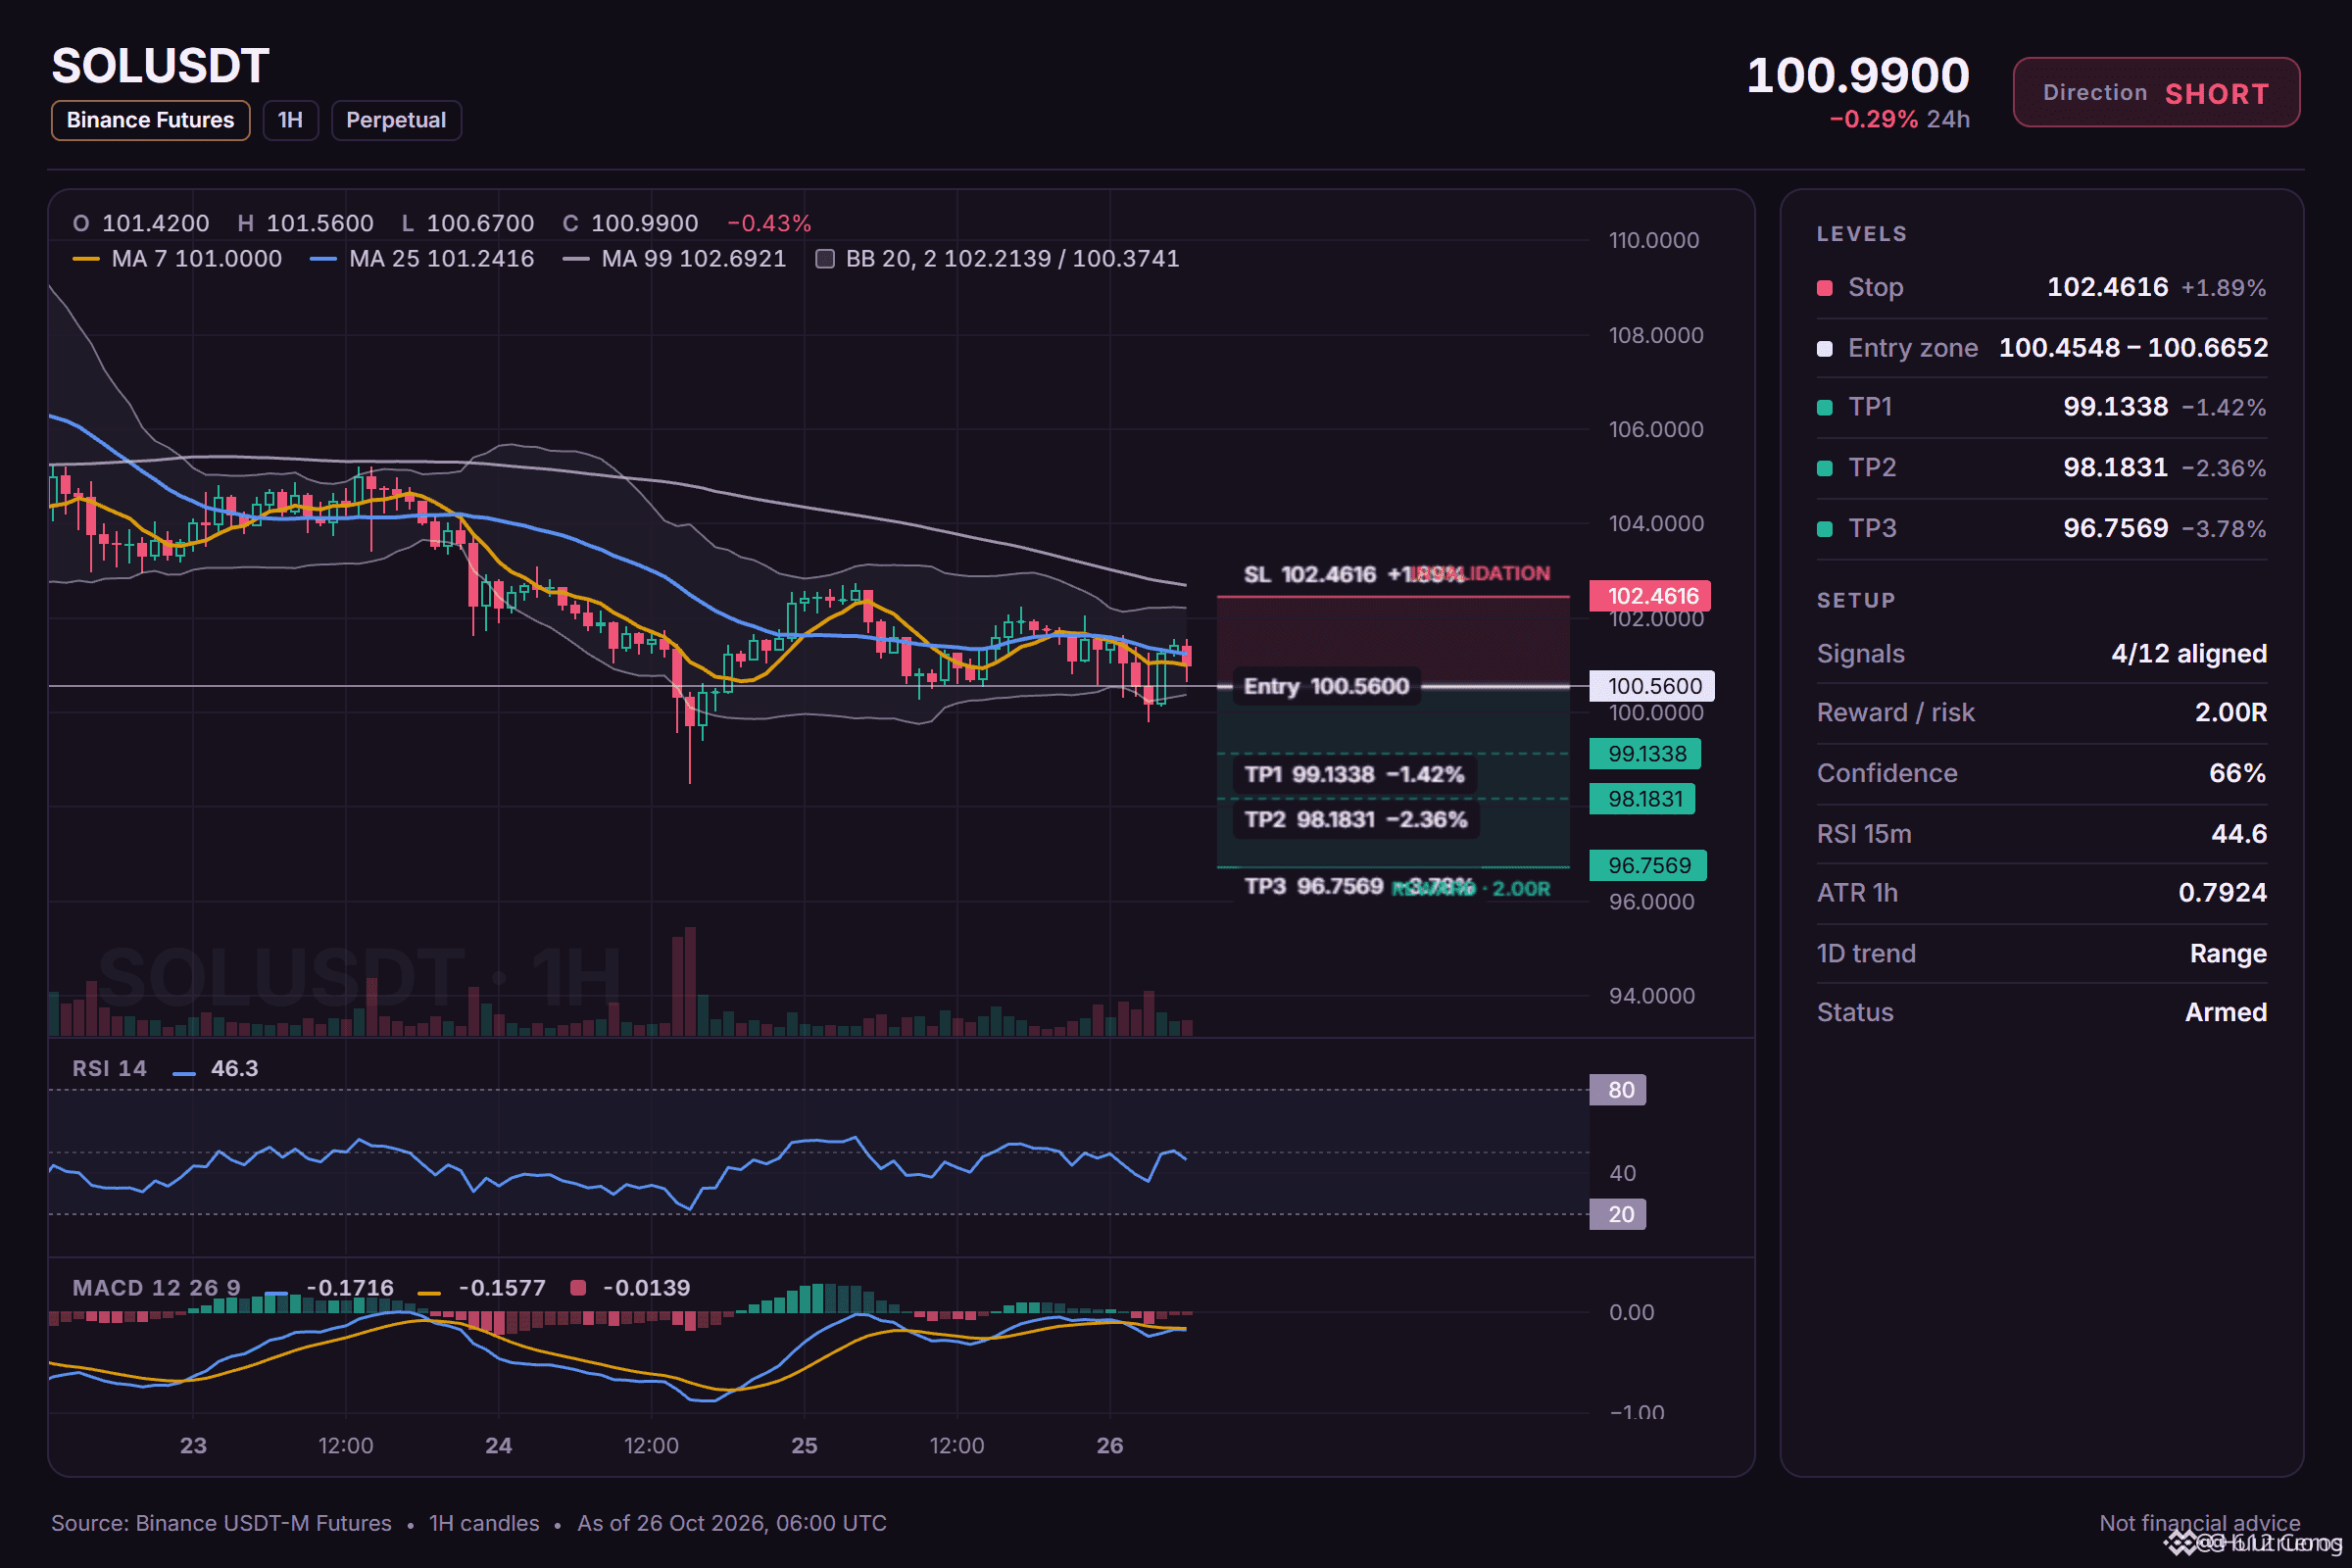
SOL 處於明顯的 4 小時下跌趨勢
🔴 做空 $SOL /USDT:預計價格將下跌
傾向:做空 · 偏向做空
入場:100.4548 – 100.6652
止盈1:99.1338 (-1.4%)
止盈2:98.1831 (-2.4%)
止盈3:96.7569 (-3.8%)
止損:102.4616 (+1.9%)
計劃:僅在區間內入場,在止盈1平倉 50%,止盈2平倉 25%,止盈3平倉 25%,並在止盈1觸發後將止損移至入場價。
注意:信號強度僅屬中等,倉位保持輕量。
爲何做空?12 個信號中有 4 個支持,0 個反對。
• 4 小時趨勢向下(價格低於 EMA50 和 EMA200)
• 1 小時趨勢向下(價格低於 EMA50 和 EMA200)
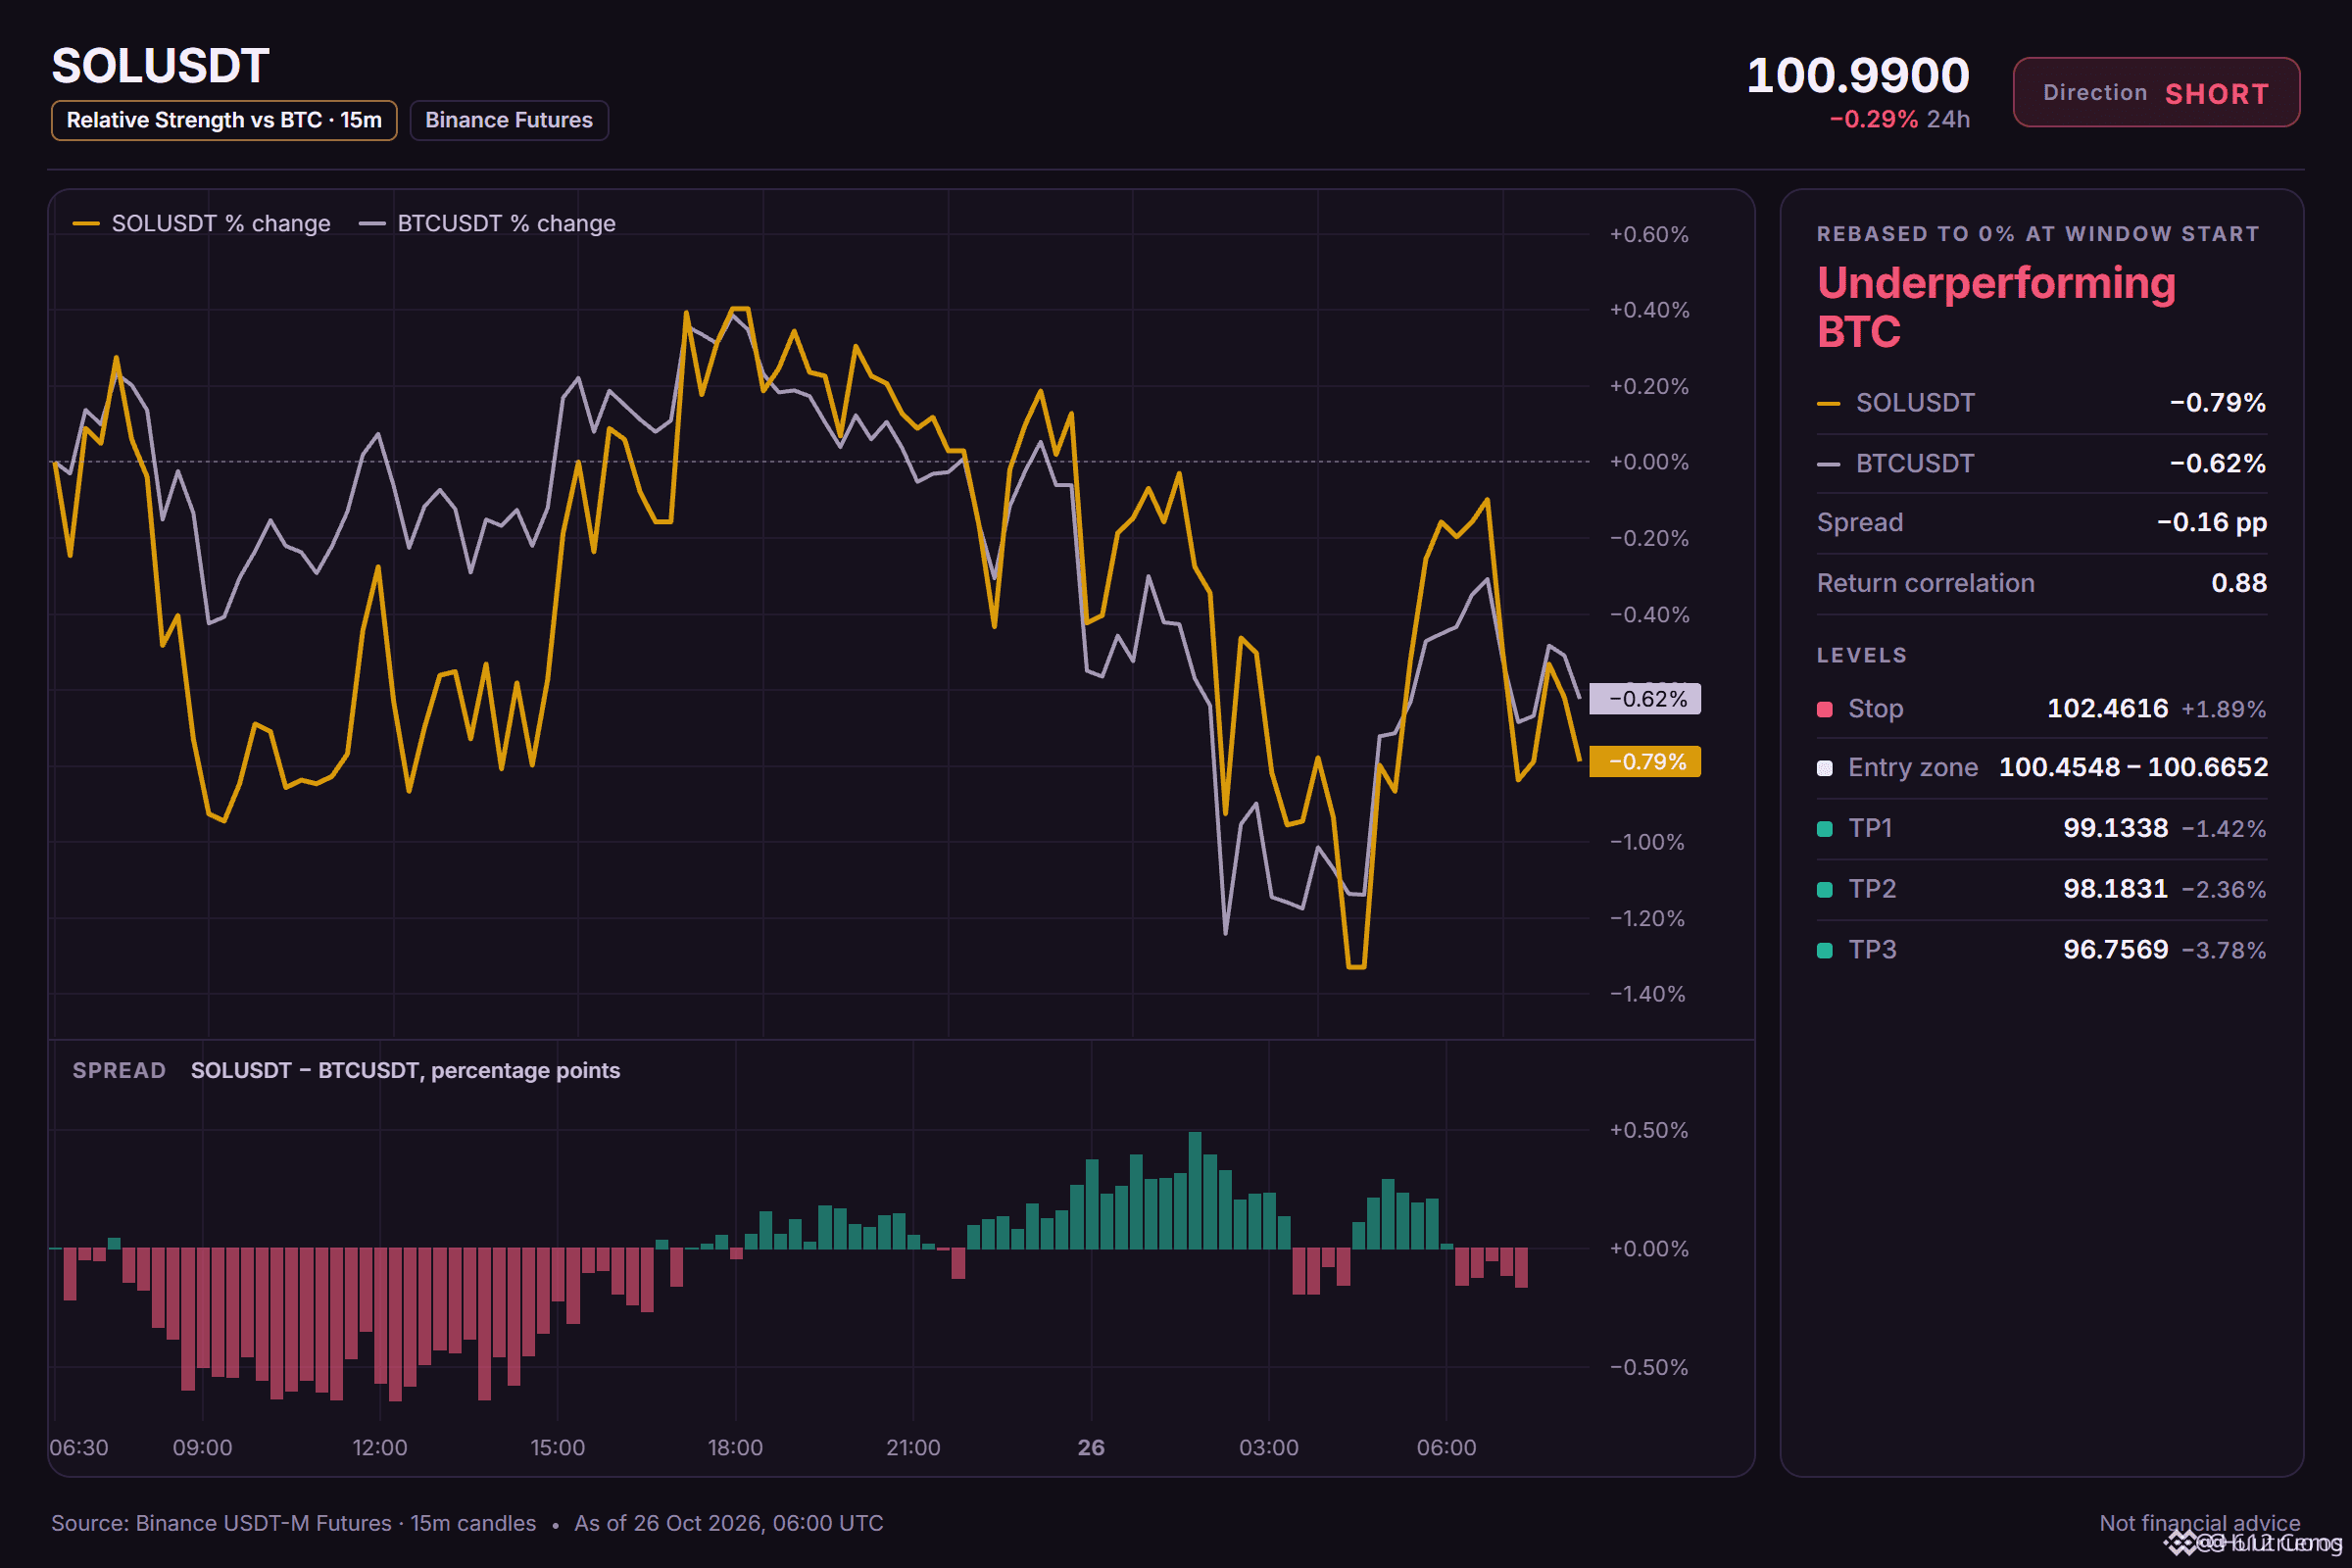
• 正在下跌,該幣種走勢跟隨(相關係數 0.89)
爲何是現在?
目前價格低於 1 小時和 4 小時的全部 EMA 均線組,確認短期趨勢向下。1 小時價格爲 100.5600,RSI 爲 44.62,顯示賣方動能佔優。這是一個有一定把握、但並非強烈信號的偏向做空機會。
你認爲這筆交易的失效位在哪裏?
·
--
看漲
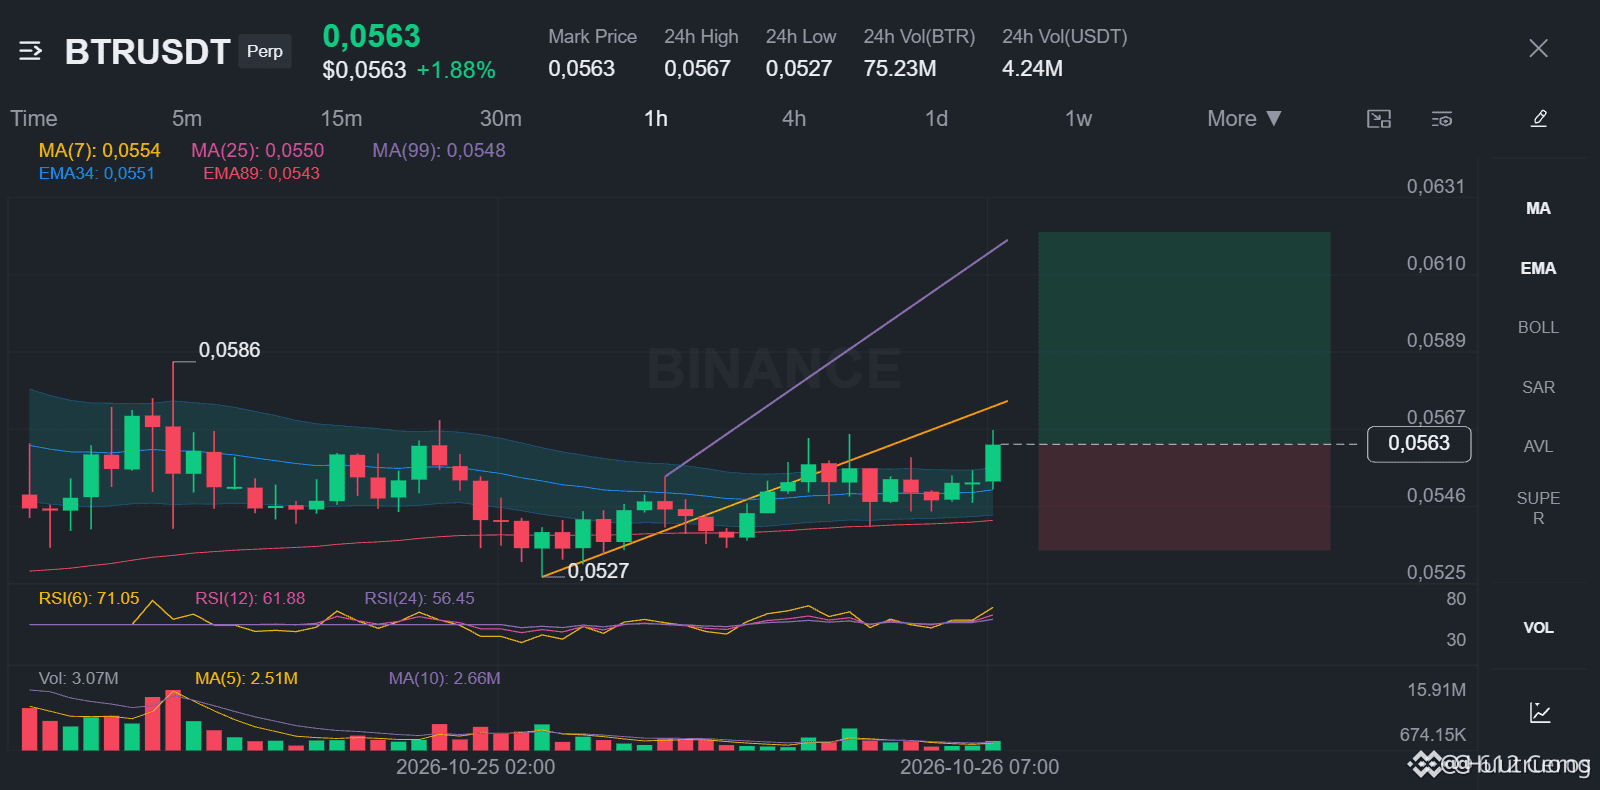
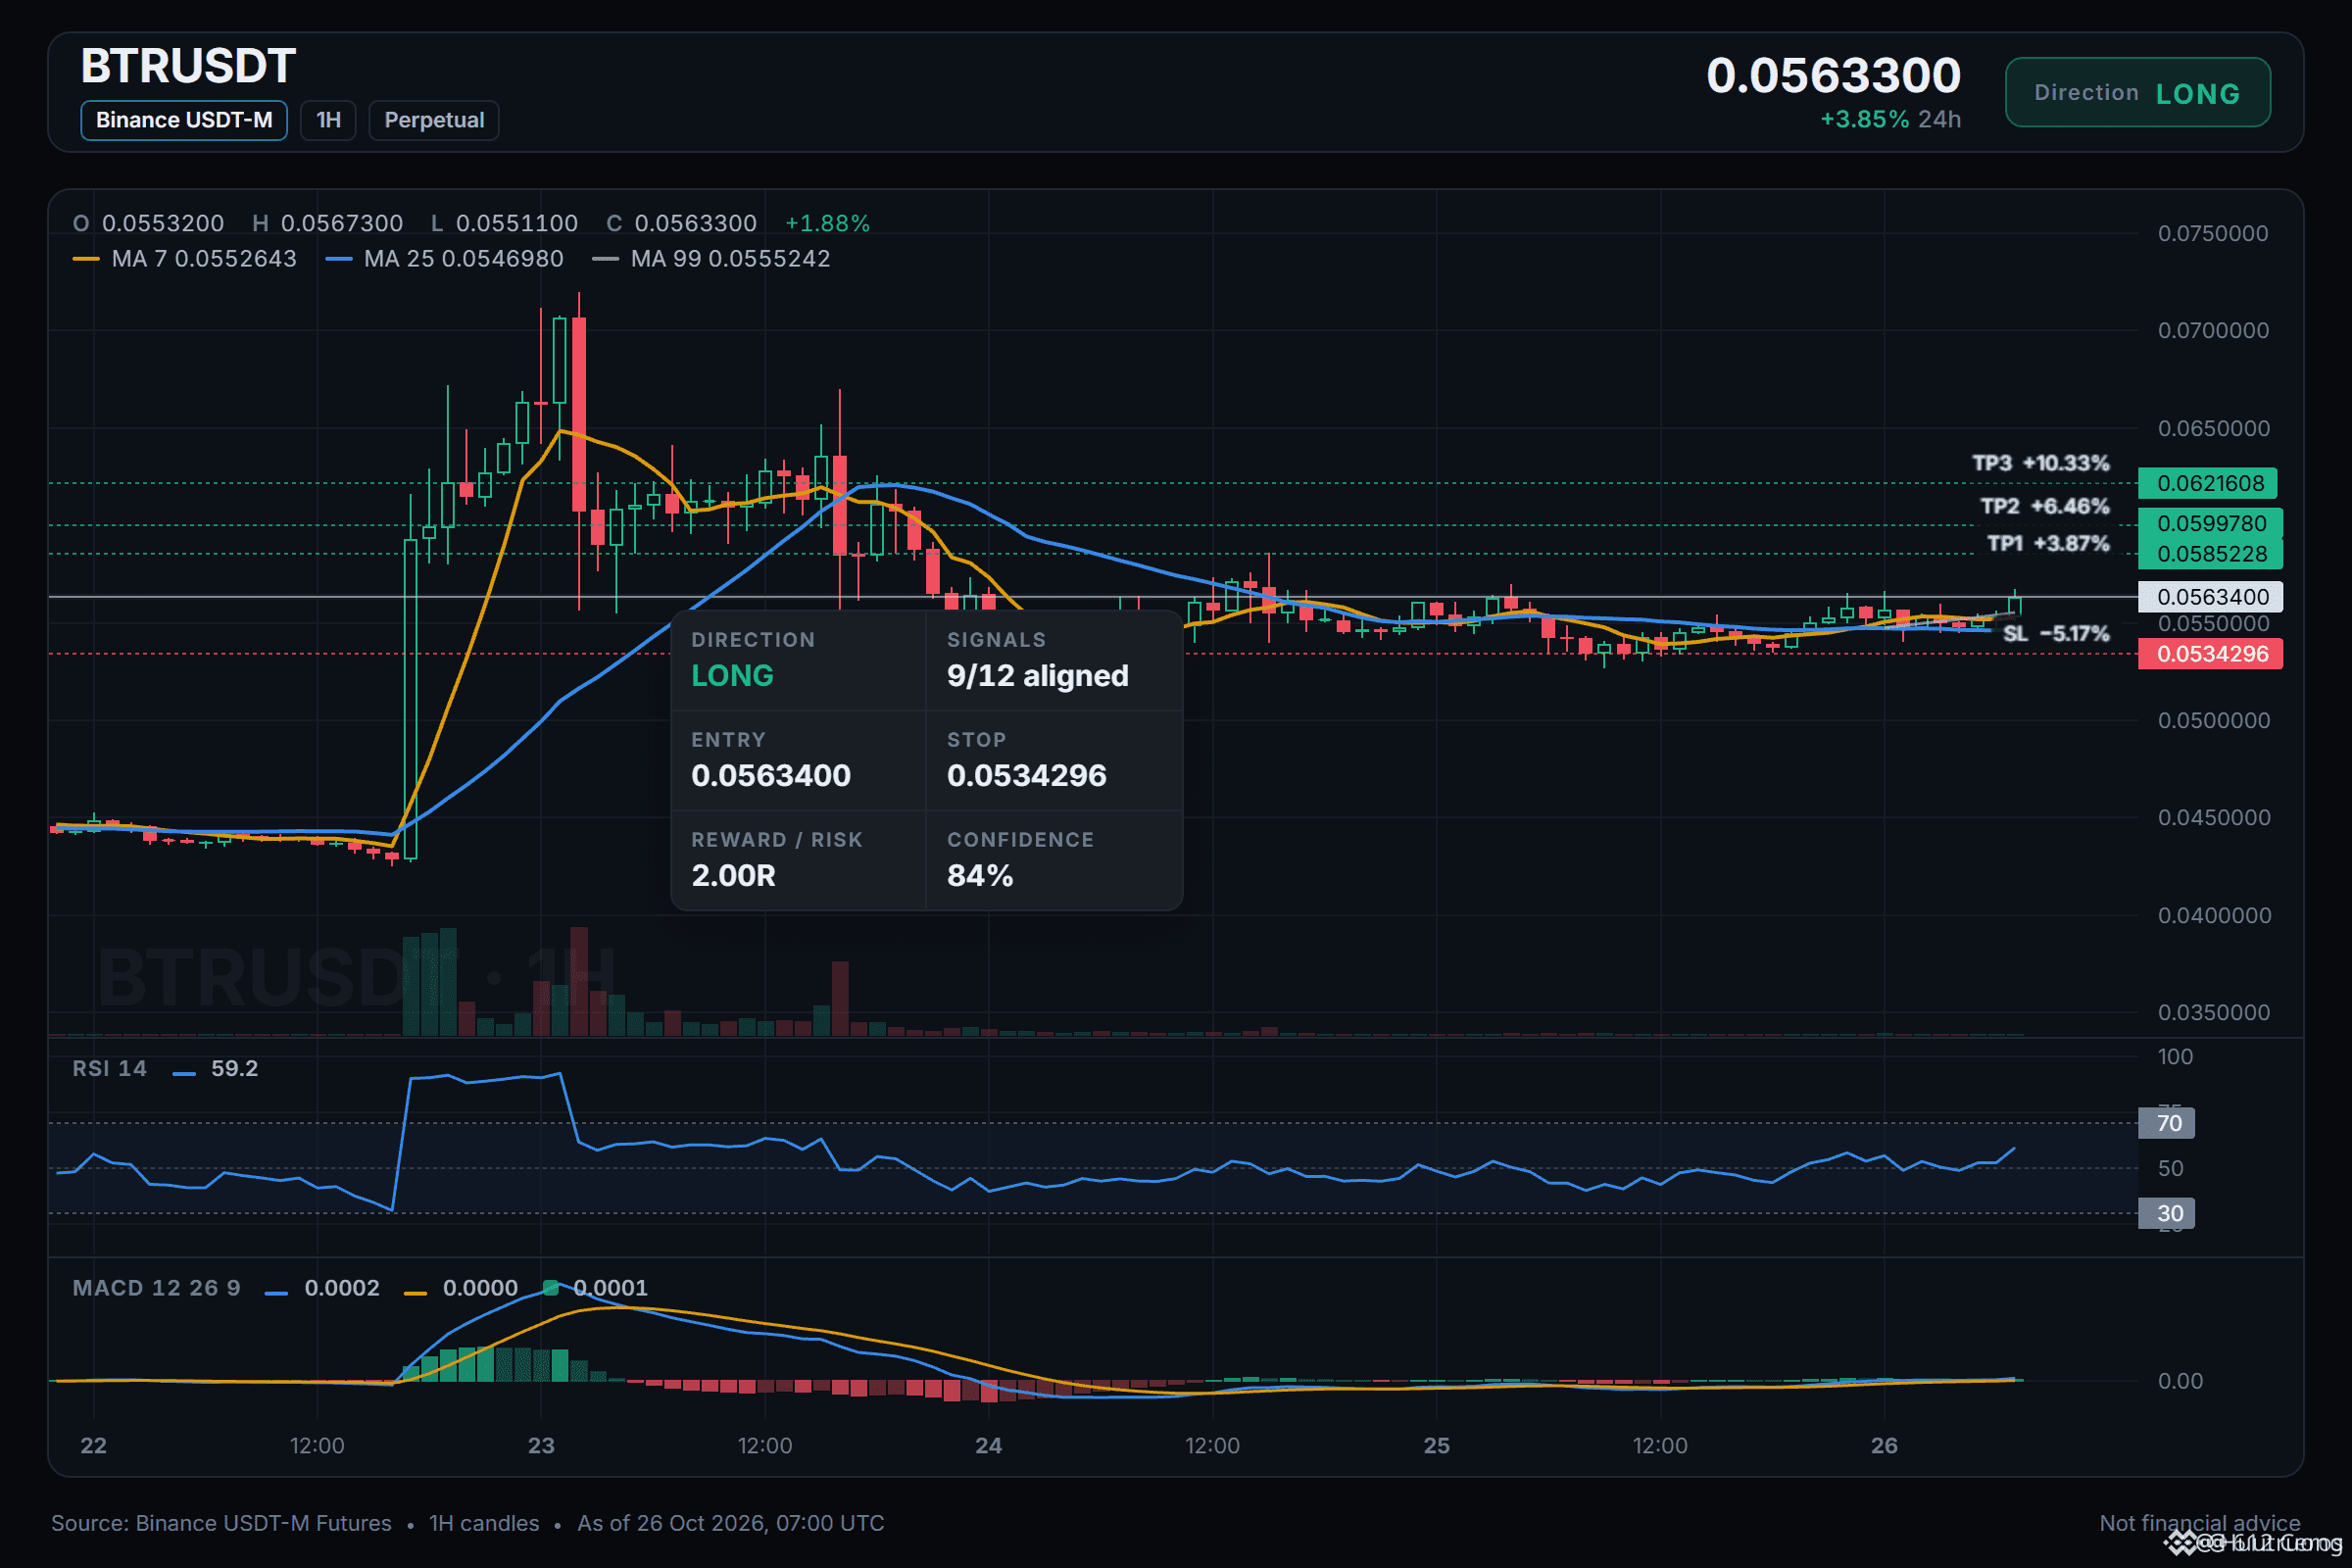
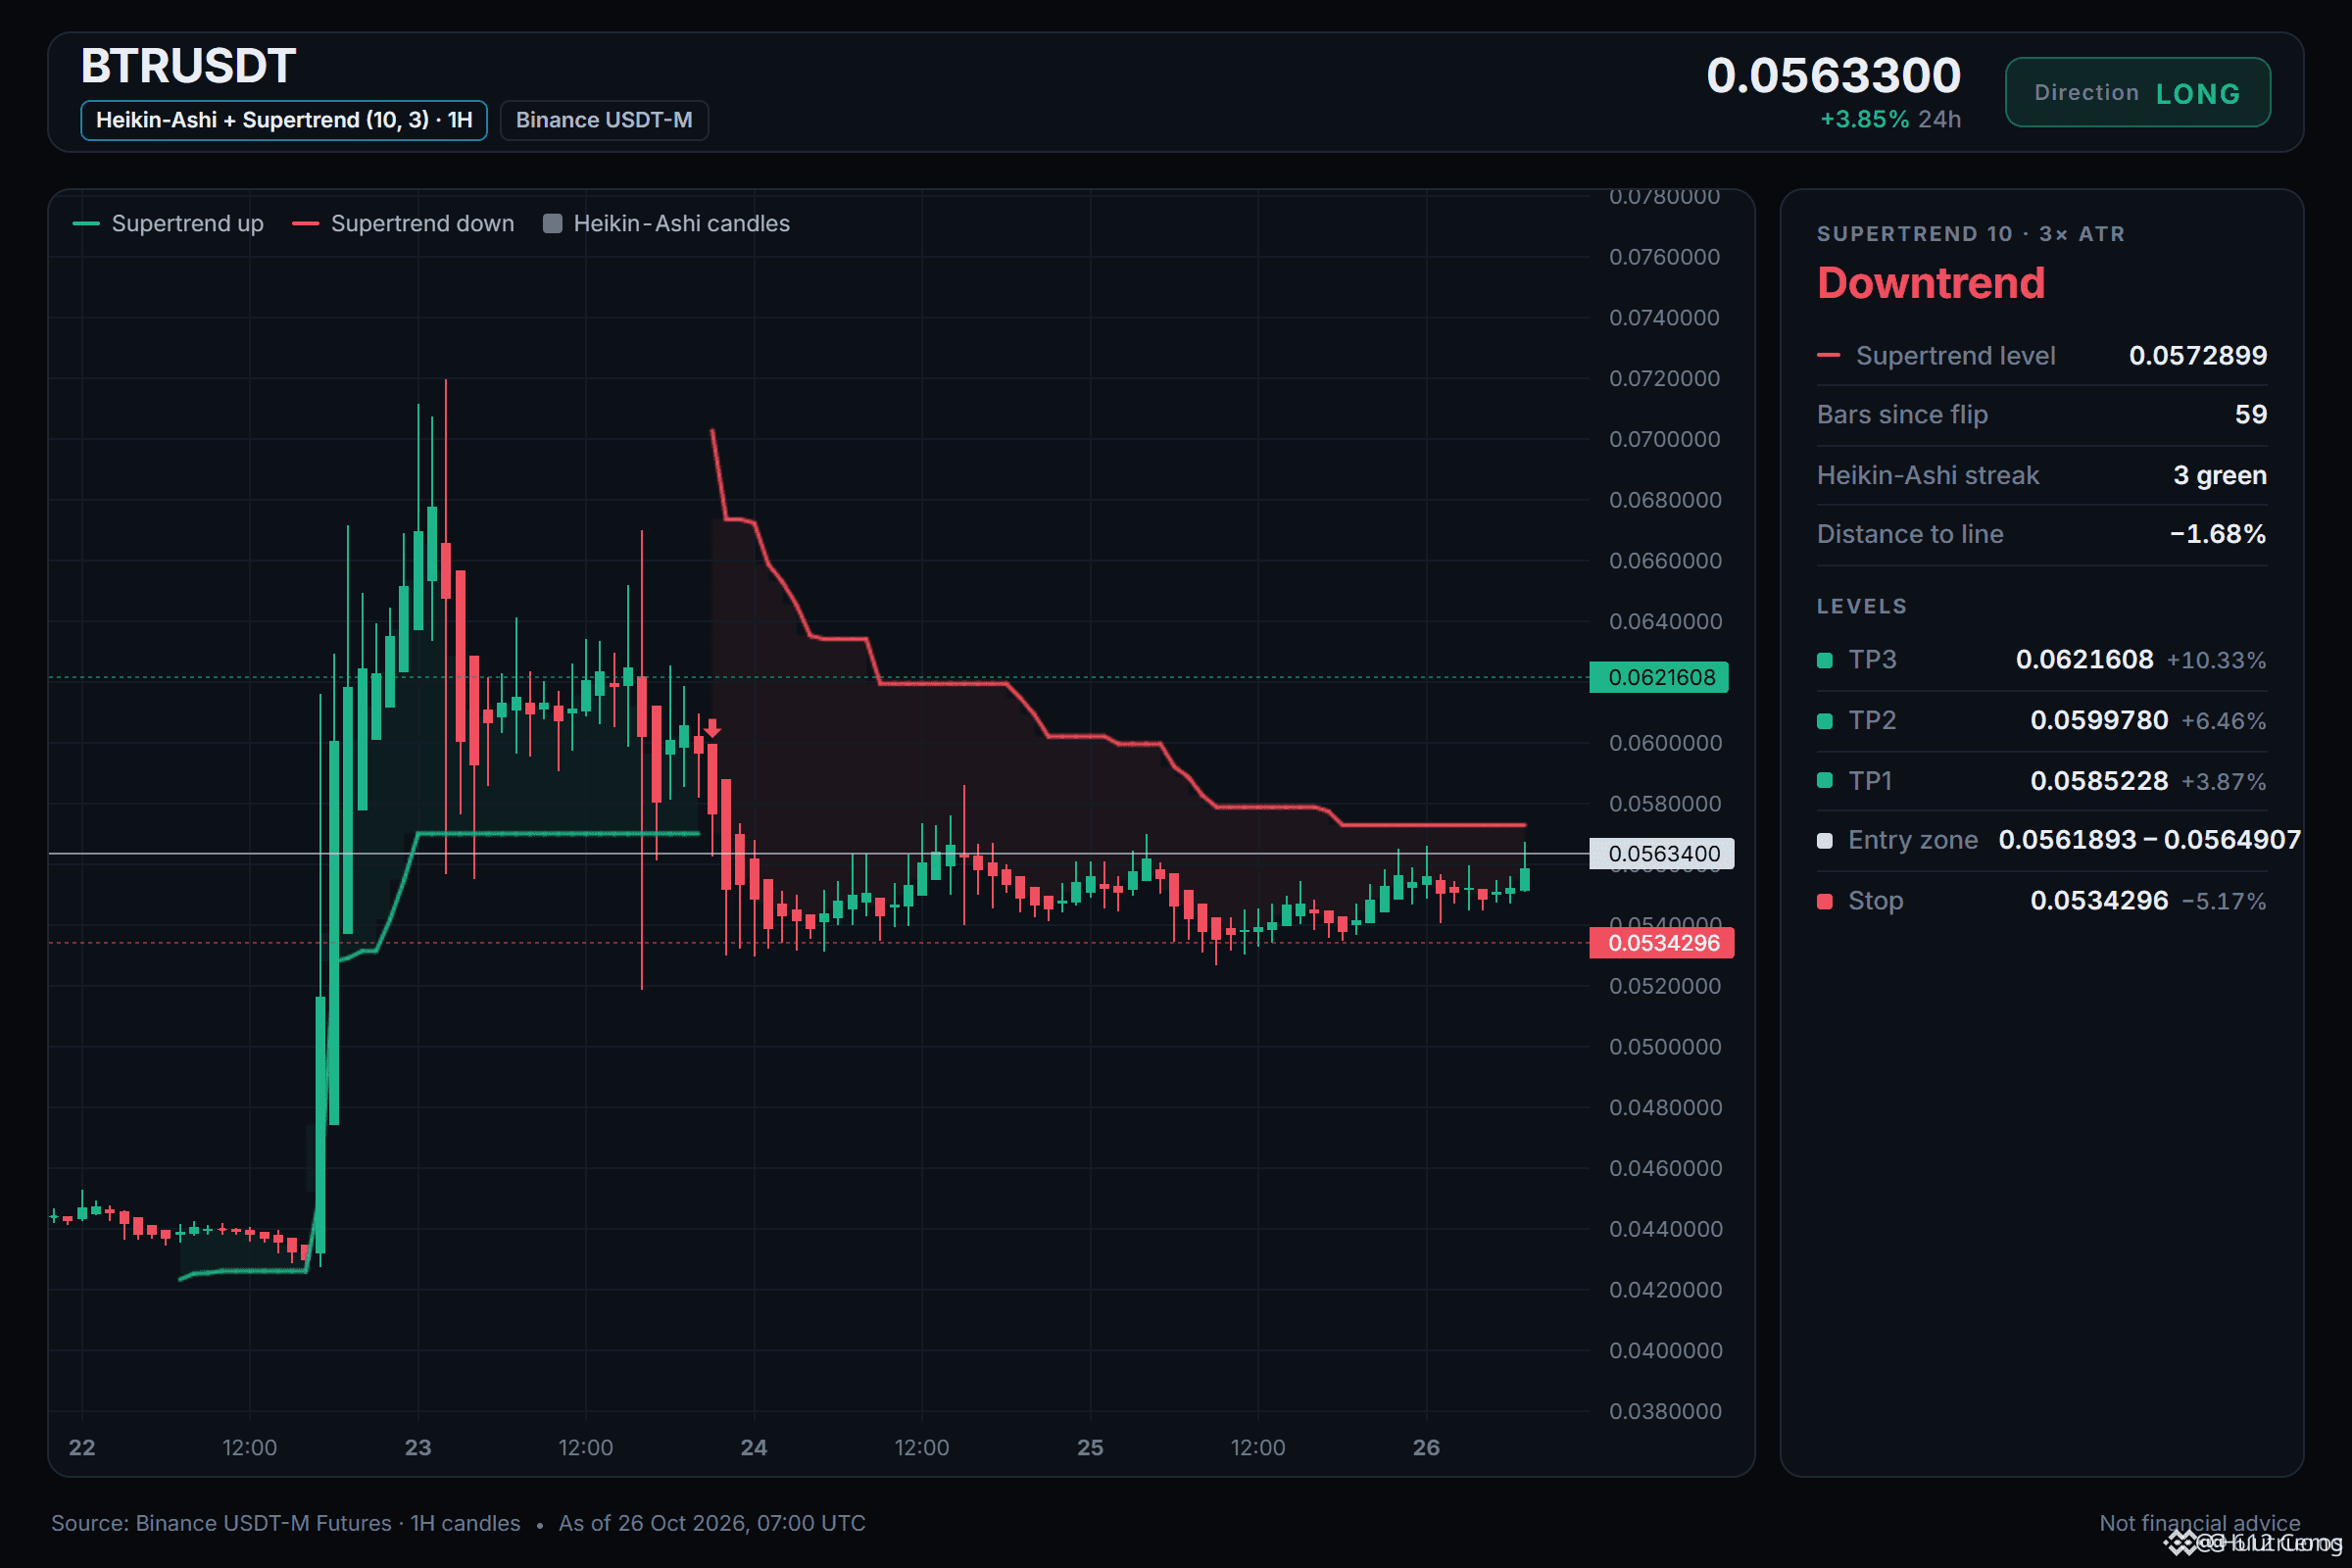
BTR 真的在上漲,還是隻是波動噪音?
🟢 做多 $BTR /USDT:預期價格上漲
傾向:做多 · 強
入場:0.0561893 – 0.0564907
止盈1:0.0585228(+3.9%)
止盈2:0.0599780(+6.5%)
止盈3:0.0621608(+10.3%)
止損:0.0534296(-5.2%)
計劃:僅在該區間內入場,在止盈1平倉50%,止盈2平倉25%,止盈3平倉25%,並在達到止盈1後將止損移至入場價。
爲什麼做多?12個信號中有9個一致看多,0個看空。
• 日線趨勢向上(價格高於EMA50和EMA200)
• 4小時趨勢向上(價格高於EMA50和EMA200)
• 1小時趨勢向上(價格高於EMA50和EMA200)
問:RSI已經達到64.4,爲什麼還要做多?
答:1小時RSI爲64.4,意味着買方仍有推動價格上漲的空間。
問:如果日線趨勢反轉,套住多頭怎麼辦?
答:日線趨勢看漲,價格高於EMA50和EMA200。
你認爲BTR的失效位在哪裏?
·
--
看跌
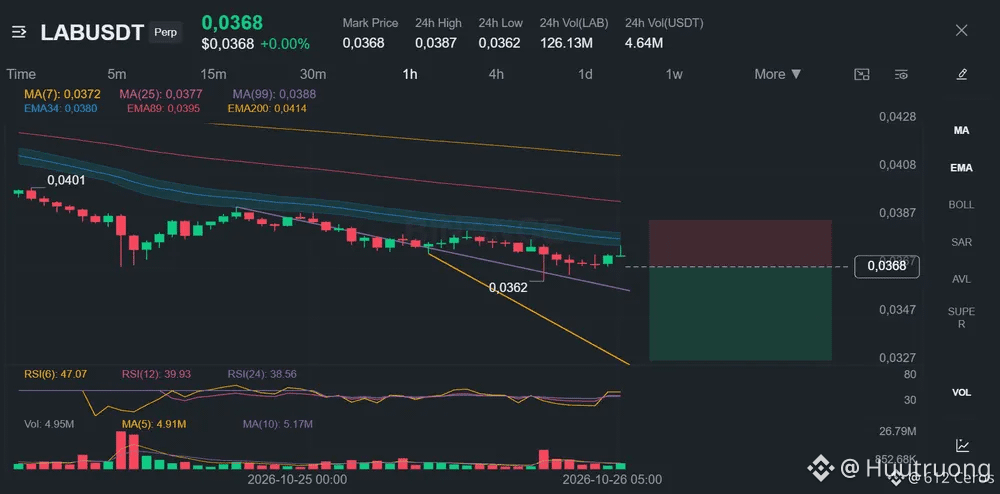
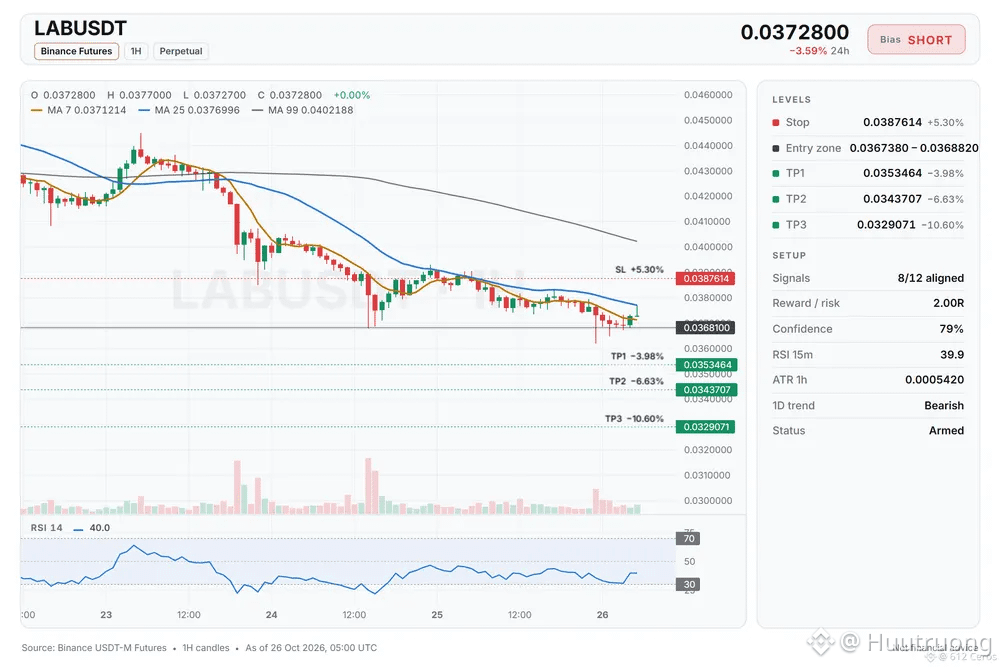
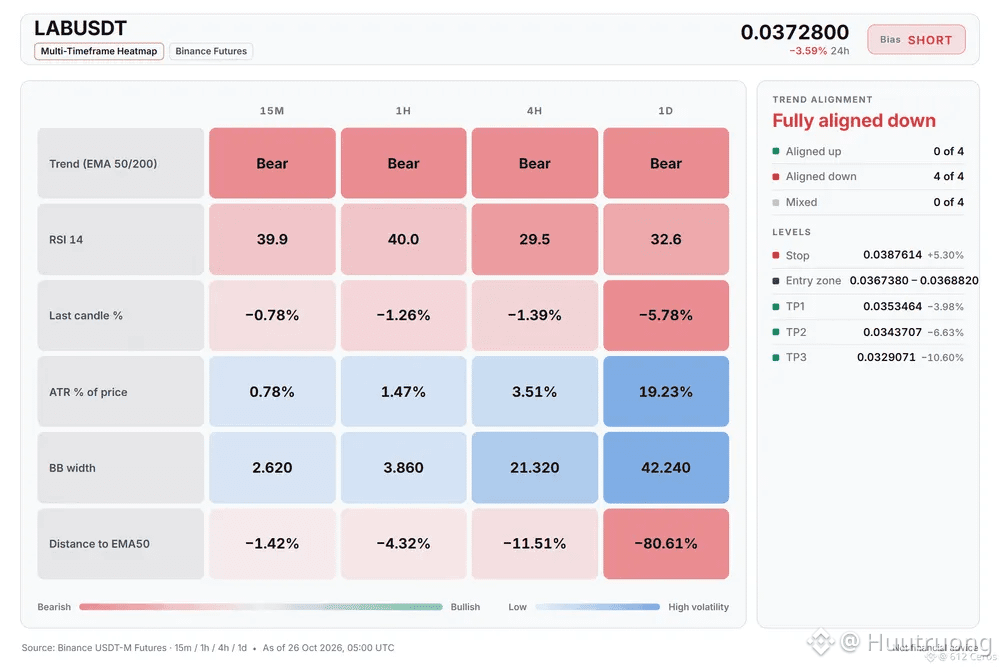
LAB 在各個趨勢中都處於深度空頭排列
🔴 SHORT $LAB /USDT:預期價格下跌
偏向:SHORT · 強
進場:0.0367380 – 0.0368820
TP1:0.0353464 (-4.0%)
TP2:0.0343707 (-6.6%)
TP3:0.0329071 (-10.6%)
SL:0.0387614 (+5.3%)
計畫:僅在區間內進場,於 TP1 平倉 50%,TP2 平倉 25%,TP3 平倉 25%,並在 TP1 後將止損移至進場價。
為什麼做空?LAB 清單:8/12 同意,1 票反對。
• 日線趨勢向下(低於 EMA50 與 EMA200)
• 4 小時趨勢向下(低於 EMA50 與 EMA200)
• 1 小時趨勢向下(低於 EMA50 與 EMA200)
注意:遠低於其均值,可能會反彈(較 1 小時 EMA50 低 −3.1 ATR)
注意:如果價格 পৌঁ達 0.0387614 的止損,則此想法是錯的
總結:日線空頭排列(價格低於兩條 EMA)是最強的訊號,但價格已低於 1 小時 EMA50 3.1 ATR,這表示很可能出現反彈
如果這筆空單失敗,你的失效價位在哪裡?
·
--
看跌
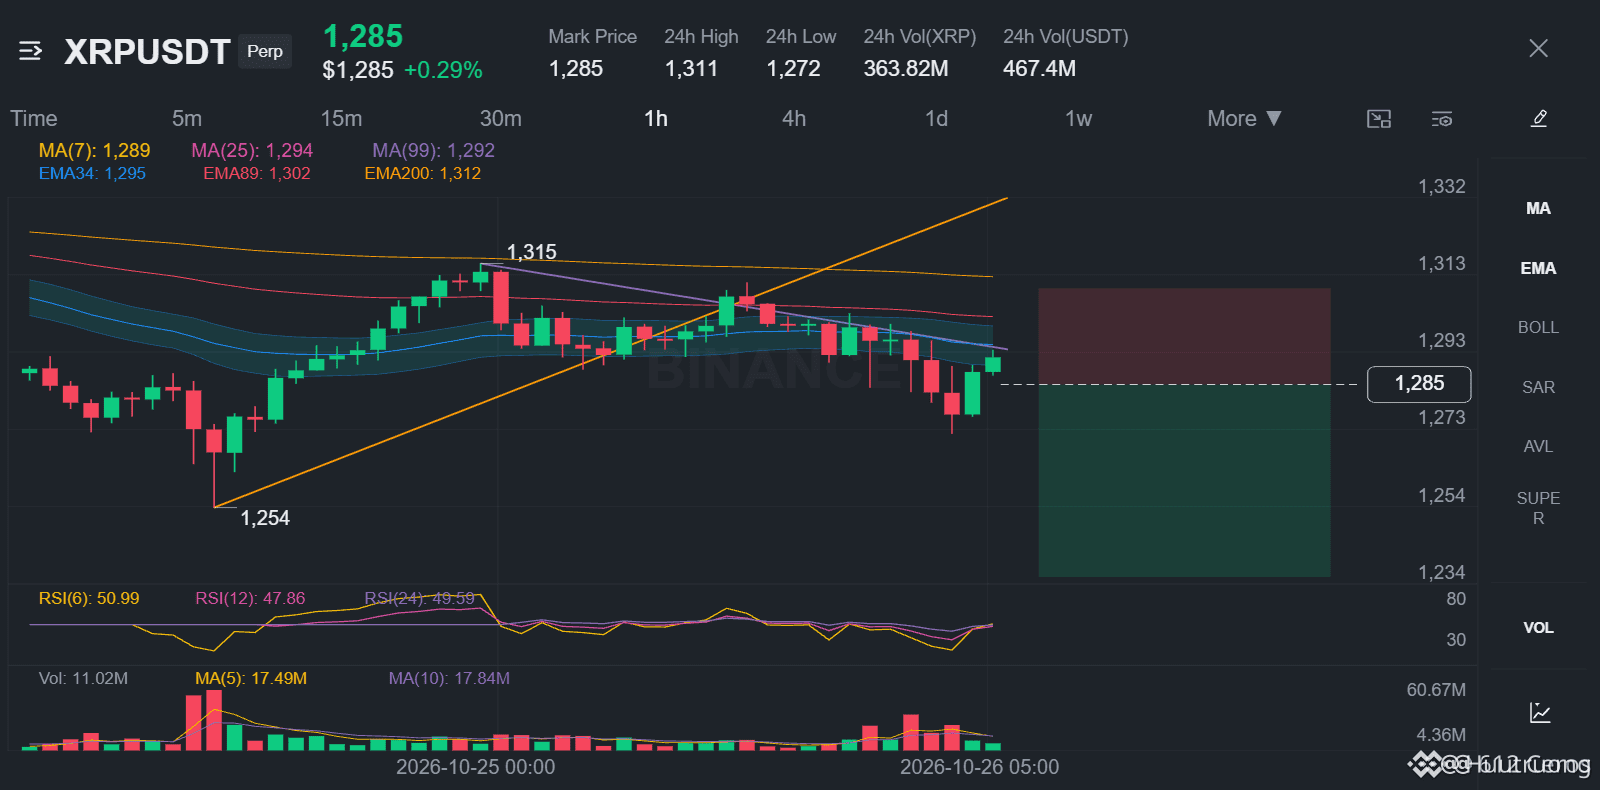
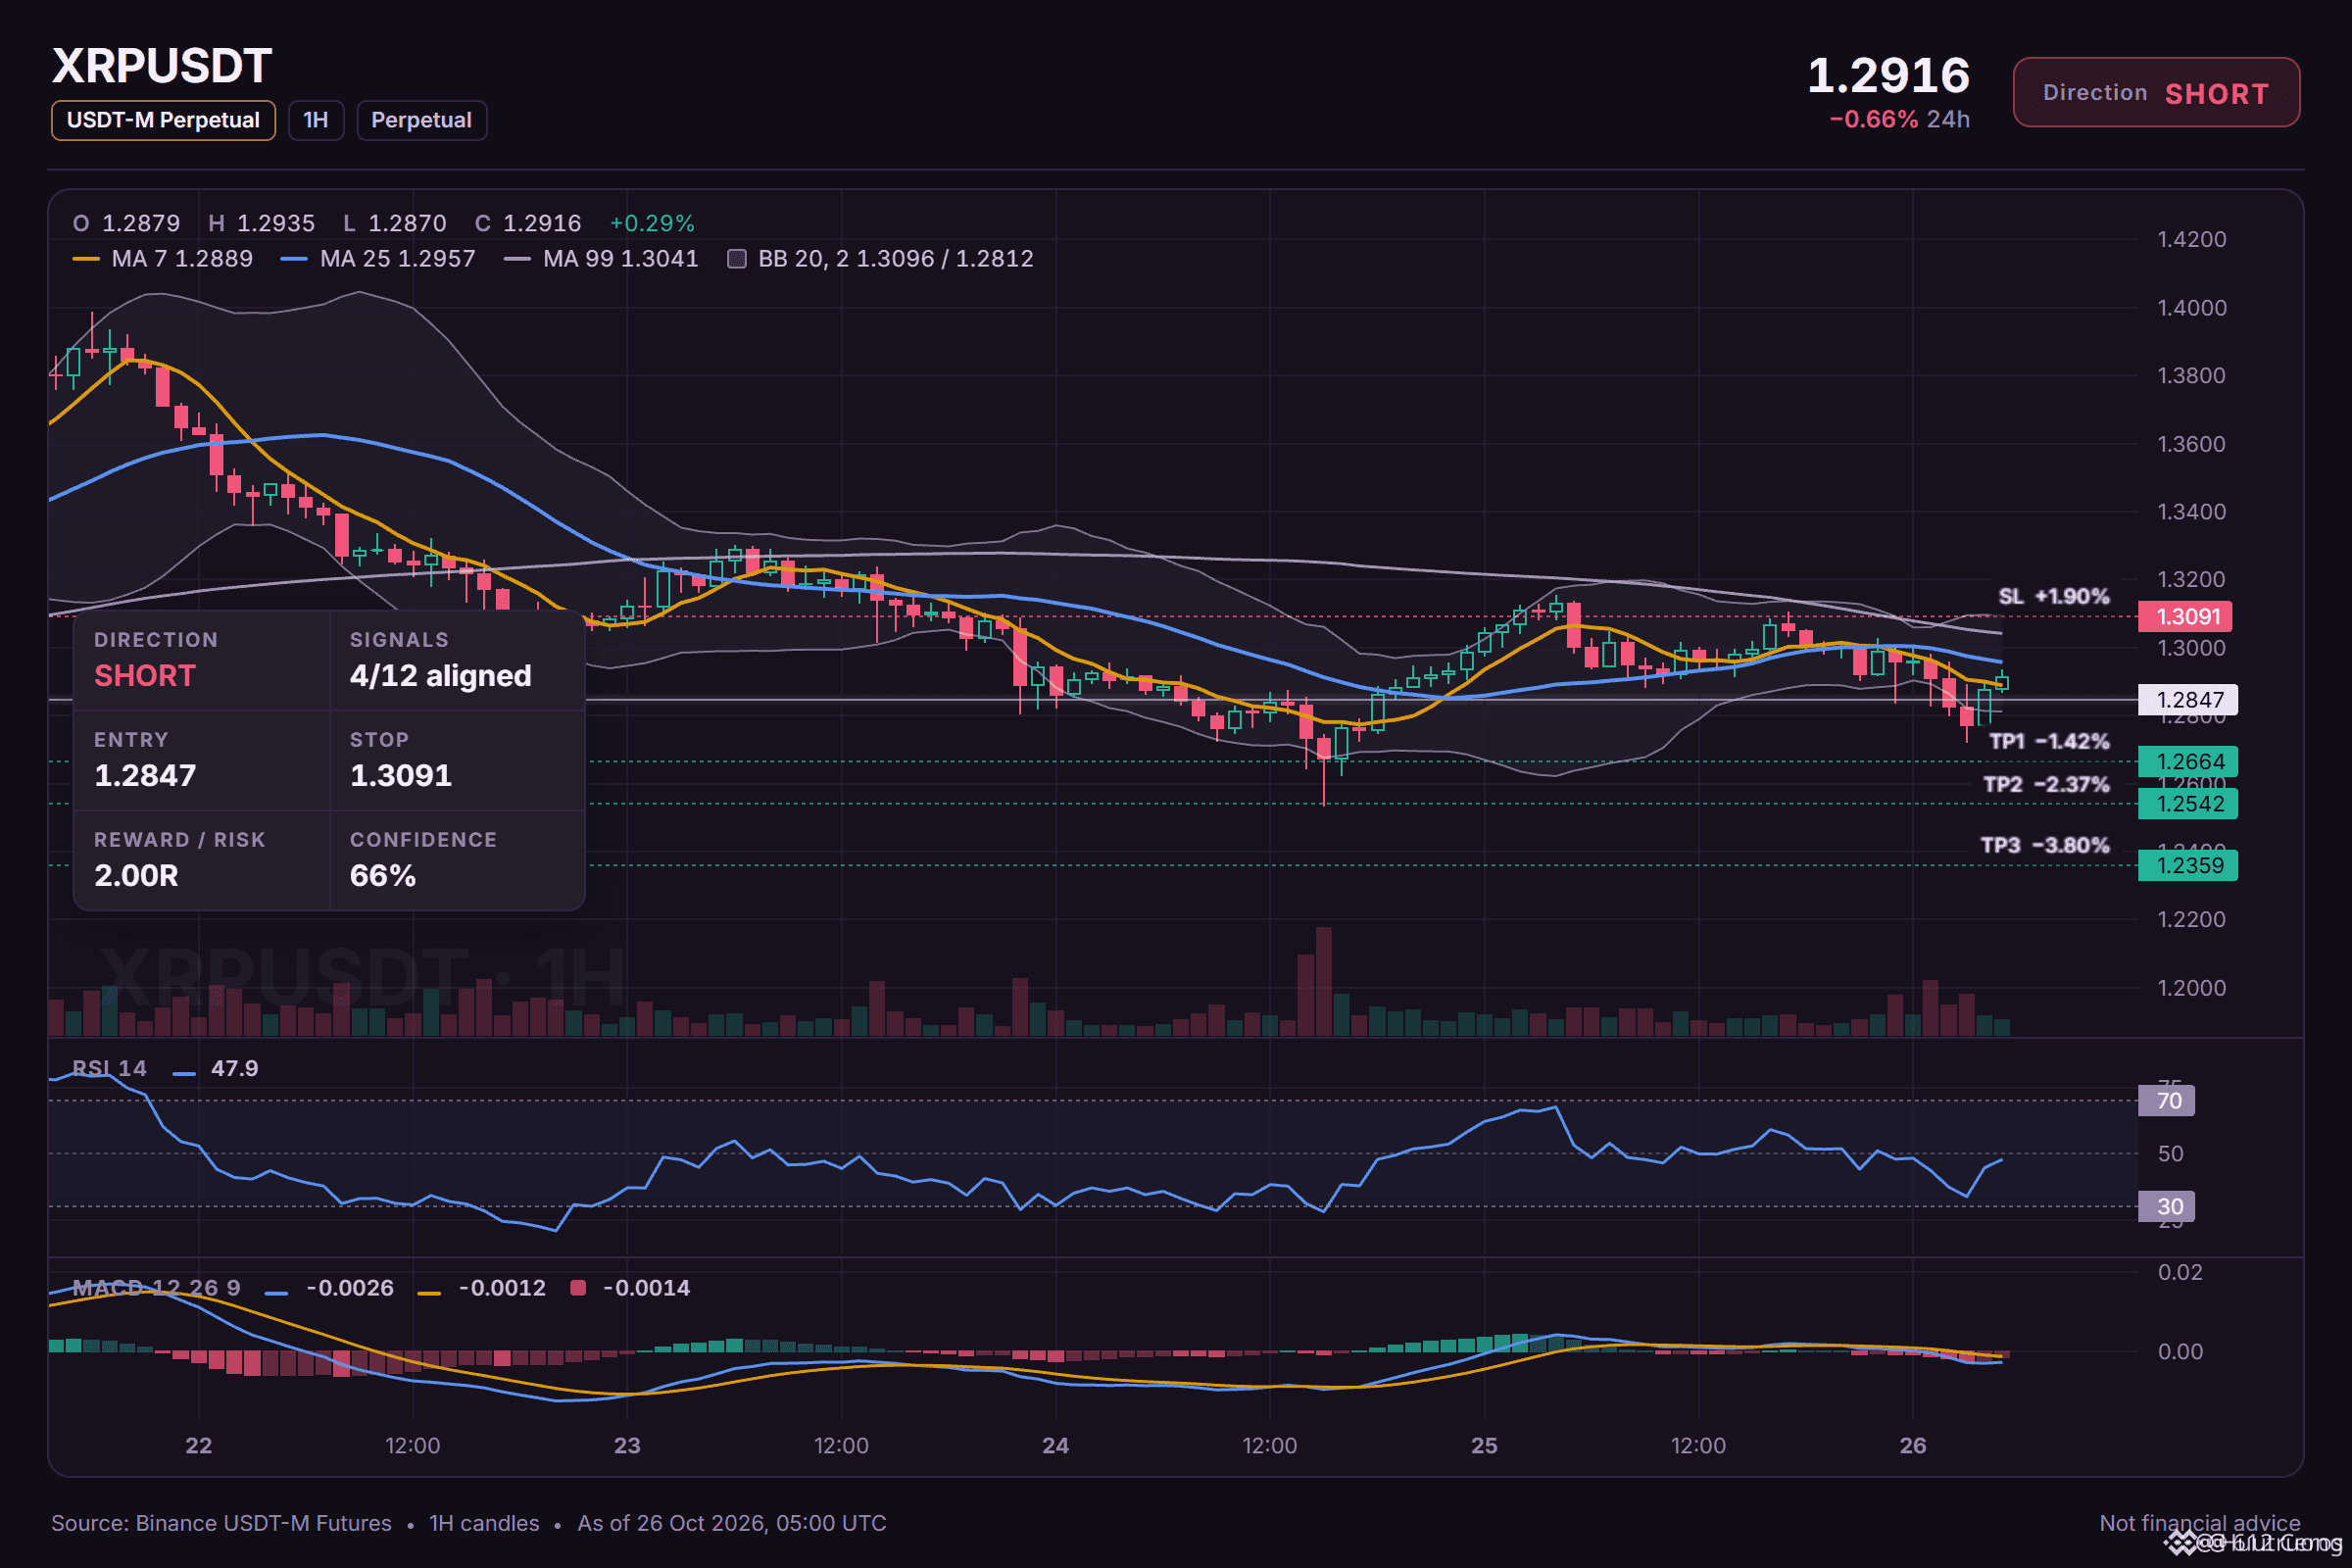
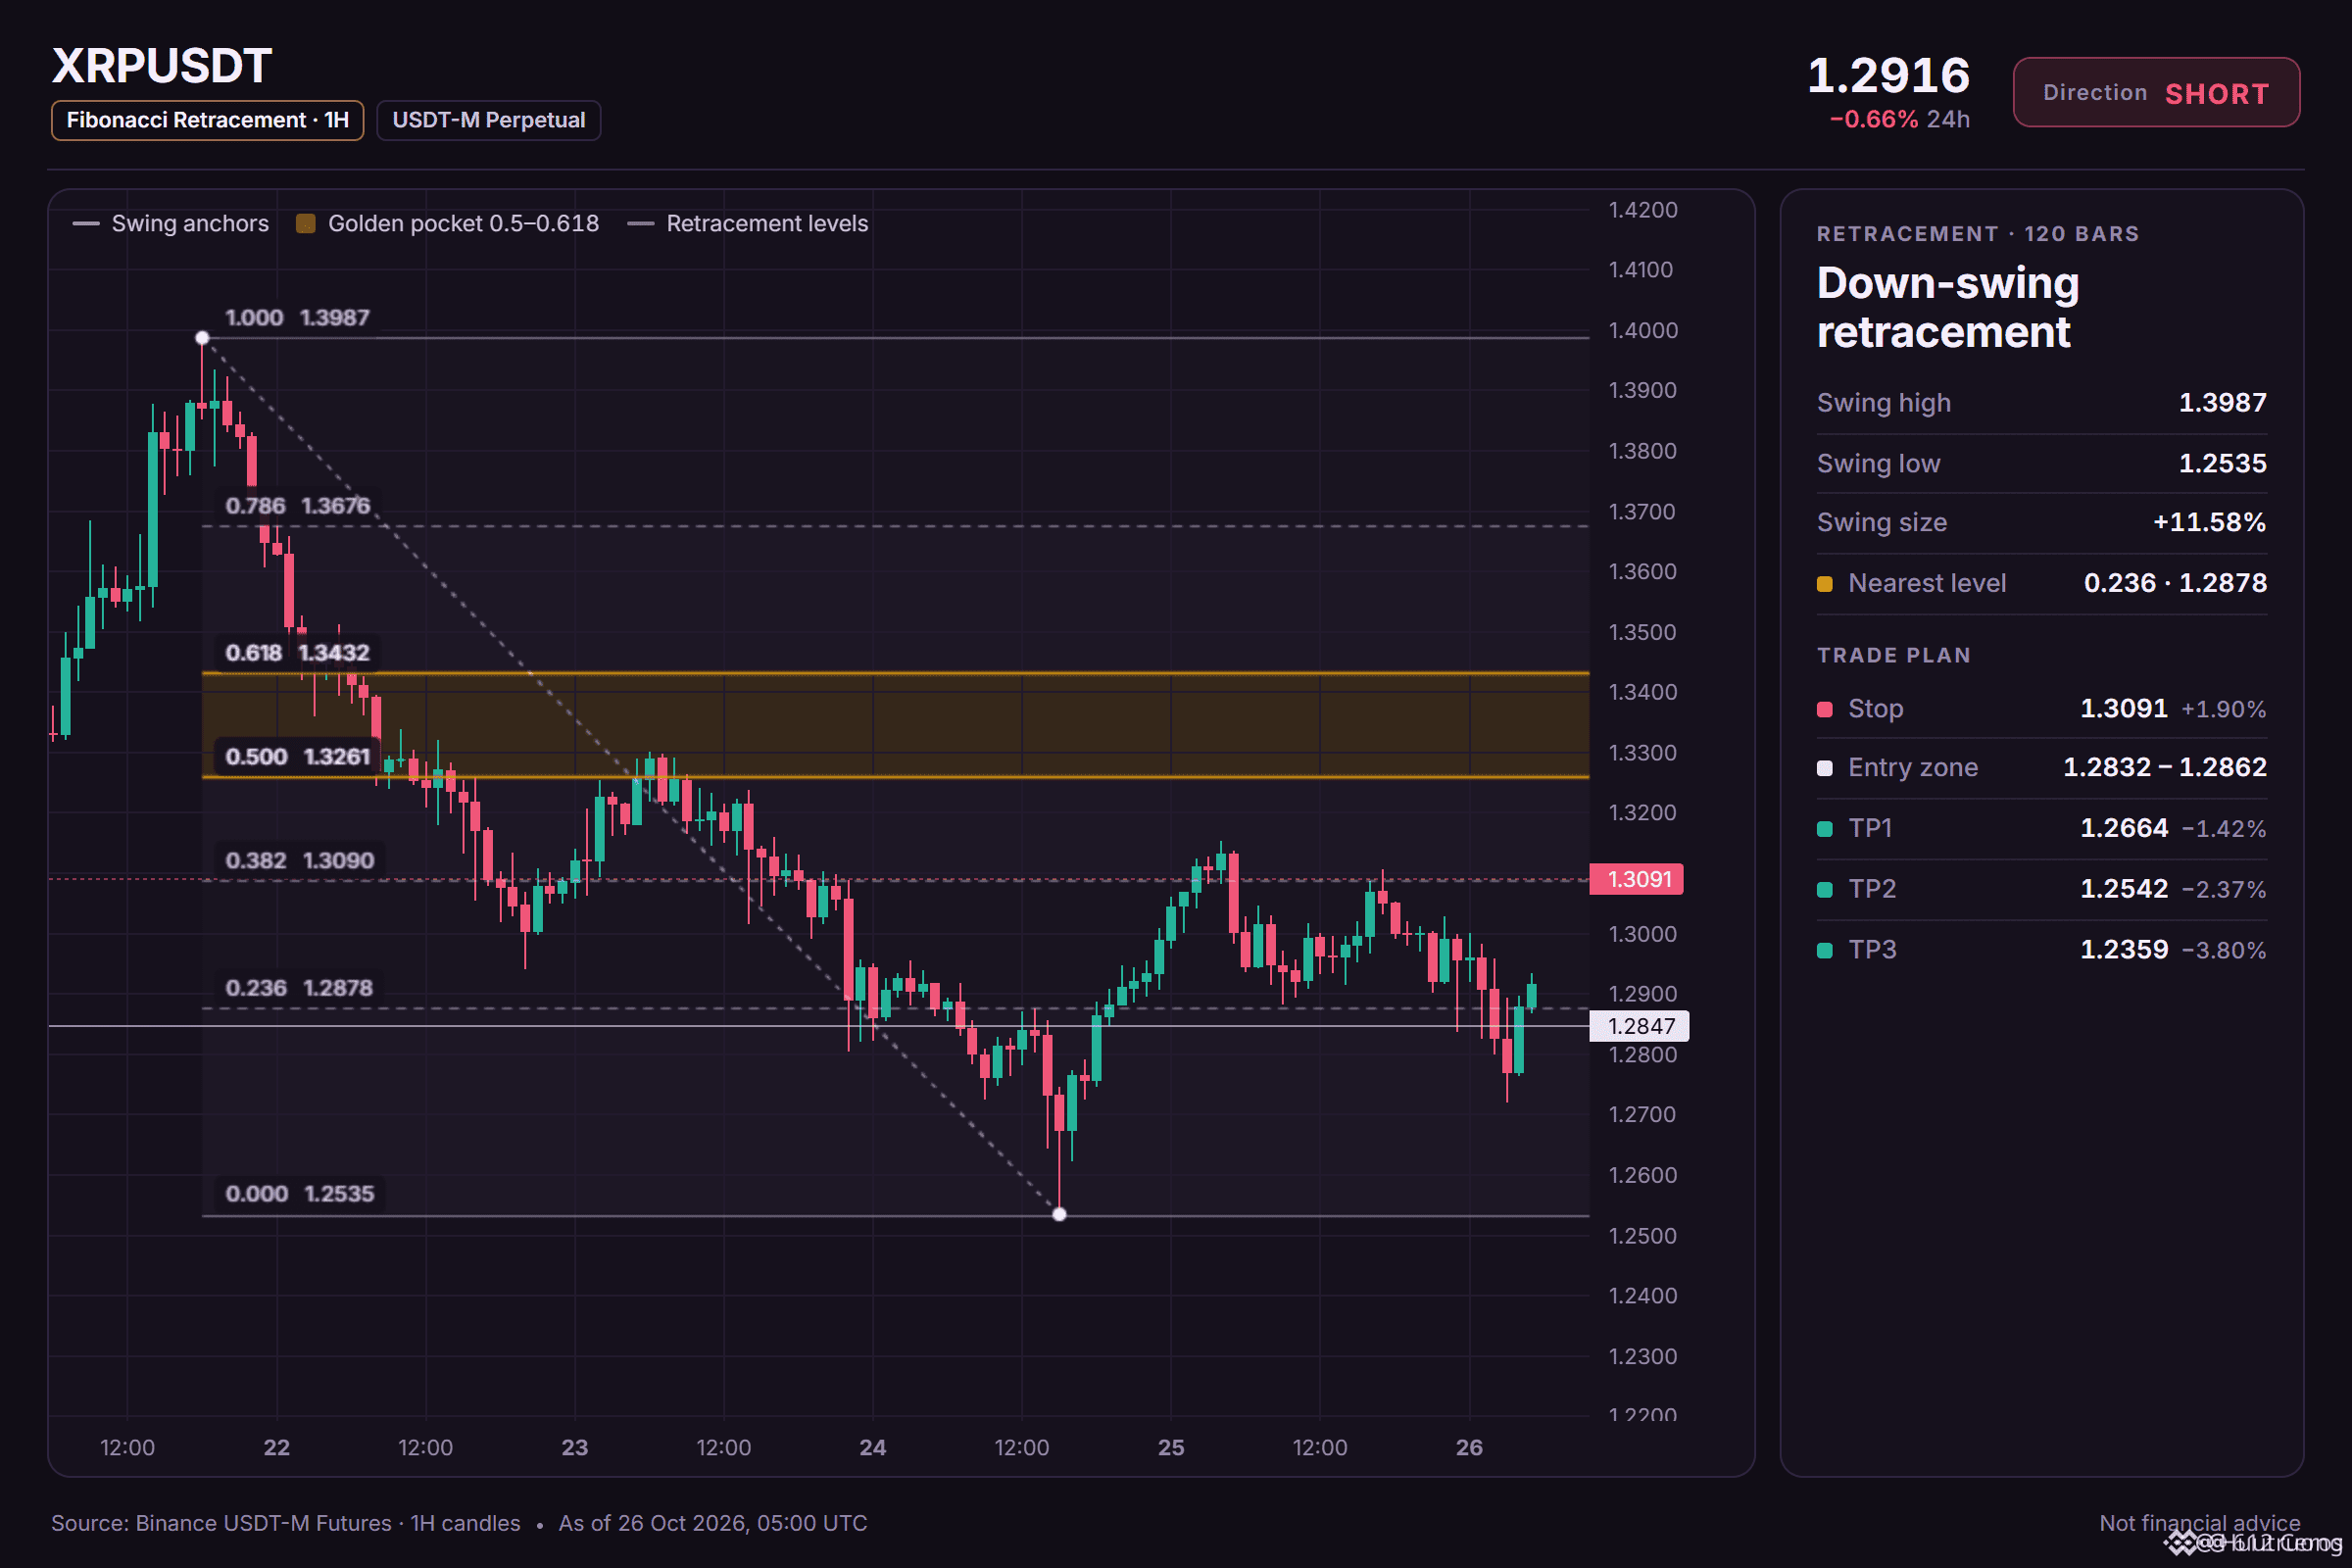
XRP 在4小時圖上仍低於堆疊的EMA帶
🔴 做空 $XRP /USDT:預期價格下跌
偏向:做空 · 傾向
進場:1.2832 – 1.2862
TP1:1.2664 (-1.4%)
TP2:1.2542 (-2.4%)
TP3:1.2359 (-3.8%)
SL:1.3091 (+1.9%)
計劃:僅在區間內進場,在TP1平倉50%,TP2平倉25%,TP3平倉25%,並在TP1後將止損移至進場價。
備註:僅有中等信心,請保持較小倉位。
為什麼做空?4/12 個訊號同意,0 個反對。
• 4小時趨勢向下(低於 EMA50 & EMA200)
• 1小時趨勢向下(低於 EMA50 & EMA200)
• 賣方正在主導走勢(15分鐘 ADX 25.8)
簡短版本:
1. 4小時趨勢顯示價格低於 EMA50 和 EMA200,形成看跌排列,表示波段走勢偏下。
2. 1小時趨勢同樣顯示價格低於 EMA50 和 EMA200,因此短期趨勢也向下。
3. 4小時 RSI 位於 38.1,低於45,動能偏空,但日內波幅使這段走勢不那麼 निर्ण定。
如果你不同意,你會把你的水平設在哪裡?
·
--
看跌
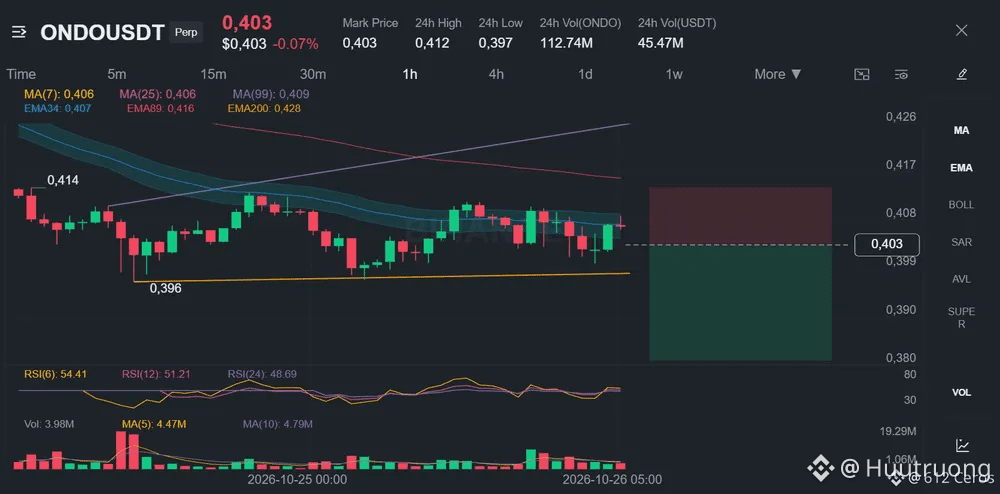
區間震盪的幣種常讓做多者在逆勢操作中受困。
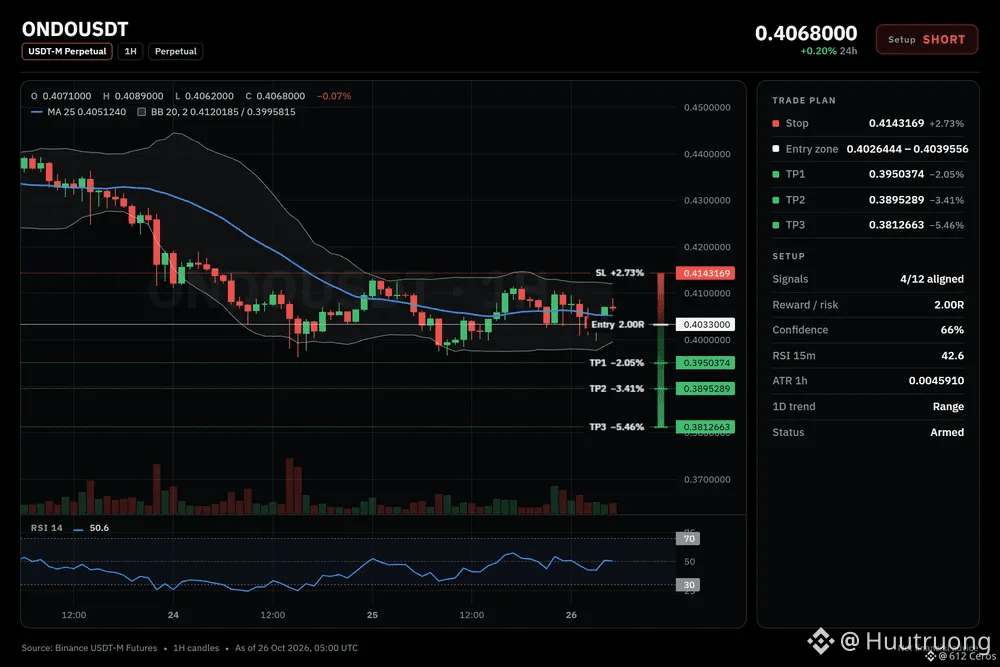
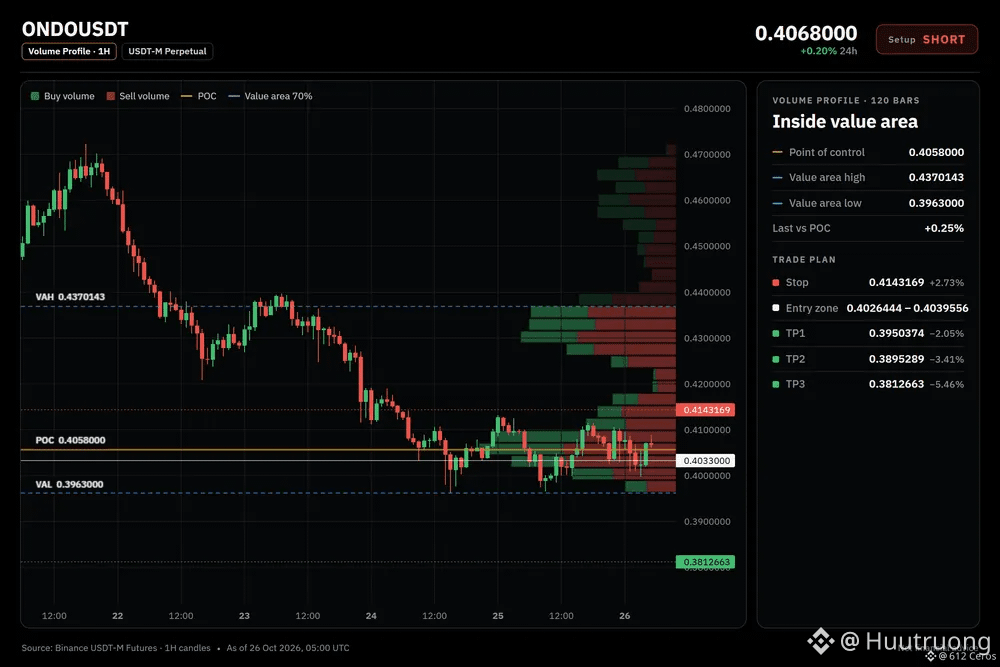
🔴 做空 $ONDO /USDT:預期價格將下跌
方向:做空 · 偏向做空
進場:0.4026444 – 0.4039556
TP1:0.3950374(-2.0%)
TP2:0.3895289(-3.4%)
TP3:0.3812663(-5.5%)
SL:0.4143169(+2.7%)
計畫:僅在區間內進場,於 TP1 平倉 50%、TP2 平倉 25%、TP3 平倉 25%,並在 TP1 後將停損移至進場價。
備註:信心程度僅屬中等,請控制倉位。
為什麼做空?12 個訊號中有 4 個同意,0 個反對。
• 4 小時趨勢向下(低於 EMA50 和 EMA200)
• 1 小時趨勢向下(低於 EMA50 和 EMA200)
• 賣方主導這波走勢(15 分鐘 ADX 20.9)
看跌走勢:
若 4 小時趨勢維持,且價格低於 EMA 均線群,1 小時價格可能繼續下滑至第一個目標。由於日線趨勢處於區間震盪,這波走勢可能不會擴大。
什麼情況會讓這個判斷失效:
如果 1 小時價格重新站回 0.4039556 的進場價位,看跌結構就會遭到破壞,我會平掉空單。
你希望做空前看到價格到哪裡?
·
--
看跌
4 小時週期的趨勢排列在所有時間框架上都看跌。
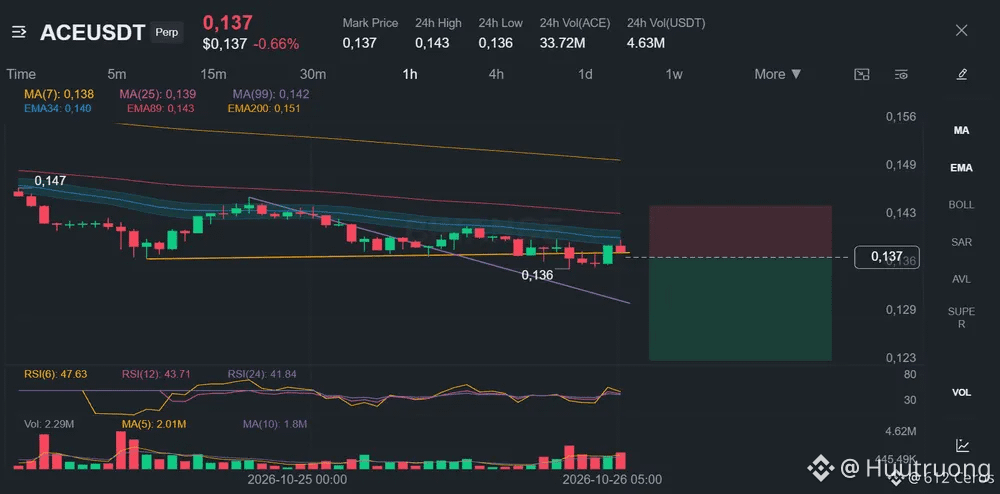
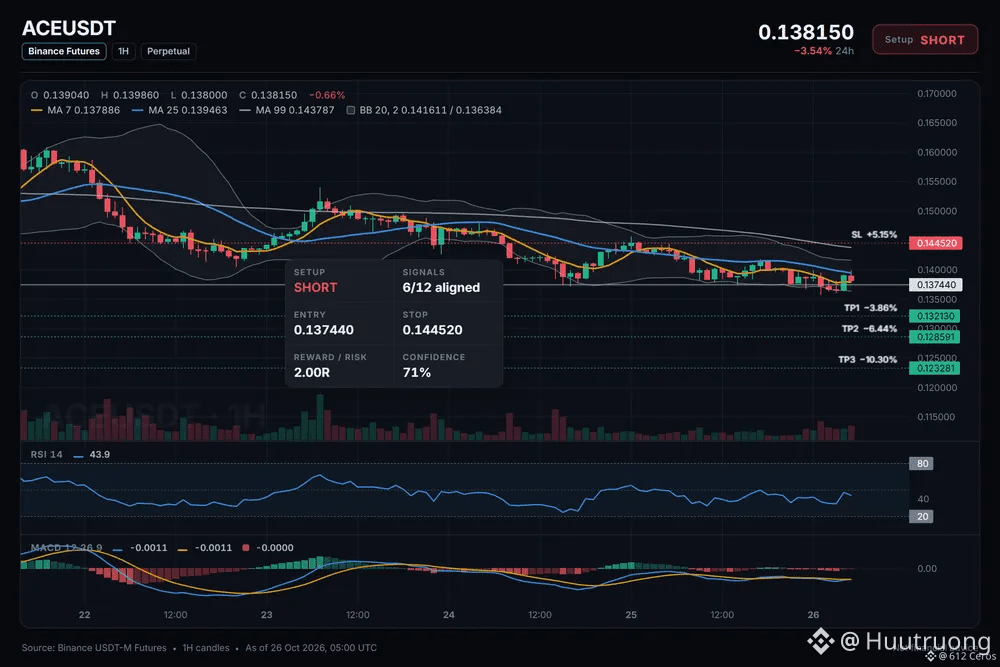
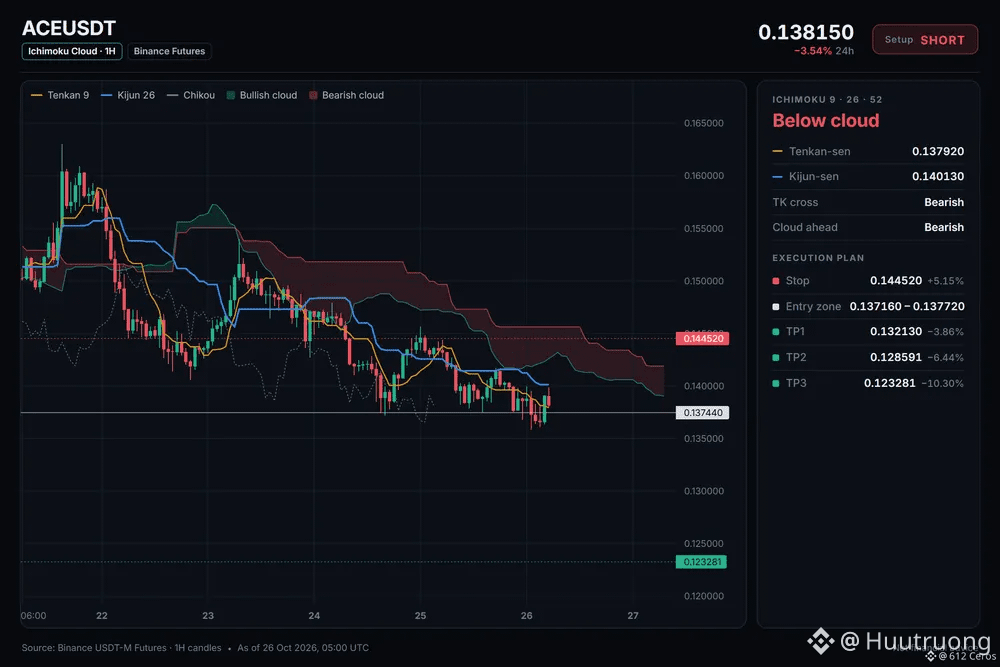
🔴 做空 $ACE /USDT:預期價格將下跌
偏向:做空 · 強
進場:0.137160 – 0.137720
TP1:0.132130 (-3.9%)
TP2:0.128591 (-6.4%)
TP3:0.123281 (-10.3%)
止損:0.144520 (+5.2%)
計劃:僅在區間內進場,於 TP1 平倉 50%、TP2 平倉 25%、TP3 平倉 25%,並在 TP1 後將止損移至進場價。
為什麼做空?6/12 個訊號一致,0 個訊號相反。
• 4 小時趨勢向下(低於 EMA50 和 EMA200)
• 1 小時趨勢向下(低於 EMA50 和 EMA200)
• 賣方動能較強(4 小時 RSI 33.9)
我今天對 ACE 的看法
我正在關注 ACE 的做空機會。1 小時價格為 0.137440,而日線趨勢處於區間整理,因此這波走勢主要受 4 小時週期的看跌排列所驅動。我希望看到日線趨勢維持區間整理,同時 4 小時週期的排列保持不變。
你認為這筆交易的失效價位在哪裡?
·
--
看跌
查看翻譯
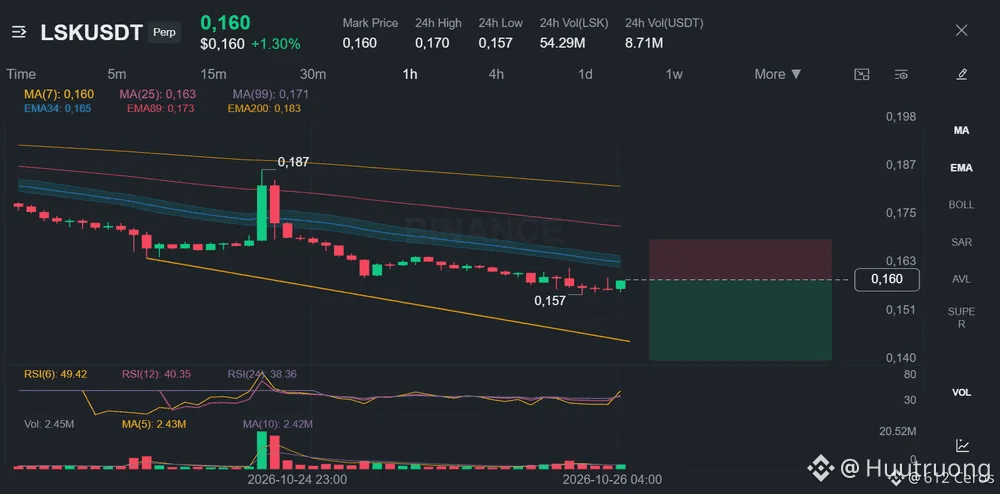
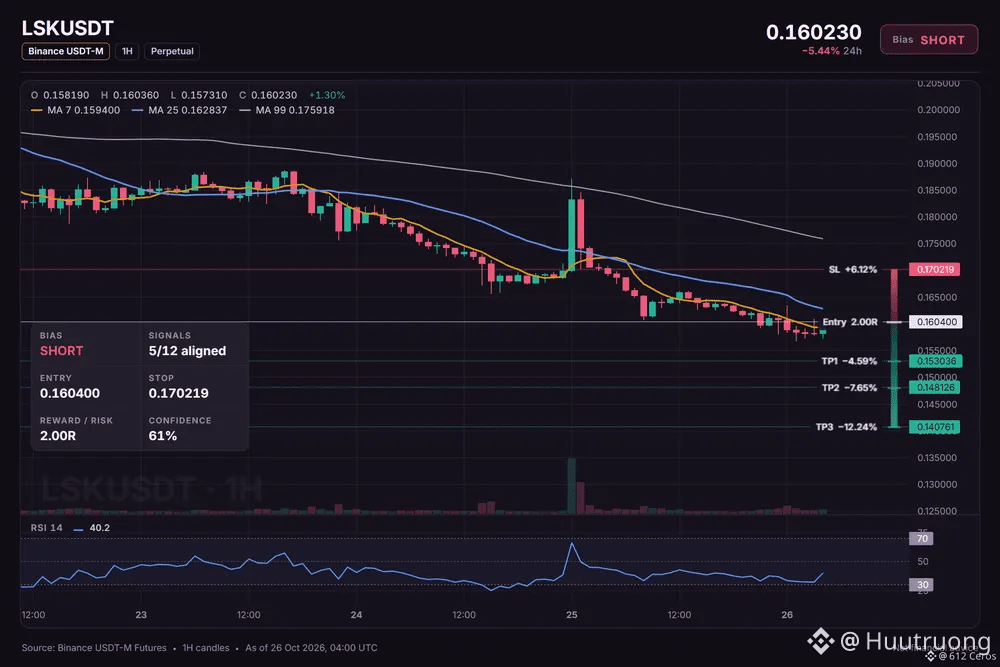
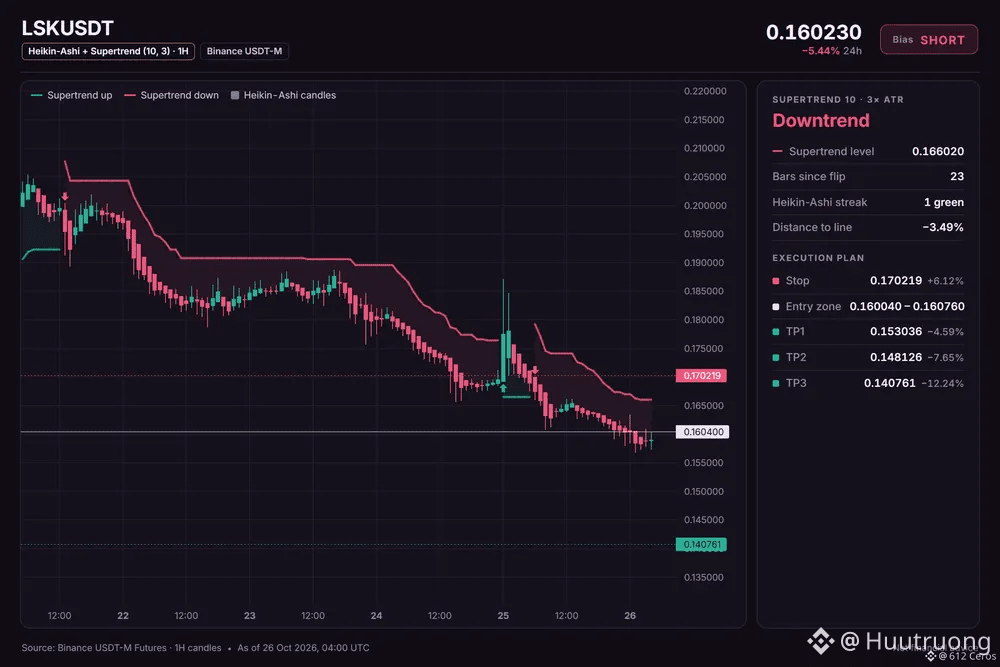
🔴 SHORT $LSK /USDT: expecting price to go DOWN
Bias: SHORT · Leaning
Entry: 0.160040 – 0.160760
TP1: 0.153036 (-4.6%)
TP2: 0.148126 (-7.7%)
TP3: 0.140761 (-12.2%)
SL: 0.170219 (+6.1%)
Plan: enter only inside the zone, close 50% at TP1, 25% at TP2, 25% at TP3, and move the stop to entry after TP1.
Note: moderate conviction only, keep size light.
LSK looks weak but buyers are fighting back now
Why SHORT? 5/12 signals agree, 2 against.
• 4h trend down (below EMA50 & EMA200)
• 1h trend down (below EMA50 & EMA200)
• Sellers have the momentum (1h RSI 40.2)
Risk: Price is washed out, bounces are common from here (4h RSI 24.4, oversold)
The 4h trend is bearish and the 1h RSI is below 45, but the 15m RSI shows buyers in control, so conviction is moderate.
What is your invalidation level if you are in this trade?
·
--
看跌
查看翻譯
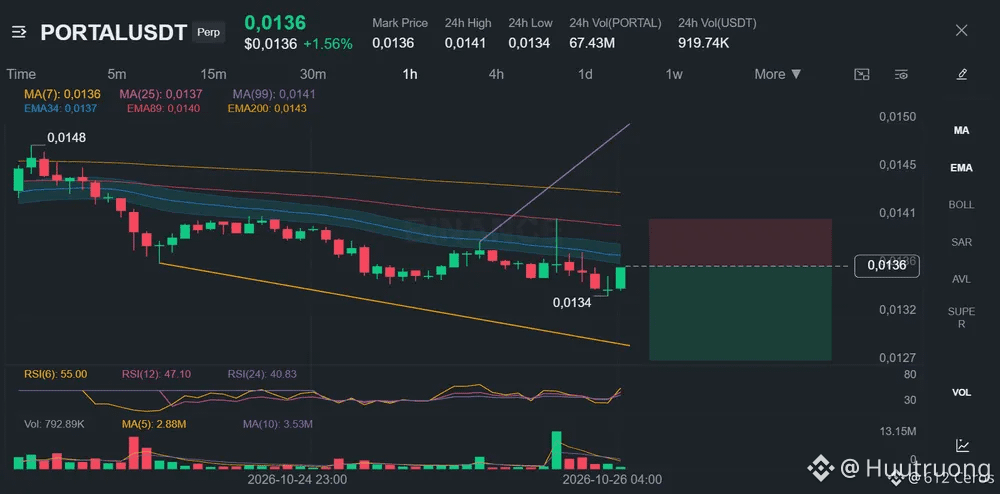
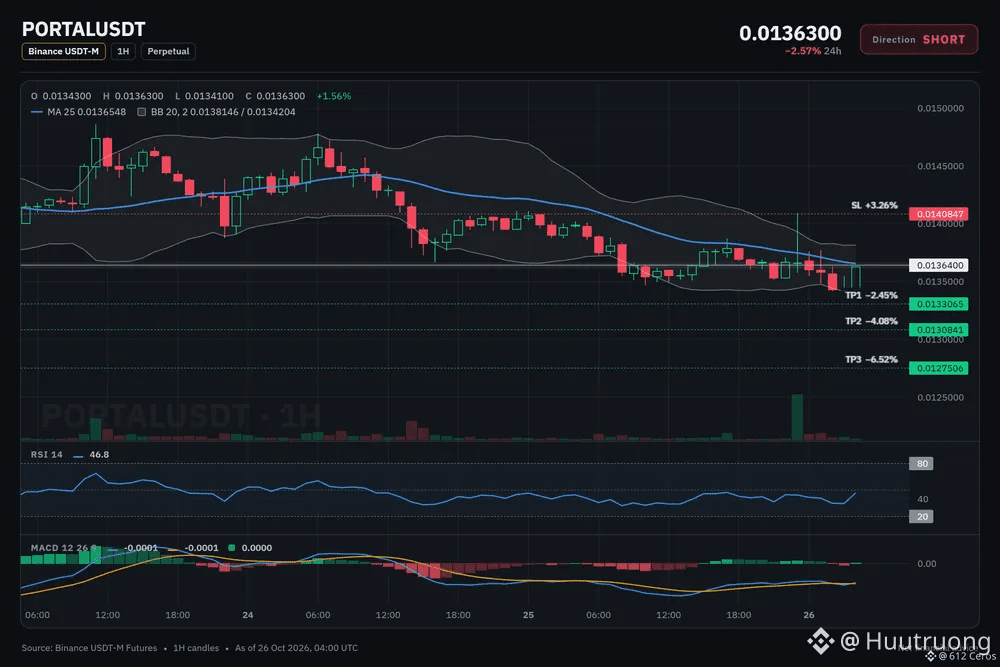
PORTAL short setup: the levels I'm watching
🔴 SHORT $PORTAL /USDT: expecting price to go DOWN
Bias: SHORT · Leaning
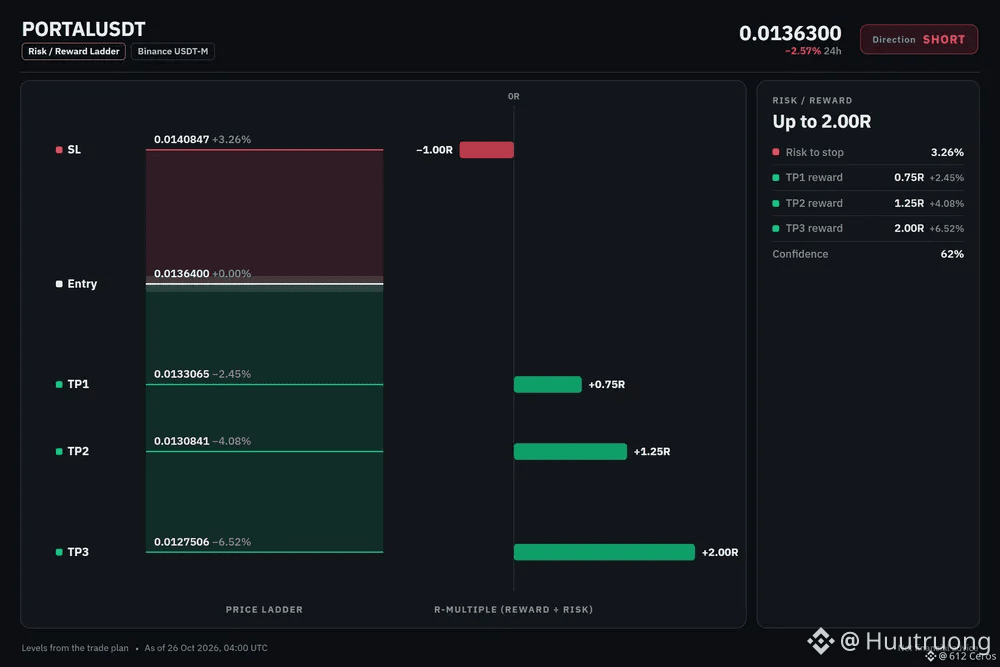
Entry: 0.0136135 – 0.0136665
TP1: 0.0133065 (-2.4%)
TP2: 0.0130841 (-4.1%)
TP3: 0.0127506 (-6.5%)
SL: 0.0140847 (+3.3%)
Plan: enter only inside the zone, close 50% at TP1, 25% at TP2, 25% at TP3, and move the stop to entry after TP1.
Note: moderate conviction only, keep size light.
Why SHORT? 4/12 signals agree, 1 against.
• 4h trend down (below EMA50 & EMA200)
• 1h trend down (below EMA50 & EMA200)
• Sellers have the momentum (4h RSI 34.9)
Risk: Buyers are pushing right now (+0.74% 15m candle)
In plain words:
The daily trend reads range, and 4/12 signals aligned favour the short side. The plan is to work the 0.0136135 – 0.0136665 zone, scale out at 0.0133065 and 0.0130841, and stay patient for 0.0127506. A move through 0.0140847 means the idea is wrong and the stop does its job.
Does PORTAL tag 0.0133065 first, or the stop?
·
--
看漲
查看翻譯
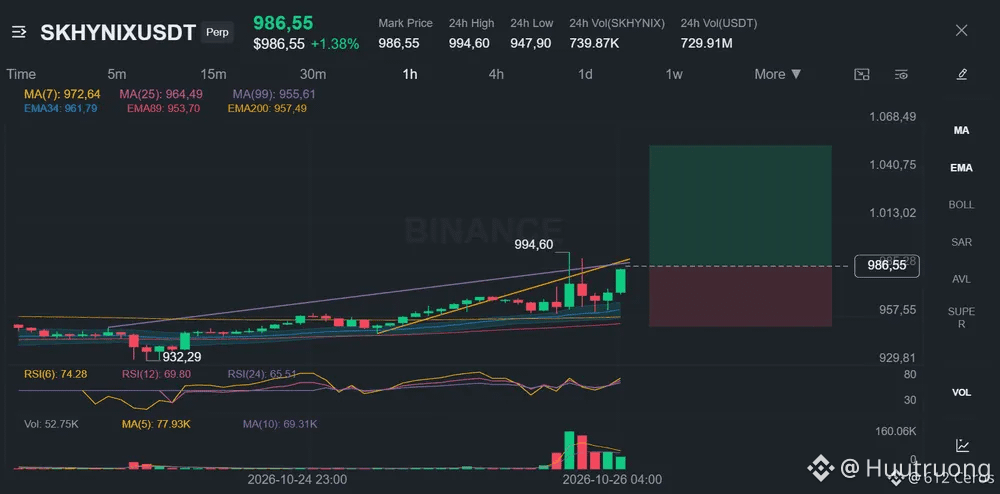
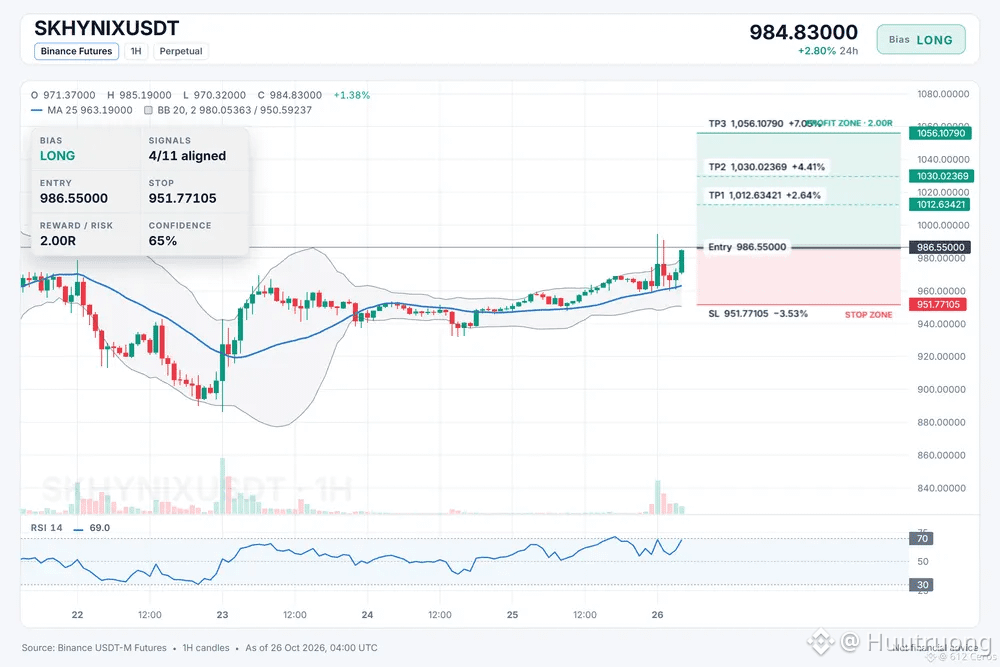
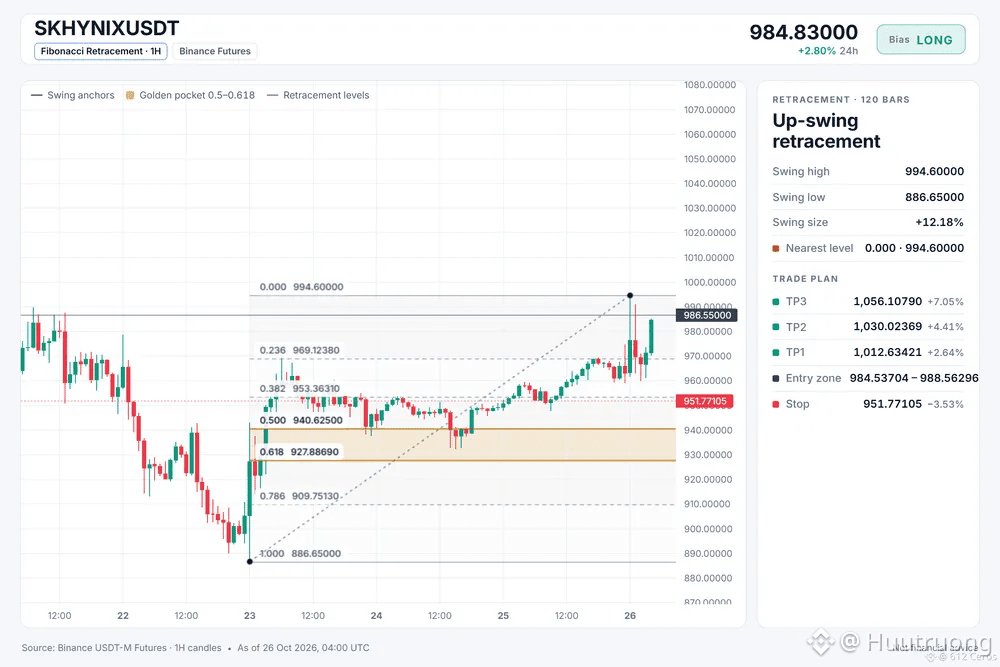
SKHYNIX looks stretched above its 1h EMA stack
🟢 LONG $SKHYNIX /USDT: expecting price to go UP
Bias: LONG · Leaning
Entry: 984.53704 – 988.56296
TP1: 1012.63421 (+2.6%)
TP2: 1030.02369 (+4.4%)
TP3: 1056.10790 (+7.1%)
SL: 951.77105 (-3.5%)
Plan: enter only inside the zone, close 50% at TP1, 25% at TP2, 25% at TP3, and move the stop to entry after TP1.
Note: moderate conviction only, keep size light.
Why LONG? 4/11 signals agree, 0 against.
• 1h trend up (above EMA50 & EMA200)
• Buyers have the momentum (4h RSI 59.1)
• Buyers have the momentum (1h RSI 69.0)
Bull path:
If the 1h trend holds above the EMA200, price could reach the first target, where the 1h RSI shows buyers still have momentum.
What kills it:
If price breaks the stop loss at the entry low, the daily range regime likely means this setup was wrong, so I would exit.
Where do you set your invalidation for this trade?
·
--
看跌
查看翻譯
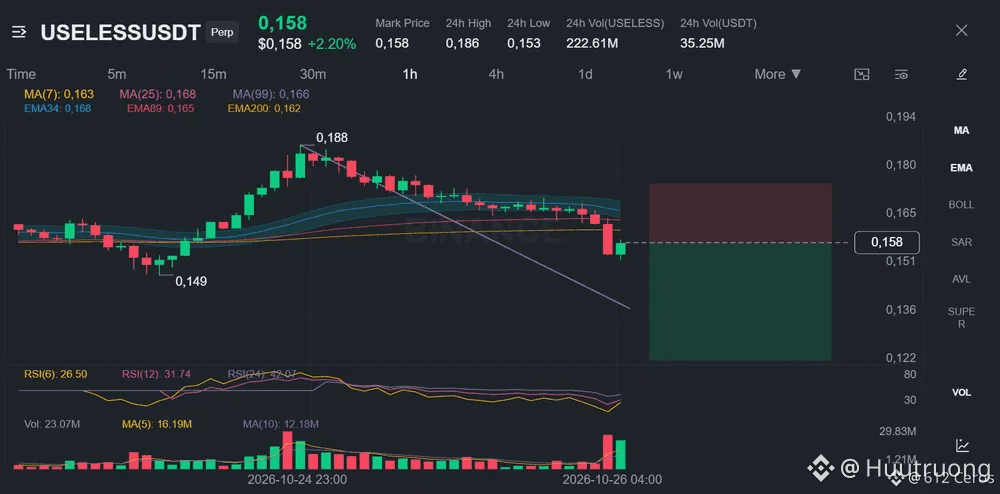
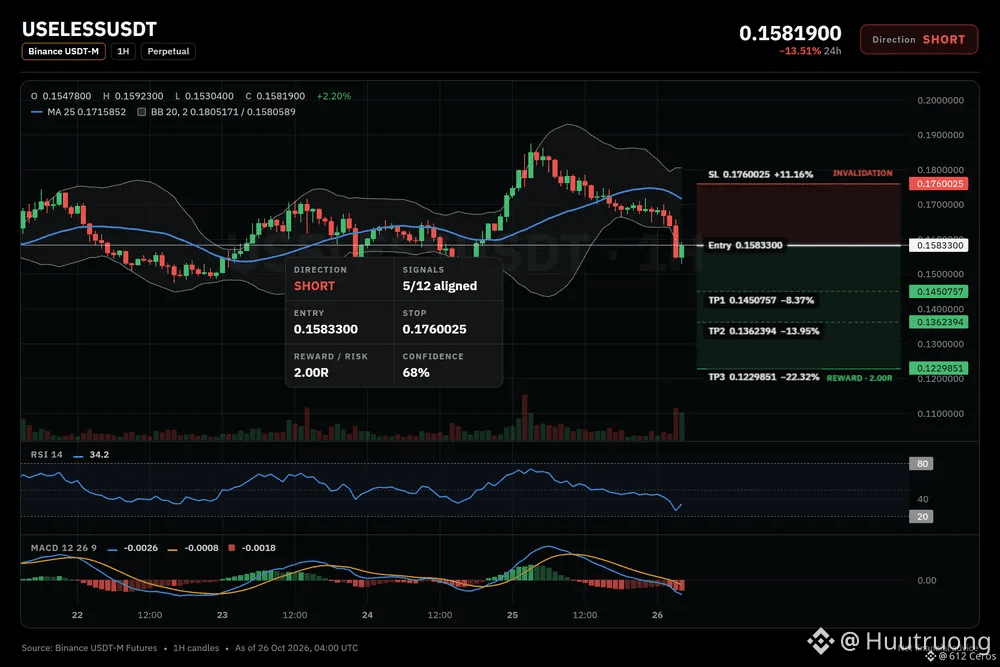
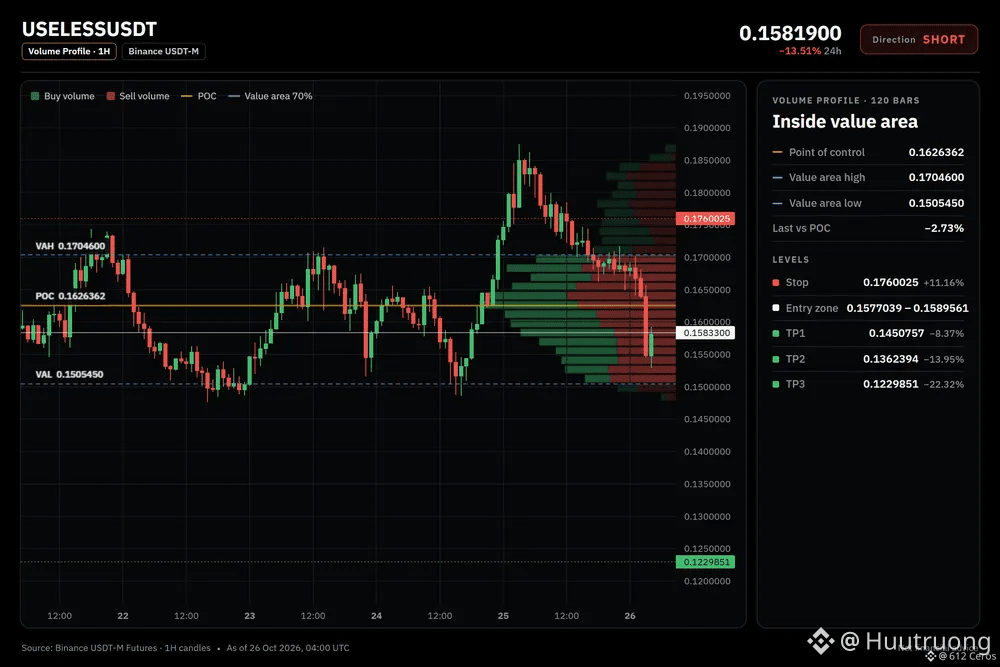
USELESS is grinding below its moving averages
🔴 SHORT $USELESS /USDT: expecting price to go DOWN
Bias: SHORT · Leaning
Entry: 0.1577039 – 0.1589561
TP1: 0.1450757 (-8.4%)
TP2: 0.1362394 (-14.0%)
TP3: 0.1229851 (-22.3%)
SL: 0.1760025 (+11.2%)
Plan: enter only inside the zone, close 50% at TP1, 25% at TP2, 25% at TP3, and move the stop to entry after TP1.
Note: moderate conviction only, keep size light.
Why SHORT? 5/12 signals agree, 0 against.
• 4h trend down (below EMA50 & EMA200)
• Sellers are driving the move (15m ADX 37.1)
• Sellers have the momentum (4h RSI 43.4)
Q: Why short when the daily trend is range?
A: The 4h chart shows a bearish stack with price below both EMAs.
Q: When is this setup wrong?
A: If price holds above 0.1760025 the short thesis fails.
What is your invalidation level for this trade?
·
--
看跌
查看翻譯
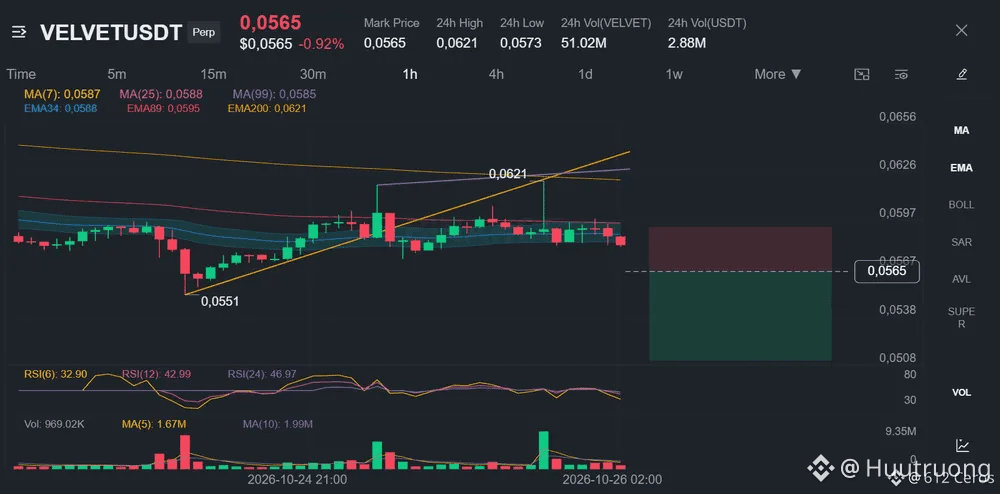
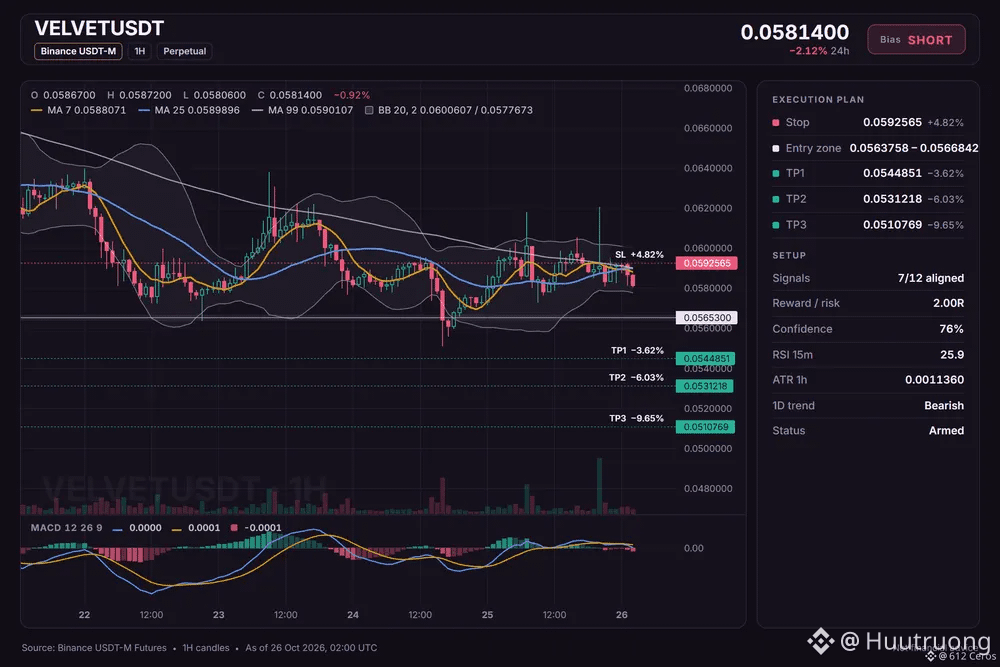
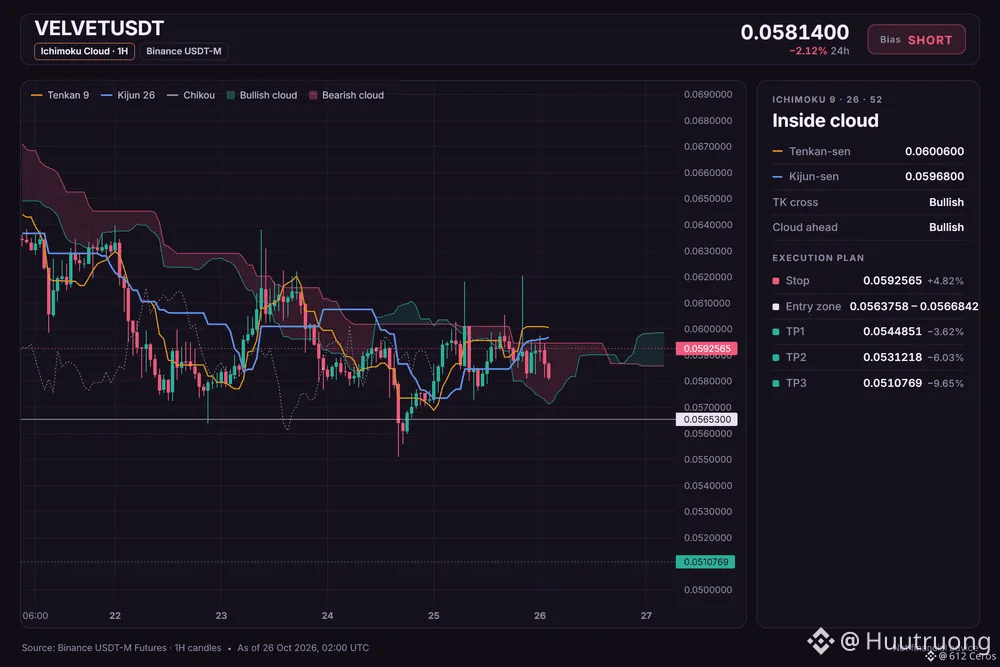
VELVET short setup: the levels I'm watching
🔴 SHORT $VELVET /USDT: expecting price to go DOWN
Bias: SHORT · Strong
Entry: 0.0563758 – 0.0566842
TP1: 0.0544851 (-3.6%)
TP2: 0.0531218 (-6.0%)
TP3: 0.0510769 (-9.6%)
SL: 0.0592565 (+4.8%)
Plan: enter only inside the zone, close 50% at TP1, 25% at TP2, 25% at TP3, and move the stop to entry after TP1.
Why SHORT? 7/12 signals agree, 1 against.
• Daily trend down (below EMA50 & EMA200)
• 4h trend down (below EMA50 & EMA200)
• 1h trend down (below EMA50 & EMA200)
Risk: Range bottom, buyers often step in (RSI z −2.72)
In plain words:
The daily trend reads bearish, and 7/12 signals aligned favour the short side. The plan is to work the 0.0563758 – 0.0566842 zone, scale out at 0.0544851 and 0.0531218, and stay patient for 0.0510769. A move through 0.0592565 means the idea is wrong and the stop does its job.
Does VELVET tag 0.0544851 first, or the stop?
·
--
看跌
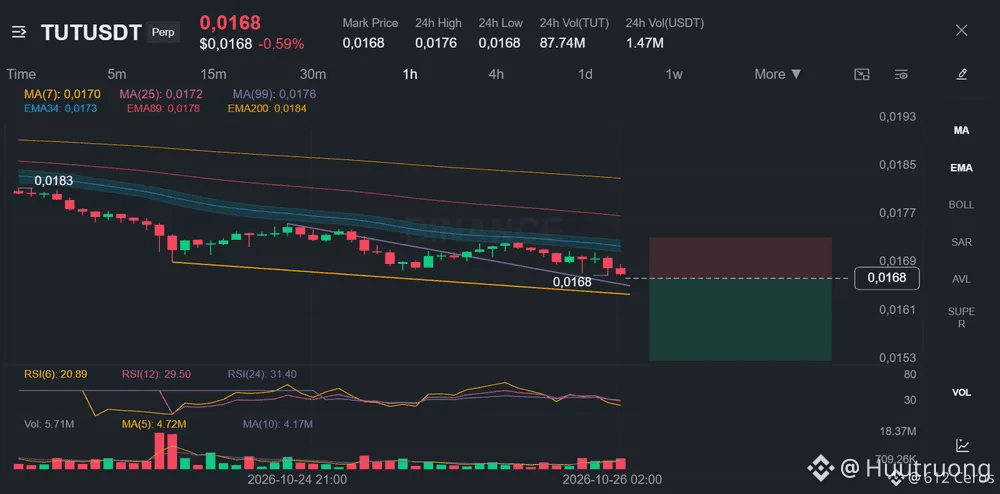
TUT 在兩個時間框架中都持續徘徊於兩條 EMA 下方。
🔴 做空 $TUT /USDT:預期價格將下跌
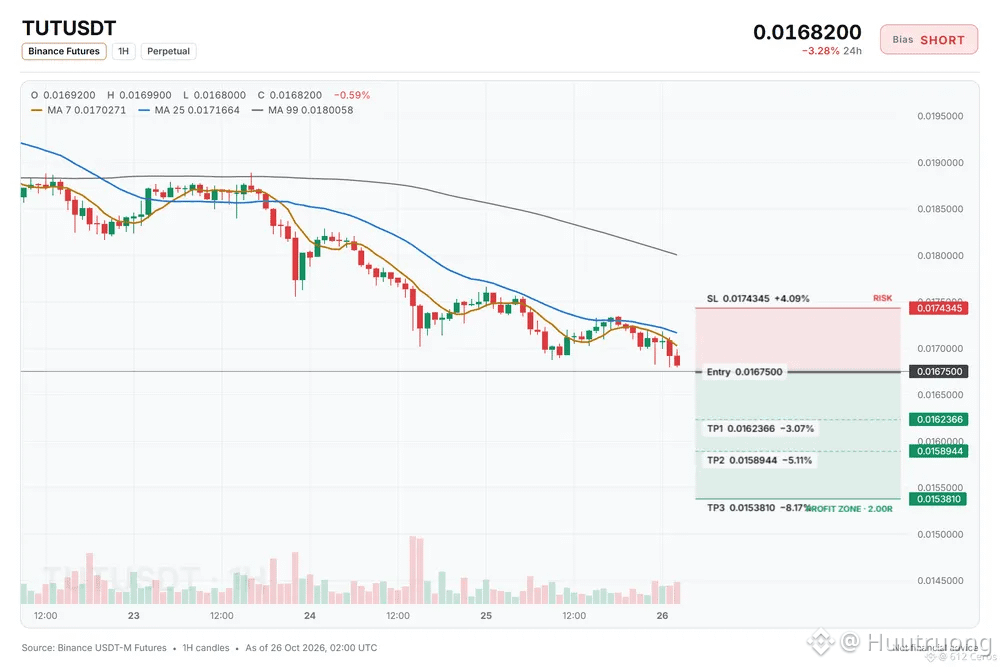
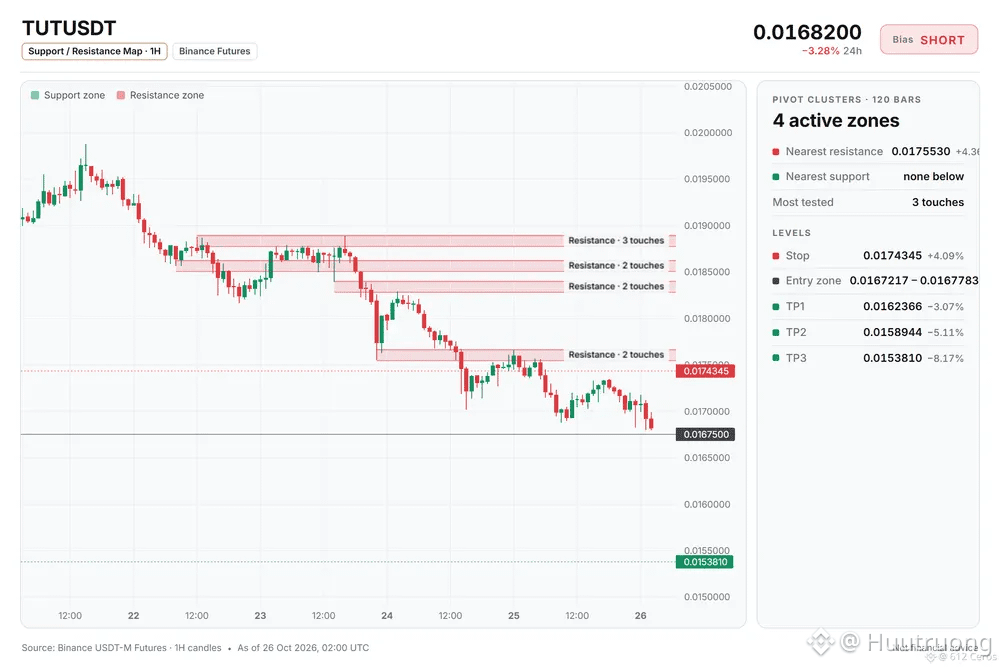
偏向:做空 · 強
進場:0.0167217 – 0.0167783
TP1:0.0162366(-3.1%)
TP2:0.0158944(-5.1%)
TP3:0.0153810(-8.2%)
SL:0.0174345(+4.1%)
計畫:只在區間內進場,TP1 平倉 50%,TP2 平倉 25%,TP3 平倉 25%,並在 TP1 後將止損移至進場價。
為什麼做空?檢查清單:8/12 項同意,1 項反對。
• 4 小時趨勢向下(低於 EMA50 和 EMA200)
• 1 小時趨勢向下(低於 EMA50 和 EMA200)
• 賣方正主導走勢(15 分鐘 ADX 34.4)
注意:價格遠低於均值,可能反彈(低於 1 小時 EMA50 3.7 ATR)
注意:若價格觸及 0.0174345 的止損價,這個交易想法就不成立
總結:4 小時看跌均線排列與強勁的賣方動能支持做空,但價格已低於 1 小時 EMA50 達 3.7 ATR,因此可能出現反彈。
你會把做空進場點設在哪裡?
·
--
看跌
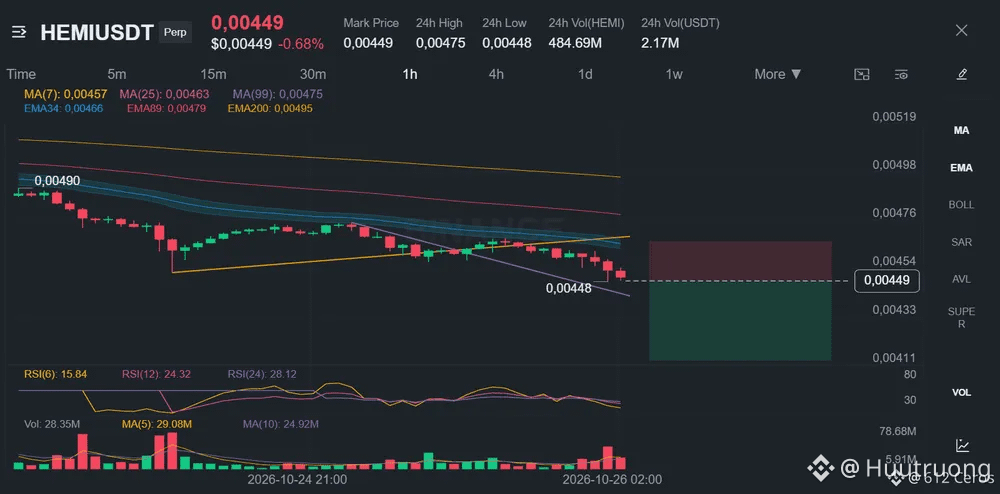
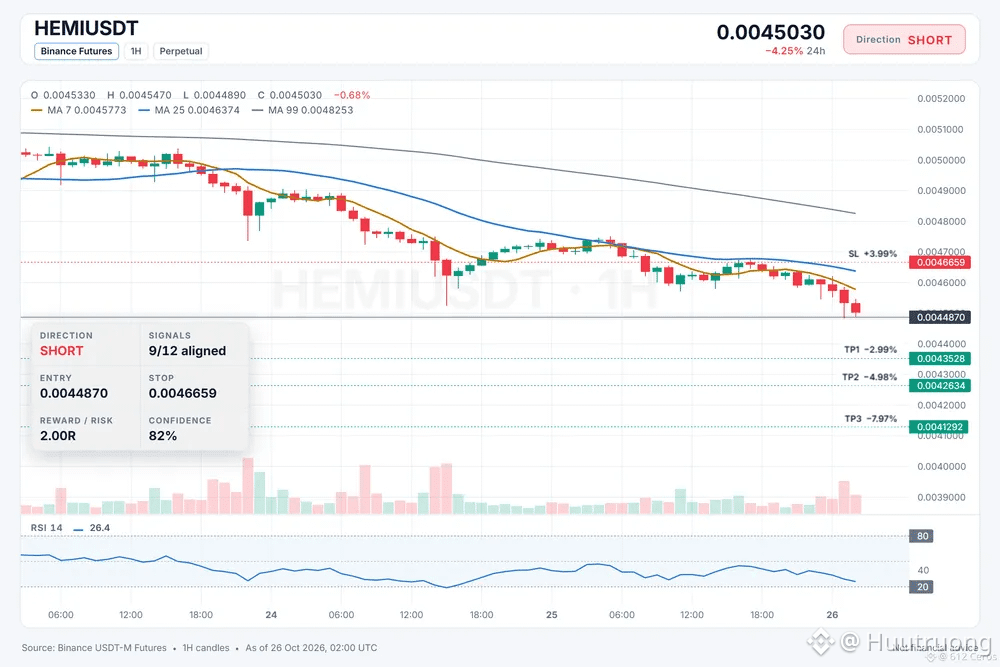
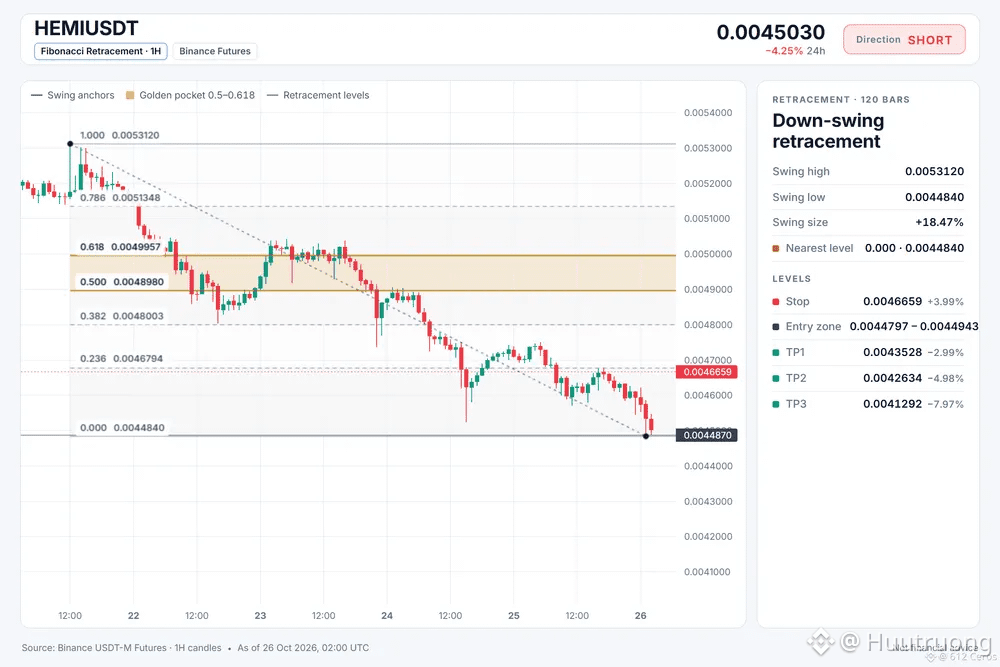
HEMI 正在多個時間週期的看跌訊號交疊下持續走低。
🔴 做空 $HEMI /USDT:預期價格將下跌
方向:做空 · 強
進場:0.0044797 – 0.0044943
TP1:0.0043528 (-3.0%)
TP2:0.0042634 (-5.0%)
TP3:0.0041292 (-8.0%)
SL:0.0046659 (+4.0%)
計畫:僅在區間內進場,於 TP1 平倉 50%、TP2 平倉 25%、TP3 平倉 25%,並在 TP1 後將停損移至進場價。
為什麼做空?12 個訊號中有 9 個一致,1 個相反。
• 日線趨勢向下(低於 EMA50 與 EMA200)
• 4 小時趨勢向下(低於 EMA50 與 EMA200)
• 1 小時趨勢向下(低於 EMA50 與 EMA200)
風險:遠低於均值,可能反彈(距離 1 小時 EMA50 有 −4.2 ATR)
看跌走勢:
如果這個判斷成立,價格應會繼續下滑至 1 小時 EMA50 附近,確認看跌動能。
什麼情況會讓這個判斷失效:
若價格反彈並突破進場價,做空判斷便會失效,也代表賣方已經力竭。
你認為 HEMI 會先在哪裡遇到阻力?
·
--
看跌
查看翻譯
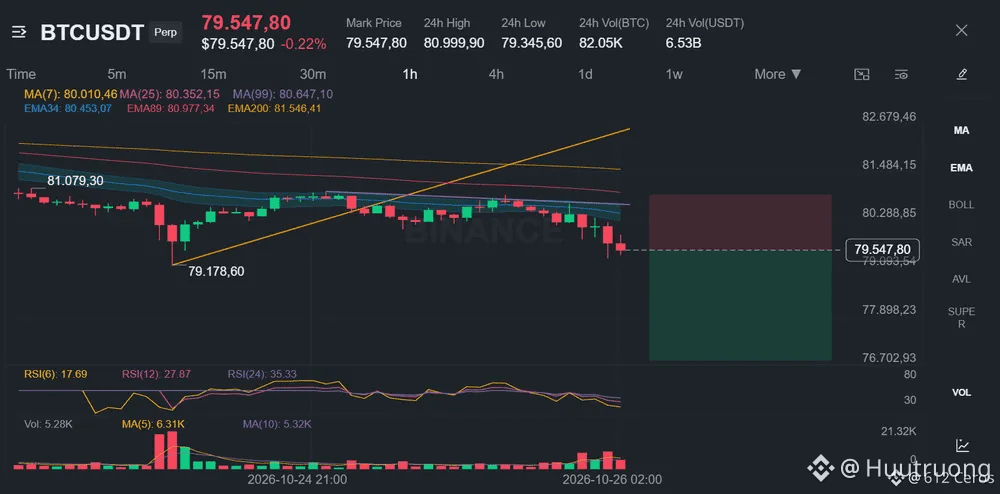
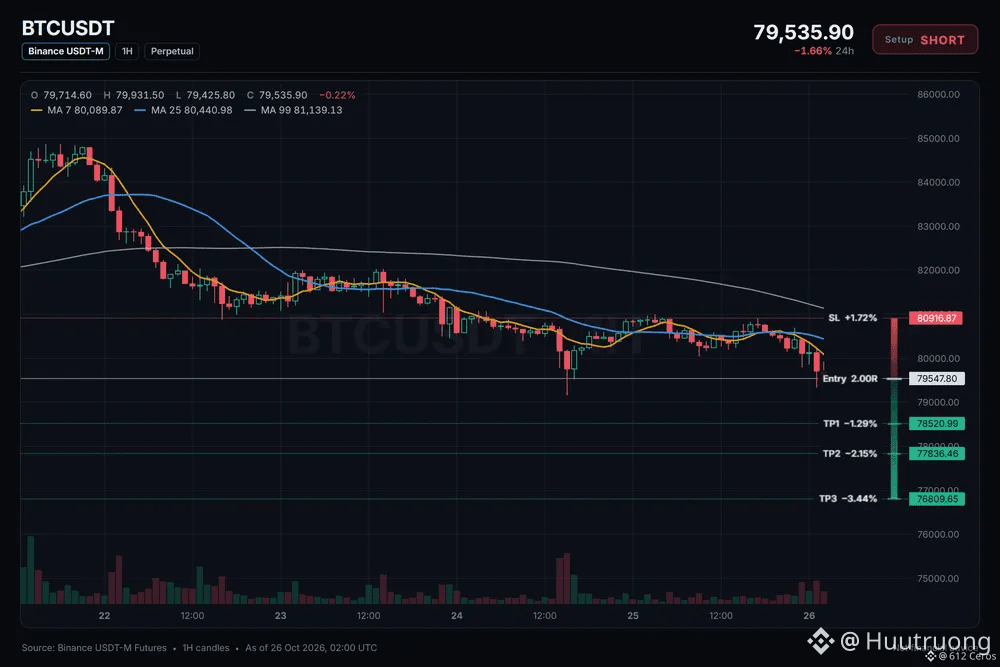
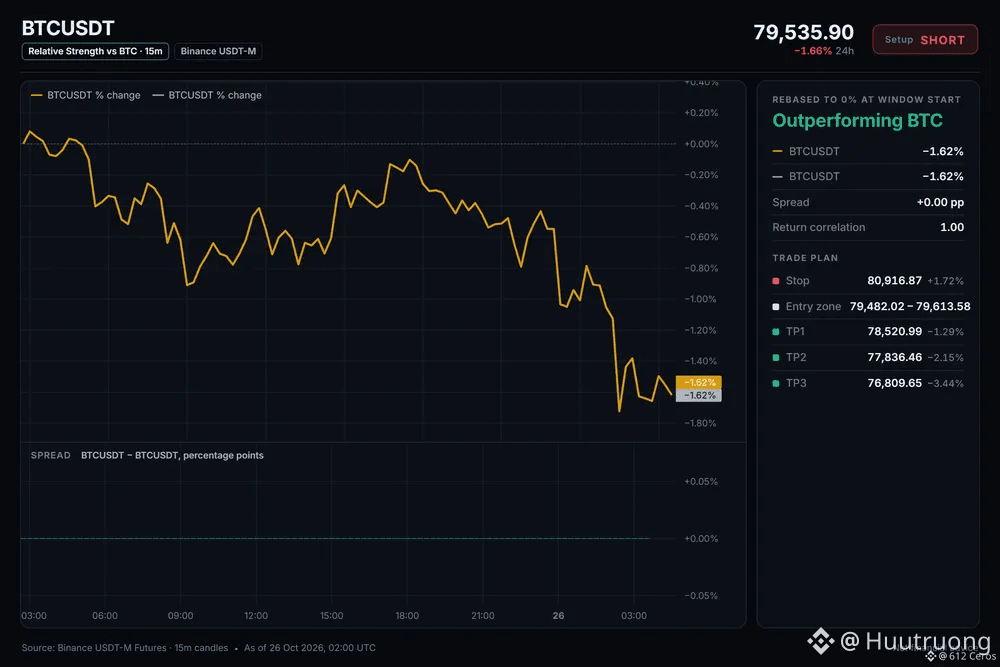
Liệu BTC có thể tiếp tục giảm xuống trong vùng giảm giá 4 giờ không?
🔴 BÁN KHỐNG $BTC /USDT: dự đoán giá sẽ GIẢM.
Xu hướng: BÁN KHỐNG · Điểm vào lệnh mạnh
: 79482.02 – 79613.58
TP1: 78520.99 (-1.3%)
TP2: 77836.46 (-2.2%)
TP3: 76809.65 (-3.4%)
SL: 80916.87 (+1.7%)
Kế hoạch: chỉ vào lệnh trong vùng này, chốt lời 50% tại TP1, 25% tại TP2, 25% tại TP3, và di chuyển điểm dừng lỗ về điểm vào lệnh sau TP1.
Tại sao BÁN KHỐNG? 6/12 tín hiệu đồng ý, 0 tín hiệu phản đối.
• Xu hướng giảm trên biểu đồ 4 giờ (dưới EMA50 & EMA200)
• Xu hướng giảm trên biểu đồ 1 giờ (dưới EMA50 & EMA200)
• Người bán đang đẩy giá xuống (ADX 15 phút ở mức 33.3)
Tại sao lại là bây giờ?
Xu hướng 4 giờ cho thấy giá nằm dưới cả EMA 50 và 200, với người bán đang đẩy giá xuống khi ADX ở mức 33.3 và RSI 1 giờ ở mức 30.2. Xu hướng hàng ngày đang đi ngang và bối cảnh BTC đang giảm, vì vậy thiết lập lệnh bán phù hợp với động lượng chung. Cửa sổ vào lệnh là từ 79482.02 đến 79613.58.
Bạn sẽ đặt điểm hủy lệnh ở đâu nếu bạn thực hiện lệnh bán này?
登入以探索更多內容
加入幣安廣場中的全球加密貨幣用戶
⚡️ 獲取加密貨幣的最新和實用資訊。
💬 受到全球最大加密貨幣交易所的信任。
👍 發掘來自經過驗證創作者的真實見解。
電子郵件 / 電話號碼