

#liquidationmap
liquidationmap
397,639 次浏览
823 人讨论中
热门
最新内容

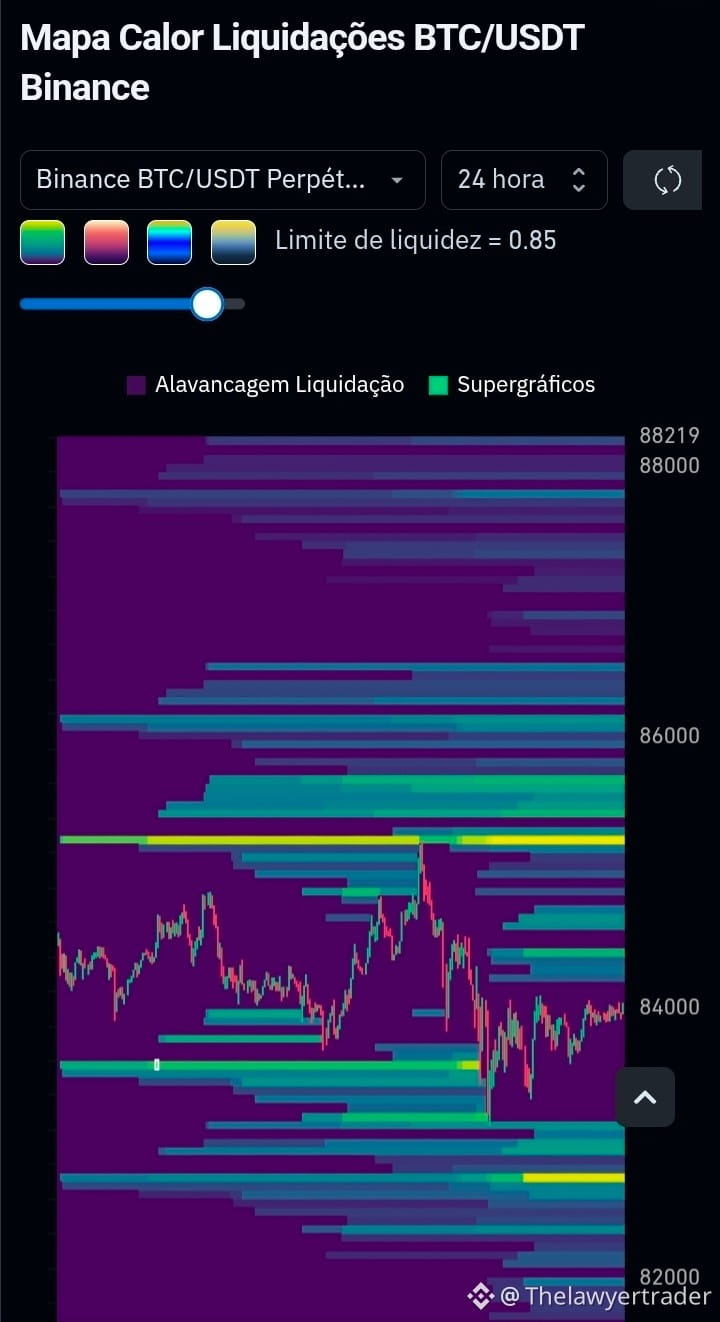
BTC/USDT — 流动性分析(24小时)
价格目前在 84,000 附近区间内盘整,被两处重要流动性区域所夹持。
关注区域:
阻力:~85,000 – 85,500(价格上方的高密度流动性)
支撑:~83,000(下方订单的堆积)
图表解读:
没有明显形成经典图形模式(如三角形、头肩顶/底)。目前可见的是在流动性区域之间的整固——这是一种在确定方向之前常见的行为。
概率(估计):
在明确方向之前先测试 85,000 区域:较高(~65%)
在 85,500 上方实现持续突破:中等(~40%)
跌破 83,000 支撑:低-中等(~30%)
结论:
市场往往会“寻求”已累积的流动性。最可能的情景是先测试 85,000 阻力,然后在该动作之后做出方向选择。等待成交量确认后再进场。
⚠️ 信息性分析,不构成投资建议。加密资产波动性较高。
#liquidationmap #liquidez
BTC/USDT — 流动性分析(24小时)
价格目前在 84,000 附近区间内盘整,被两处重要流动性区域所夹持。
关注区域:
阻力:~85,000 – 85,500(价格上方的高密度流动性)
支撑:~83,000(下方订单的堆积)
图表解读:
没有明显形成经典图形模式(如三角形、头肩顶/底)。目前可见的是在流动性区域之间的整固——这是一种在确定方向之前常见的行为。
概率(估计):
在明确方向之前先测试 85,000 区域:较高(~65%)
在 85,500 上方实现持续突破:中等(~40%)
跌破 83,000 支撑:低-中等(~30%)
结论:
市场往往会“寻求”已累积的流动性。最可能的情景是先测试 85,000 阻力,然后在该动作之后做出方向选择。等待成交量确认后再进场。
⚠️ 信息性分析,不构成投资建议。加密资产波动性较高。
#liquidationmap #liquidez
价格目前在 84,000 附近区间内盘整,被两处重要流动性区域所夹持。
关注区域:
阻力:~85,000 – 85,500(价格上方的高密度流动性)
支撑:~83,000(下方订单的堆积)
图表解读:
没有明显形成经典图形模式(如三角形、头肩顶/底)。目前可见的是在流动性区域之间的整固——这是一种在确定方向之前常见的行为。
概率(估计):
在明确方向之前先测试 85,000 区域:较高(~65%)
在 85,500 上方实现持续突破:中等(~40%)
跌破 83,000 支撑:低-中等(~30%)
结论:
市场往往会“寻求”已累积的流动性。最可能的情景是先测试 85,000 阻力,然后在该动作之后做出方向选择。等待成交量确认后再进场。
⚠️ 信息性分析,不构成投资建议。加密资产波动性较高。
#liquidationmap #liquidez
Giovanna Truden xNFM:
Bitcoin irá cair aos 71 K
2
236

·
--
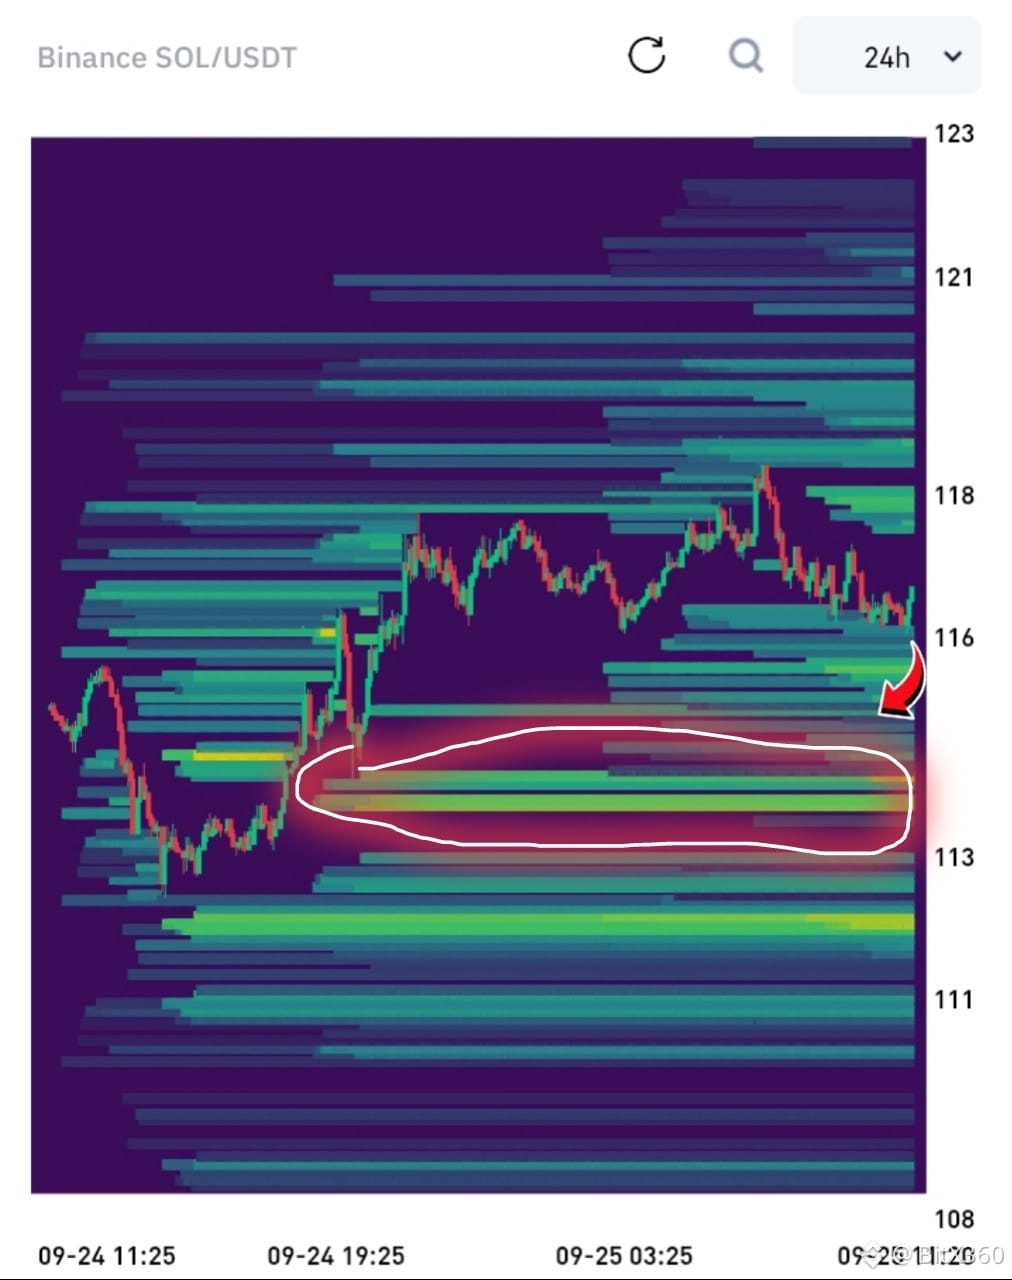
$SOL liquidation 地图刚刚暴露:一切都显示得很清楚。最重的流动性集中在 113-115 这一带。这是最大的多头清算区域。如果价格跌入该区域,将会有大量多头仓位被清算出局。118-121 之间也叠着空头流动性。
但真正的密度与强度,显然在更下方。
只剩两条路:
要么去猎杀下方的多头;
要么向上推进,清算空头。
市场马上就要做决定了。
{future}(SOLUSDT)
#SOL #LiquidationMap #Crypto
$SOL liquidation 地图刚刚暴露:一切都显示得很清楚。最重的流动性集中在 113-115 这一带。这是最大的多头清算区域。如果价格跌入该区域,将会有大量多头仓位被清算出局。118-121 之间也叠着空头流动性。
但真正的密度与强度,显然在更下方。
只剩两条路:
要么去猎杀下方的多头;
要么向上推进,清算空头。
市场马上就要做决定了。
#SOL #LiquidationMap #Crypto
但真正的密度与强度,显然在更下方。
只剩两条路:
要么去猎杀下方的多头;
要么向上推进,清算空头。
市场马上就要做决定了。
#SOL #LiquidationMap #Crypto
3
206

💣$BTC
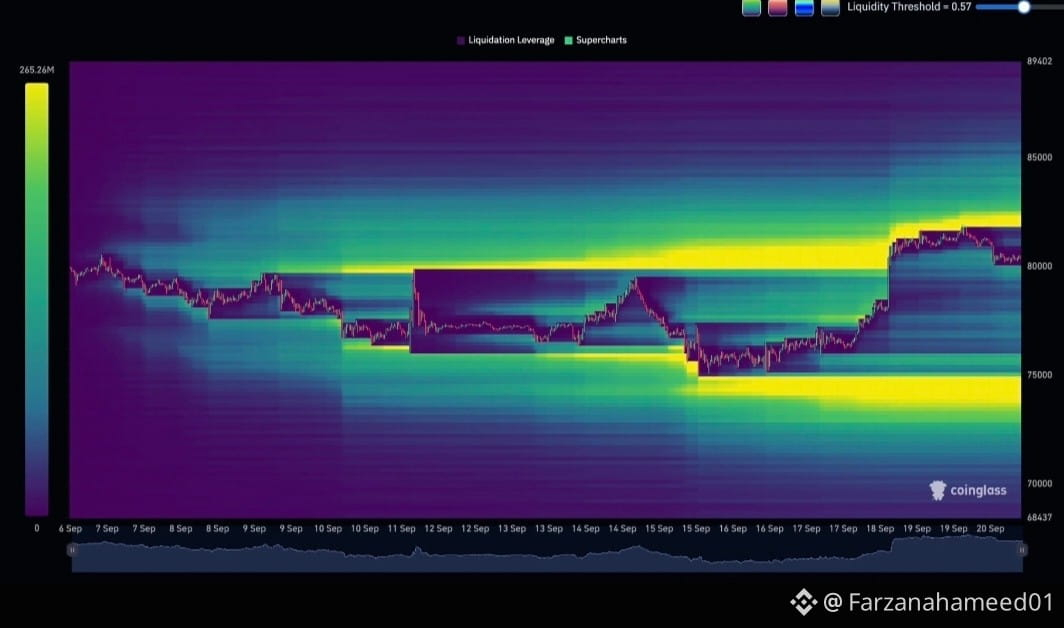
比特币清算陷阱已触发!先到 75K 还是 83K?👀
BTC 清算热力图显示双方都有巨量流动性!
83K 的重度黄色区域(做空清算)和 75K 的重度黄色区域(做多清算)。
比特币总是会去“猎取”流动性。问题是,先被猎的是哪一边?
我的倾向:83K 会先触及以抓取流动性,然后迅速反转回 75K。先拉升再出货。
你认为先会打到哪里?
A) 83K
B) 75K
在下面留下你的预测 👇
非财务建议。
#BTC #Bitcoin #Crypto #LiquidationMap #cryptotrading
💣$BTC
比特币清算陷阱已触发!先到 75K 还是 83K?👀
BTC 清算热力图显示双方都有巨量流动性!
83K 的重度黄色区域(做空清算)和 75K 的重度黄色区域(做多清算)。
比特币总是会去“猎取”流动性。问题是,先被猎的是哪一边?
我的倾向:83K 会先触及以抓取流动性,然后迅速反转回 75K。先拉升再出货。
你认为先会打到哪里?
A) 83K
B) 75K
在下面留下你的预测 👇
非财务建议。
#BTC #Bitcoin #Crypto #LiquidationMap #cryptotrading
比特币清算陷阱已触发!先到 75K 还是 83K?👀
BTC 清算热力图显示双方都有巨量流动性!
83K 的重度黄色区域(做空清算)和 75K 的重度黄色区域(做多清算)。
比特币总是会去“猎取”流动性。问题是,先被猎的是哪一边?
我的倾向:83K 会先触及以抓取流动性,然后迅速反转回 75K。先拉升再出货。
你认为先会打到哪里?
A) 83K
B) 75K
在下面留下你的预测 👇
非财务建议。
#BTC #Bitcoin #Crypto #LiquidationMap #cryptotrading
1
1
108

#liquidationmap
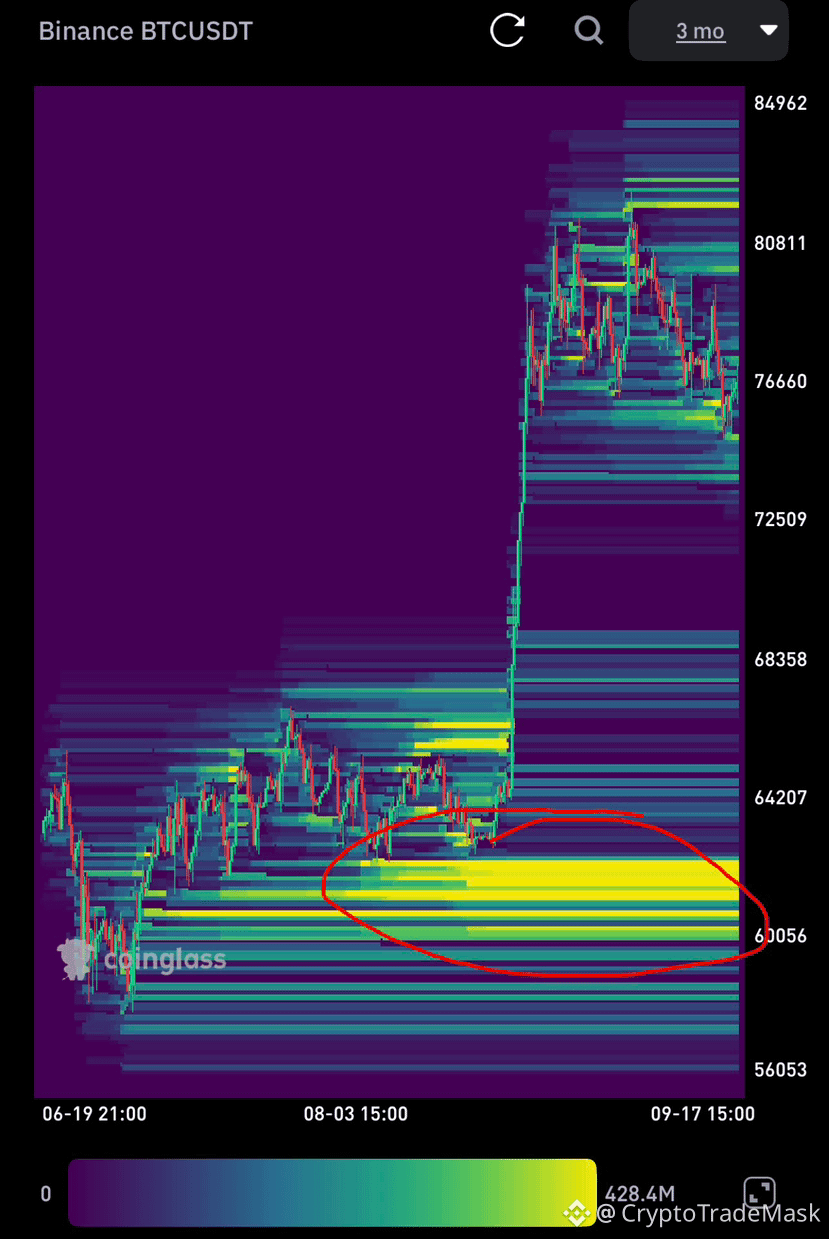
🚀 $BTC /USDT 市场分析:做市商在计划什么?
目前,$BTC 图表上正在形成一个非常有趣的结构。一方面,我们看到坚实的盘整;另一方面,清算地图几乎在为大玩家“闪烁着可口的机会池”。
📊 指标显示了什么?
技术面:价格被压缩在 76,000 – 77,200 美元区间内。移动均线(EMA 5/10/30)紧密缠绕——这是突破前累积动能的经典信号。
未平仓量(OI):维持在高位(约 108K–109K BTC)。交易者继续在双边建仓,等待突破。
清算地图(热力图):
上行:80,000 – 82,000 区域,空头止损有中等程度的累积。
下行:60,000 – 62,000 的巨大“金矿”聚集(流动性超过 4 亿美元)。
🎯 价格会朝下方集群(60k)走吗?
就目前而言——不太可能。下跌 20% 需要强有力的基本面触发因素,或发生连锁式抛售。做市商更偏好顺势而为、阻力最小的路径。
主要情景:
1. 局部流动性扫荡:在 74,900 – 75,500 区域进行快速止损扫盘。
2. 上行突破:上冲至 80,000 – 82,000 区间,用于覆盖目标空头仓位。
3. 全局回调:只有在确立明确的高点之后,并且散户买家在高位被吸引做多,市场才可能为向 60,000–62,000 区间的深度回撤做好准备。
⚠️ 总结:不要急于“梭哈”做空,押注眼下就会到 60k。最可能的情况是,做市商会先扫掉局部高点,然后才触发大规模的市场抛售清洗。
{future}(BTCUSDT)
#liquidationmap
🚀 $BTC /USDT 市场分析:做市商在计划什么?
目前,$BTC 图表上正在形成一个非常有趣的结构。一方面,我们看到坚实的盘整;另一方面,清算地图几乎在为大玩家“闪烁着可口的机会池”。
📊 指标显示了什么?
技术面:价格被压缩在 76,000 – 77,200 美元区间内。移动均线(EMA 5/10/30)紧密缠绕——这是突破前累积动能的经典信号。
未平仓量(OI):维持在高位(约 108K–109K BTC)。交易者继续在双边建仓,等待突破。
清算地图(热力图):
上行:80,000 – 82,000 区域,空头止损有中等程度的累积。
下行:60,000 – 62,000 的巨大“金矿”聚集(流动性超过 4 亿美元)。
🎯 价格会朝下方集群(60k)走吗?
就目前而言——不太可能。下跌 20% 需要强有力的基本面触发因素,或发生连锁式抛售。做市商更偏好顺势而为、阻力最小的路径。
主要情景:
1. 局部流动性扫荡:在 74,900 – 75,500 区域进行快速止损扫盘。
2. 上行突破:上冲至 80,000 – 82,000 区间,用于覆盖目标空头仓位。
3. 全局回调:只有在确立明确的高点之后,并且散户买家在高位被吸引做多,市场才可能为向 60,000–62,000 区间的深度回撤做好准备。
⚠️ 总结:不要急于“梭哈”做空,押注眼下就会到 60k。最可能的情况是,做市商会先扫掉局部高点,然后才触发大规模的市场抛售清洗。
🚀 $BTC /USDT 市场分析:做市商在计划什么?
目前,$BTC 图表上正在形成一个非常有趣的结构。一方面,我们看到坚实的盘整;另一方面,清算地图几乎在为大玩家“闪烁着可口的机会池”。
📊 指标显示了什么?
技术面:价格被压缩在 76,000 – 77,200 美元区间内。移动均线(EMA 5/10/30)紧密缠绕——这是突破前累积动能的经典信号。
未平仓量(OI):维持在高位(约 108K–109K BTC)。交易者继续在双边建仓,等待突破。
清算地图(热力图):
上行:80,000 – 82,000 区域,空头止损有中等程度的累积。
下行:60,000 – 62,000 的巨大“金矿”聚集(流动性超过 4 亿美元)。
🎯 价格会朝下方集群(60k)走吗?
就目前而言——不太可能。下跌 20% 需要强有力的基本面触发因素,或发生连锁式抛售。做市商更偏好顺势而为、阻力最小的路径。
主要情景:
1. 局部流动性扫荡:在 74,900 – 75,500 区域进行快速止损扫盘。
2. 上行突破:上冲至 80,000 – 82,000 区间,用于覆盖目标空头仓位。
3. 全局回调:只有在确立明确的高点之后,并且散户买家在高位被吸引做多,市场才可能为向 60,000–62,000 区间的深度回撤做好准备。
⚠️ 总结:不要急于“梭哈”做空,押注眼下就会到 60k。最可能的情况是,做市商会先扫掉局部高点,然后才触发大规模的市场抛售清洗。
37

🚨 更新比特币(BTC)清算地图
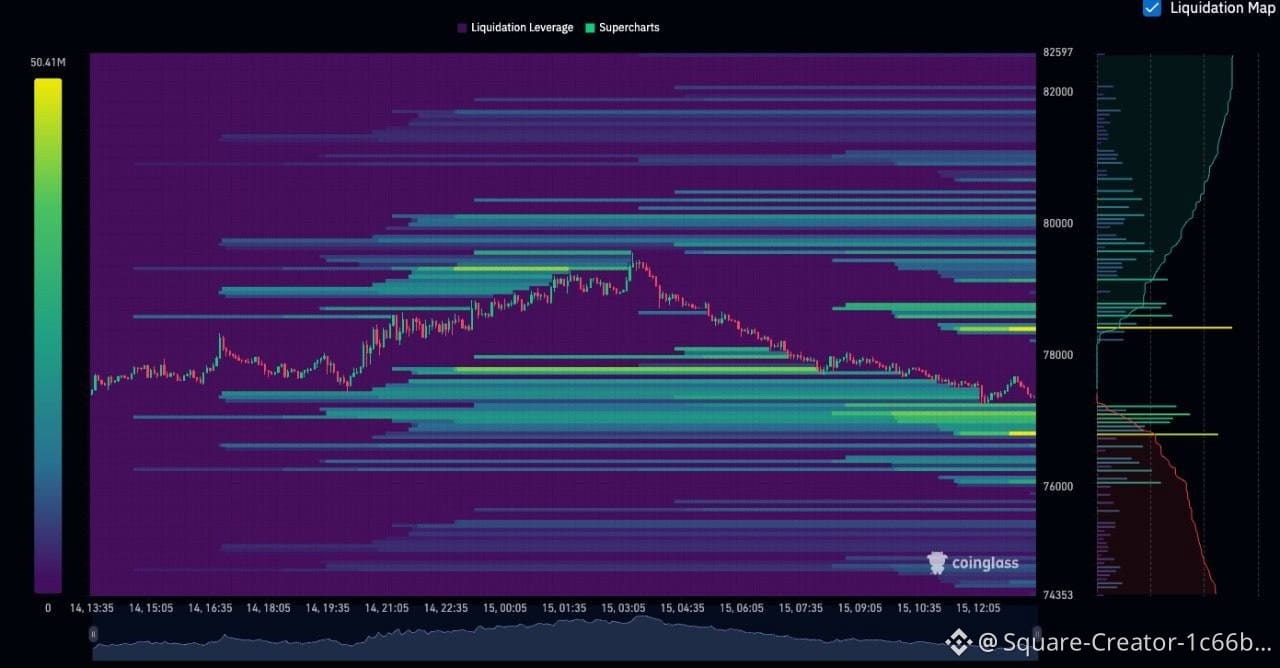
目前,比特币正交易于约 77,000 美元附近,且流动性在价格两侧呈现明显的集中。
🔼 上行方向的流动性 • 78,800 – 79,500 美元:强劲流动性块
• 高于 80,000 美元:更高价格上方的新增流动性
🔽 下行方向的流动性 • 76,500 – 77,000 美元:接近且重要的流动性区域
• 75,000 – 76,000 美元:更深层的流动性区域
📌 关键水平:BTC 需要重新站上 78,000 美元,以支撑其可能向上流动性区域的走势。若跌破 76,500 美元,价格转向测试下方后续流动性区域的概率可能会增加。
⚠️ 清算地图反映了可能的流动性聚集区域,并不保证价格一定按某方向运行。做出任何决策前,请观察交易量、动能以及整体市场走势。
$BTC
{future}(BTCUSDT)
#BTC #Bitcoin #LiquidationMap #Crypto #CryptoTrading #تحليل_فني #比特币 #数字货币 #交易 #加密市场
🚨 更新比特币(BTC)清算地图
目前,比特币正交易于约 77,000 美元附近,且流动性在价格两侧呈现明显的集中。
🔼 上行方向的流动性 • 78,800 – 79,500 美元:强劲流动性块
• 高于 80,000 美元:更高价格上方的新增流动性
🔽 下行方向的流动性 • 76,500 – 77,000 美元:接近且重要的流动性区域
• 75,000 – 76,000 美元:更深层的流动性区域
📌 关键水平:BTC 需要重新站上 78,000 美元,以支撑其可能向上流动性区域的走势。若跌破 76,500 美元,价格转向测试下方后续流动性区域的概率可能会增加。
⚠️ 清算地图反映了可能的流动性聚集区域,并不保证价格一定按某方向运行。做出任何决策前,请观察交易量、动能以及整体市场走势。
$BTC
#BTC #Bitcoin #LiquidationMap #Crypto #CryptoTrading #تحليل_فني #比特币 #数字货币 #交易 #加密市场
目前,比特币正交易于约 77,000 美元附近,且流动性在价格两侧呈现明显的集中。
🔼 上行方向的流动性 • 78,800 – 79,500 美元:强劲流动性块
• 高于 80,000 美元:更高价格上方的新增流动性
🔽 下行方向的流动性 • 76,500 – 77,000 美元:接近且重要的流动性区域
• 75,000 – 76,000 美元:更深层的流动性区域
📌 关键水平:BTC 需要重新站上 78,000 美元,以支撑其可能向上流动性区域的走势。若跌破 76,500 美元,价格转向测试下方后续流动性区域的概率可能会增加。
⚠️ 清算地图反映了可能的流动性聚集区域,并不保证价格一定按某方向运行。做出任何决策前,请观察交易量、动能以及整体市场走势。
$BTC
#BTC #Bitcoin #LiquidationMap #Crypto #CryptoTrading #تحليل_فني #比特币 #数字货币 #交易 #加密市场
95

·
--
看涨
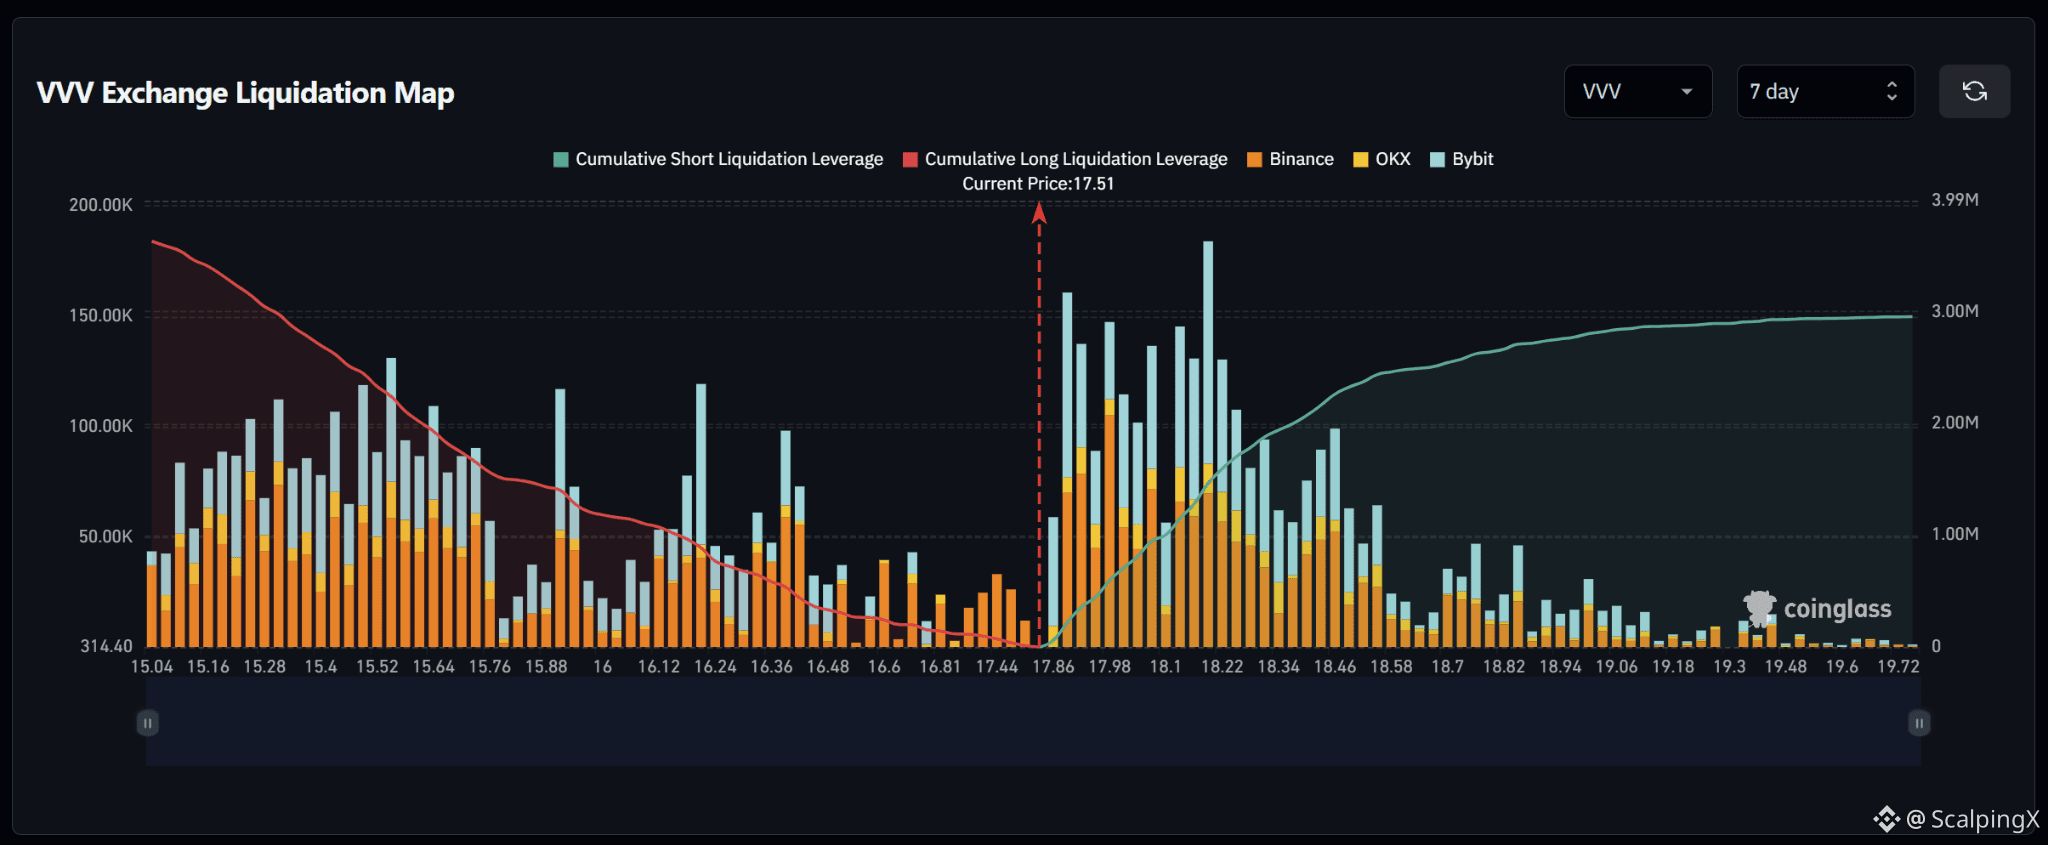
$VVV – 清算图(7天)– 当前价格 17.51
🔎 7天清算图显示,当前价格下方约有360万美元的多头清算,超过了上方约300万美元的空头清算。因此,流动性结构整体较为平衡,但略微偏向下行,市场下方的累计流动性大约是上方的1.2倍。
📉 在市场下方,17.44–16.81附近的多头清算流动性仍然相对稀薄,随后在16.60–16.24区间逐步增加。较明显的聚集区出现在16.36和16.24附近,而更下方15.88–15.28区间的流动性则明显更加密集。若失守17.44,关注重点将转向16.81–16.60。
📈 在市场上方,空头清算流动性从17.86开始明显上升,并在17.98–18.34区间变得密集。最强的聚集区位于18.18–18.22附近,此处清算柱接近18.5万美元,而17.86–18.10以及18.34–18.46区间也包含显著流动性。
🧭 整体结构略微偏向下行,因为下方的多头清算风险更大。若跌破17.44,价格更可能被扫向16.81–16.60;若上破17.86,则关注重点将转向17.98–18.22。
#LiquidationMap
$VVV – 清算图(7天)– 当前价格 17.51
🔎 7天清算图显示,当前价格下方约有360万美元的多头清算,超过了上方约300万美元的空头清算。因此,流动性结构整体较为平衡,但略微偏向下行,市场下方的累计流动性大约是上方的1.2倍。
📉 在市场下方,17.44–16.81附近的多头清算流动性仍然相对稀薄,随后在16.60–16.24区间逐步增加。较明显的聚集区出现在16.36和16.24附近,而更下方15.88–15.28区间的流动性则明显更加密集。若失守17.44,关注重点将转向16.81–16.60。
📈 在市场上方,空头清算流动性从17.86开始明显上升,并在17.98–18.34区间变得密集。最强的聚集区位于18.18–18.22附近,此处清算柱接近18.5万美元,而17.86–18.10以及18.34–18.46区间也包含显著流动性。
🧭 整体结构略微偏向下行,因为下方的多头清算风险更大。若跌破17.44,价格更可能被扫向16.81–16.60;若上破17.86,则关注重点将转向17.98–18.22。
#LiquidationMap
🔎 7天清算图显示,当前价格下方约有360万美元的多头清算,超过了上方约300万美元的空头清算。因此,流动性结构整体较为平衡,但略微偏向下行,市场下方的累计流动性大约是上方的1.2倍。
📉 在市场下方,17.44–16.81附近的多头清算流动性仍然相对稀薄,随后在16.60–16.24区间逐步增加。较明显的聚集区出现在16.36和16.24附近,而更下方15.88–15.28区间的流动性则明显更加密集。若失守17.44,关注重点将转向16.81–16.60。
📈 在市场上方,空头清算流动性从17.86开始明显上升,并在17.98–18.34区间变得密集。最强的聚集区位于18.18–18.22附近,此处清算柱接近18.5万美元,而17.86–18.10以及18.34–18.46区间也包含显著流动性。
🧭 整体结构略微偏向下行,因为下方的多头清算风险更大。若跌破17.44,价格更可能被扫向16.81–16.60;若上破17.86,则关注重点将转向17.98–18.22。
#LiquidationMap
90
·
--
看涨
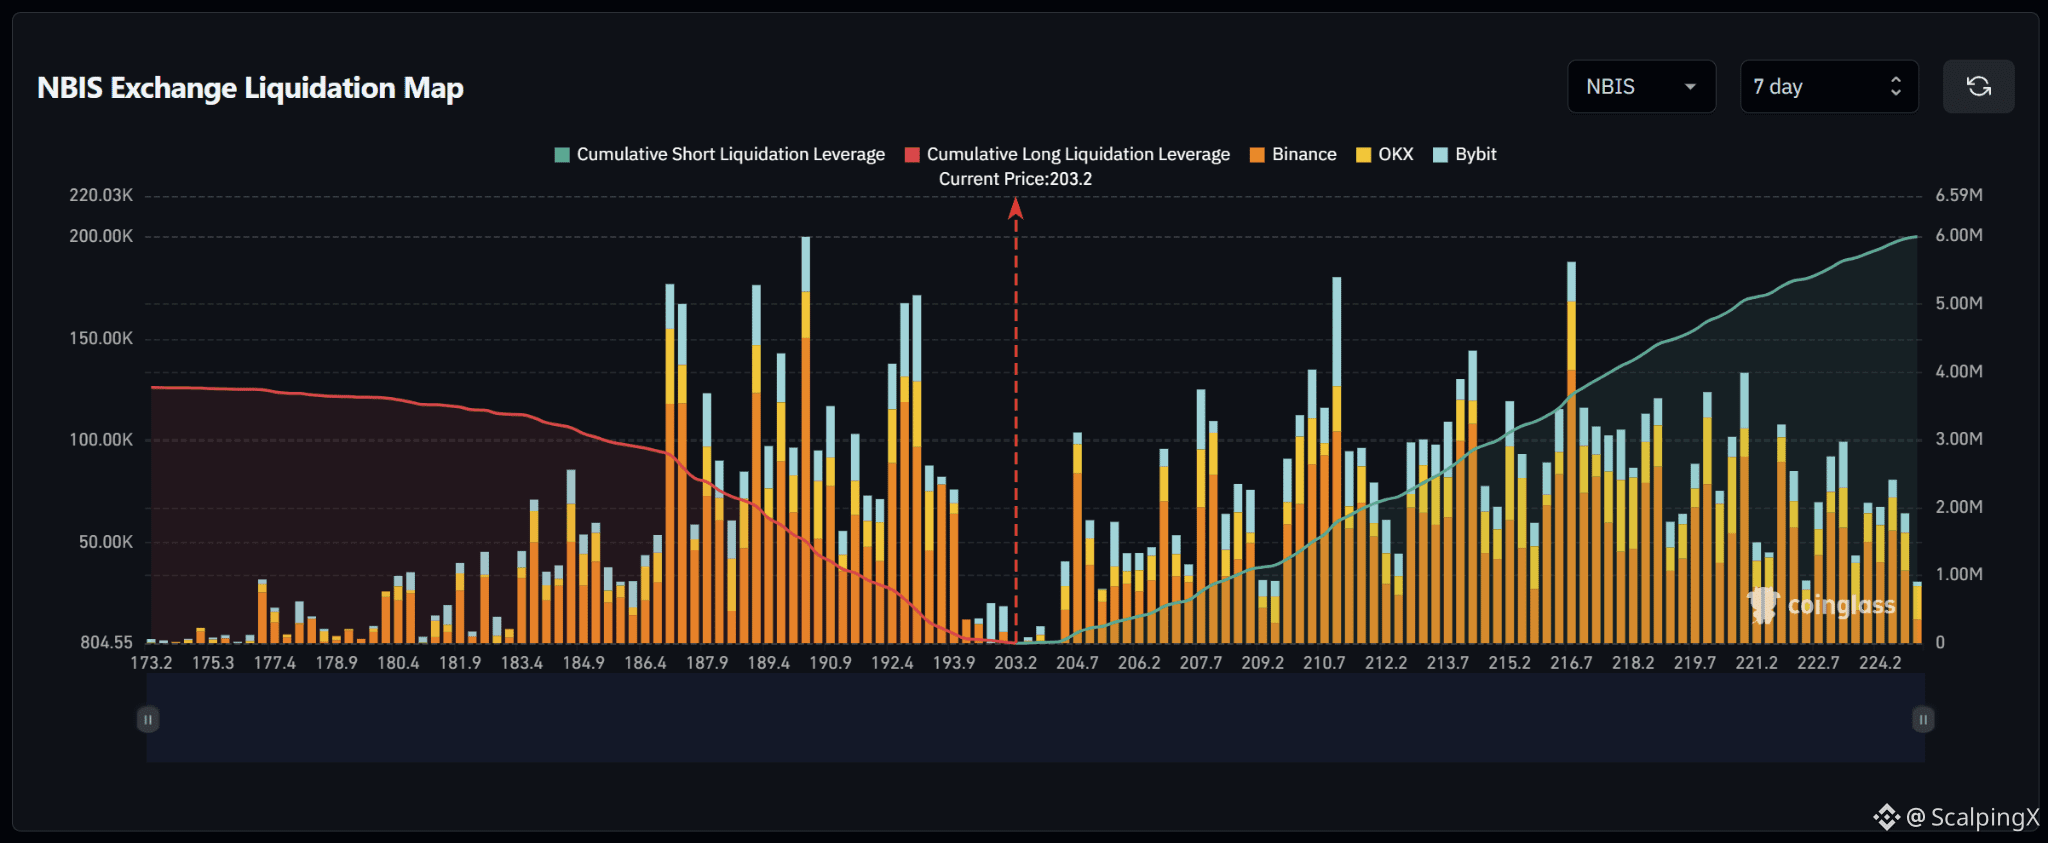
$NBIS – 强制平仓地图(7天)– 当前价格 203.2
🔎 7天强制平仓地图显示,在当前价格上方约有600万美元的做空强制平仓,超过下方约400万的做多强制平仓。因此,流动性结构更偏向上涨:市场上方累计流动性大约是市场下方的1.5倍。
📉 在市场下方,附近的做多强制平仓流动性相对偏薄,主要集中在193.9–192.4;随后在190.9–186.4区间内急剧增加。最强的流动性簇位于190和187附近,其中多根柱子的数值大约在15万–20万美元。若跌破193.9,关注点将转向192.4–190.9。
📈 在市场上方,做空强制平仓流动性从204.7开始逐步累积,并在207.7–212.2区间内继续增加。靠近210.7的一组显著聚集,接近18万美元。再往外,213.7–218.2区间内流动性依然较为密集,其中216.7附近约在19万美元水平尤为突出。
🧭 整体结构偏向上涨,因为上方的做空强制平仓敞口约为下方的1.5倍。若突破204.7,将提高价格向207.7–212.2扫荡的概率;而若失守193.9,关注点将转向192.4–190.9。
#LiquidationMap
$NBIS – 强制平仓地图(7天)– 当前价格 203.2
🔎 7天强制平仓地图显示,在当前价格上方约有600万美元的做空强制平仓,超过下方约400万的做多强制平仓。因此,流动性结构更偏向上涨:市场上方累计流动性大约是市场下方的1.5倍。
📉 在市场下方,附近的做多强制平仓流动性相对偏薄,主要集中在193.9–192.4;随后在190.9–186.4区间内急剧增加。最强的流动性簇位于190和187附近,其中多根柱子的数值大约在15万–20万美元。若跌破193.9,关注点将转向192.4–190.9。
📈 在市场上方,做空强制平仓流动性从204.7开始逐步累积,并在207.7–212.2区间内继续增加。靠近210.7的一组显著聚集,接近18万美元。再往外,213.7–218.2区间内流动性依然较为密集,其中216.7附近约在19万美元水平尤为突出。
🧭 整体结构偏向上涨,因为上方的做空强制平仓敞口约为下方的1.5倍。若突破204.7,将提高价格向207.7–212.2扫荡的概率;而若失守193.9,关注点将转向192.4–190.9。
#LiquidationMap
🔎 7天强制平仓地图显示,在当前价格上方约有600万美元的做空强制平仓,超过下方约400万的做多强制平仓。因此,流动性结构更偏向上涨:市场上方累计流动性大约是市场下方的1.5倍。
📉 在市场下方,附近的做多强制平仓流动性相对偏薄,主要集中在193.9–192.4;随后在190.9–186.4区间内急剧增加。最强的流动性簇位于190和187附近,其中多根柱子的数值大约在15万–20万美元。若跌破193.9,关注点将转向192.4–190.9。
📈 在市场上方,做空强制平仓流动性从204.7开始逐步累积,并在207.7–212.2区间内继续增加。靠近210.7的一组显著聚集,接近18万美元。再往外,213.7–218.2区间内流动性依然较为密集,其中216.7附近约在19万美元水平尤为突出。
🧭 整体结构偏向上涨,因为上方的做空强制平仓敞口约为下方的1.5倍。若突破204.7,将提高价格向207.7–212.2扫荡的概率;而若失守193.9,关注点将转向192.4–190.9。
#LiquidationMap
19
·
--
看涨
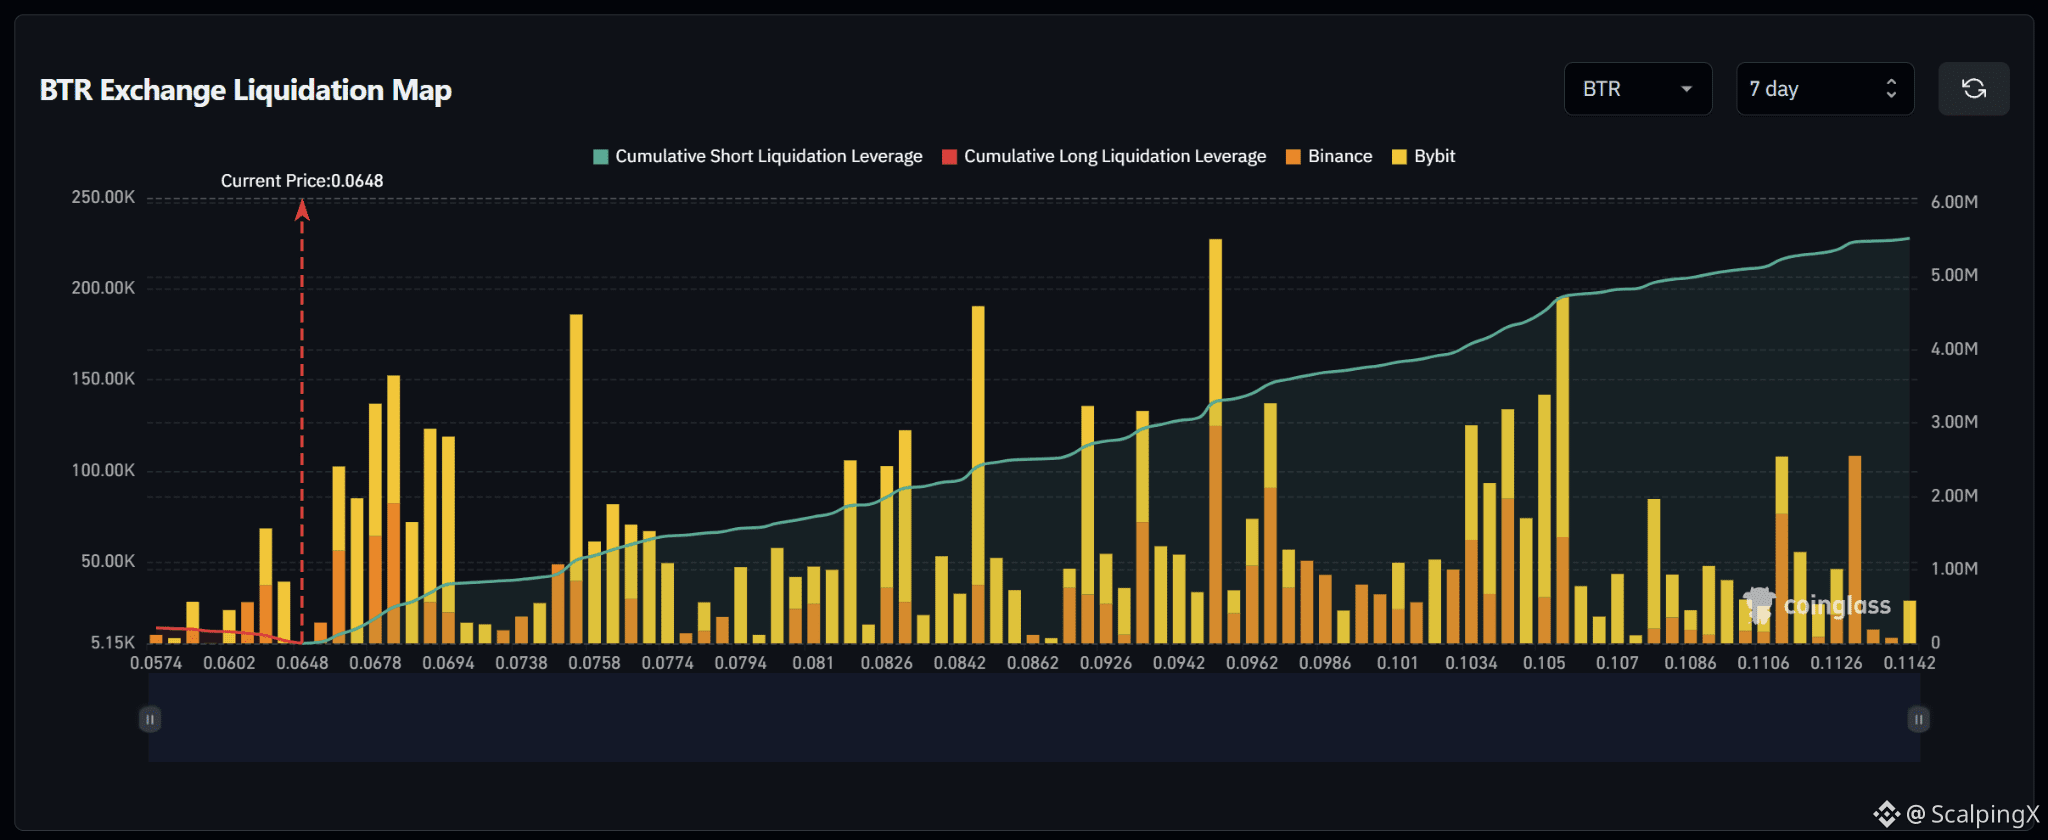
$BTR – 清算图(7天)– 当前价格 0.0648
🔎 7天清算图显示:在当前价格之上,约有 540万–550万美元的做空清算;而当价格位于所示区间的下沿附近时,下方的多头清算敞口几乎可以忽略不计。因此,流动性结构明显偏向上行。
📉 在市场下方,剩余的多头清算流动性相对较薄,主要集中在 0.0602–0.0574。当前价格下方在展示区间内没有明显的主要清算集群,表明该区间内缺乏对下行流动性的吸引。
📈 在市场上方,做空清算流动性会从 0.0678–0.0694 附近立即开始累积,随后在 0.0758、0.0842 以及尤其是 0.094–0.096 附近出现若干较大的集群。更远处,0.1034–0.105 格外突出,其柱状约在 140,000–195,000 美元左右;而 0.1126 也包含一个值得注意的集群。
🧭 整体格局强烈偏向上行:几乎所有重要的清算流动性都位于市场之上。只要跌破 0.0678,就会提高向 0.0694–0.0758 方向“扫盘”的概率;若动能继续,0.0842 和 0.094–0.096 将成为下一批显著的流动性区域。
#LiquidationMap
$BTR – 清算图(7天)– 当前价格 0.0648
🔎 7天清算图显示:在当前价格之上,约有 540万–550万美元的做空清算;而当价格位于所示区间的下沿附近时,下方的多头清算敞口几乎可以忽略不计。因此,流动性结构明显偏向上行。
📉 在市场下方,剩余的多头清算流动性相对较薄,主要集中在 0.0602–0.0574。当前价格下方在展示区间内没有明显的主要清算集群,表明该区间内缺乏对下行流动性的吸引。
📈 在市场上方,做空清算流动性会从 0.0678–0.0694 附近立即开始累积,随后在 0.0758、0.0842 以及尤其是 0.094–0.096 附近出现若干较大的集群。更远处,0.1034–0.105 格外突出,其柱状约在 140,000–195,000 美元左右;而 0.1126 也包含一个值得注意的集群。
🧭 整体格局强烈偏向上行:几乎所有重要的清算流动性都位于市场之上。只要跌破 0.0678,就会提高向 0.0694–0.0758 方向“扫盘”的概率;若动能继续,0.0842 和 0.094–0.096 将成为下一批显著的流动性区域。
#LiquidationMap
🔎 7天清算图显示:在当前价格之上,约有 540万–550万美元的做空清算;而当价格位于所示区间的下沿附近时,下方的多头清算敞口几乎可以忽略不计。因此,流动性结构明显偏向上行。
📉 在市场下方,剩余的多头清算流动性相对较薄,主要集中在 0.0602–0.0574。当前价格下方在展示区间内没有明显的主要清算集群,表明该区间内缺乏对下行流动性的吸引。
📈 在市场上方,做空清算流动性会从 0.0678–0.0694 附近立即开始累积,随后在 0.0758、0.0842 以及尤其是 0.094–0.096 附近出现若干较大的集群。更远处,0.1034–0.105 格外突出,其柱状约在 140,000–195,000 美元左右;而 0.1126 也包含一个值得注意的集群。
🧭 整体格局强烈偏向上行:几乎所有重要的清算流动性都位于市场之上。只要跌破 0.0678,就会提高向 0.0694–0.0758 方向“扫盘”的概率;若动能继续,0.0842 和 0.094–0.096 将成为下一批显著的流动性区域。
#LiquidationMap
43
·
--
看涨
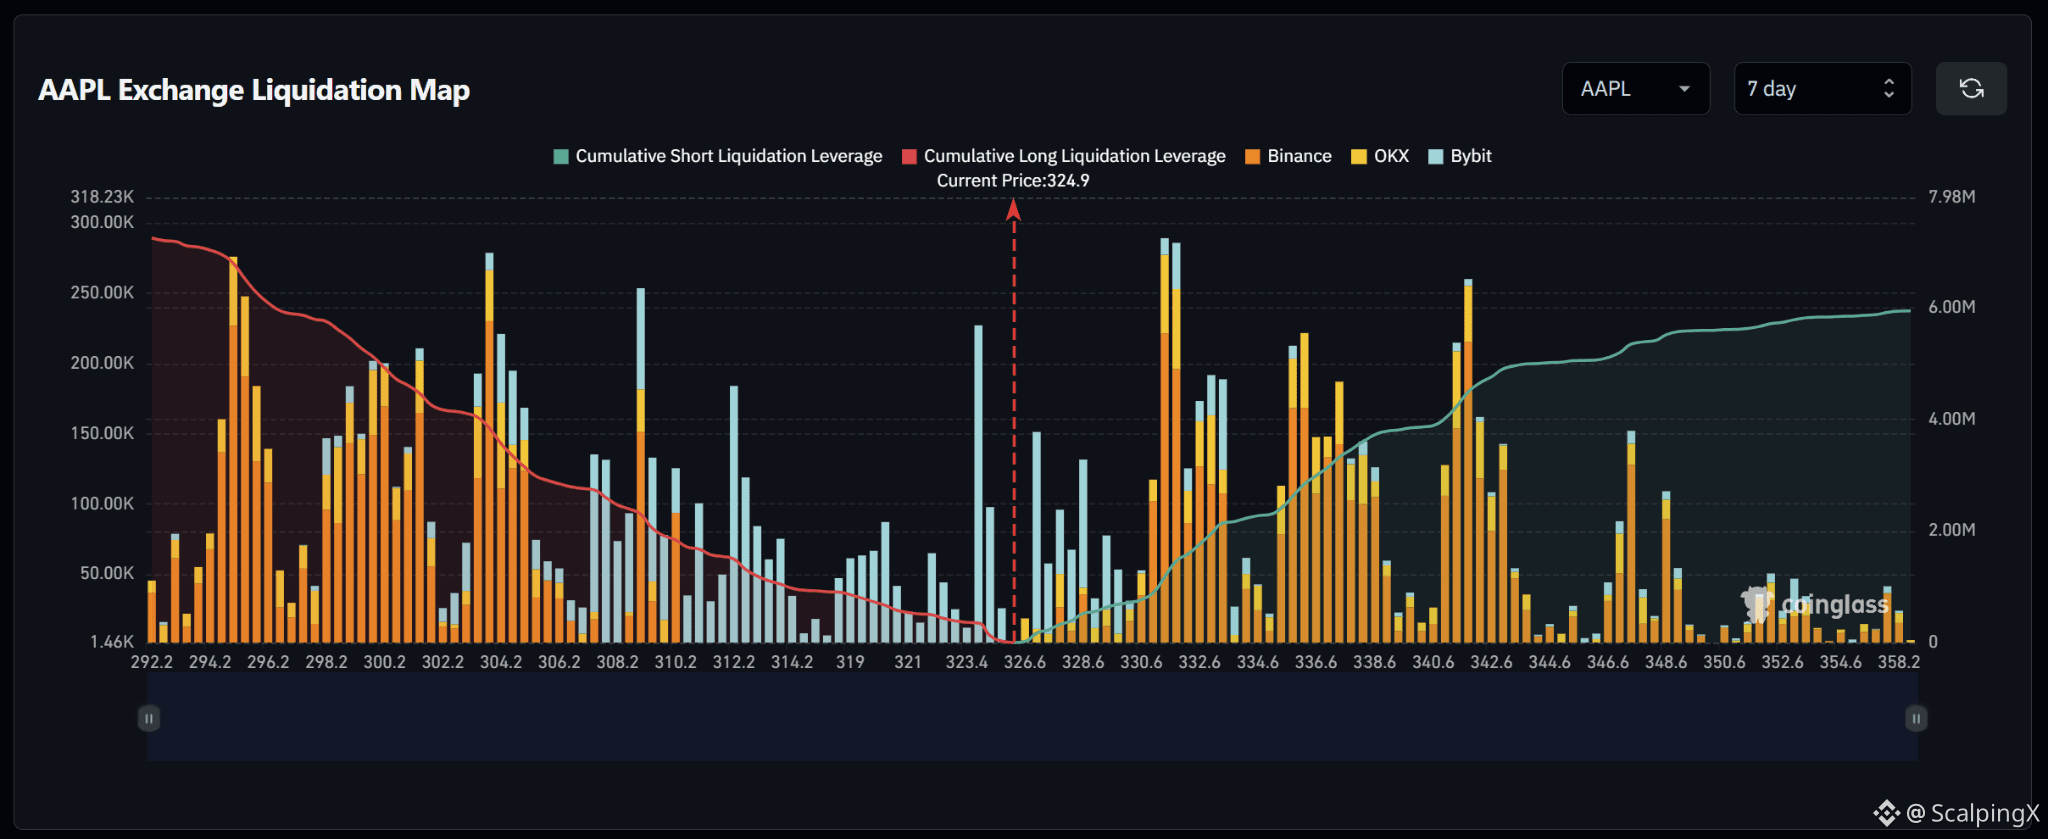
$AAPL – 清算图(7天)– 当前价格 324.9
🔎 7天清算图显示:在当前价格下方,大约有700万美元的多头清算;而在当前价格上方,约有600万美元以上的空头清算。因此整体结构相对均衡,但略微偏向下行。
📉 在市场下方,附近的多头清算流动性主要集中在323.4–321.0附近,其中在323.4附近有一根明显的柱状标记,超过20万美元。更往下,在308.2–304.2以及296.2–294.2附近出现更大的集群,其中多根柱状标记大约在20万–28万美元。跌破323.4将把关注点转向321.0–319.0。
📈 在市场上方,空头清算流动性从约326.6开始逐步累积,并在330.6–332.6区间内变得更为密集。靠近331–332的最强集群接近29万美元。再往外,336.6以及340.6–342.6同样包含显著的流动性。
🧭 更广泛的格局略微利空,因为下方的多头清算敞口更大。跌破323.4会提高向321.0–319.0进行扫单的概率;而上破326.6则会把注意力转向330.6–332.6。
#LiquidationMap
$AAPL – 清算图(7天)– 当前价格 324.9
🔎 7天清算图显示:在当前价格下方,大约有700万美元的多头清算;而在当前价格上方,约有600万美元以上的空头清算。因此整体结构相对均衡,但略微偏向下行。
📉 在市场下方,附近的多头清算流动性主要集中在323.4–321.0附近,其中在323.4附近有一根明显的柱状标记,超过20万美元。更往下,在308.2–304.2以及296.2–294.2附近出现更大的集群,其中多根柱状标记大约在20万–28万美元。跌破323.4将把关注点转向321.0–319.0。
📈 在市场上方,空头清算流动性从约326.6开始逐步累积,并在330.6–332.6区间内变得更为密集。靠近331–332的最强集群接近29万美元。再往外,336.6以及340.6–342.6同样包含显著的流动性。
🧭 更广泛的格局略微利空,因为下方的多头清算敞口更大。跌破323.4会提高向321.0–319.0进行扫单的概率;而上破326.6则会把注意力转向330.6–332.6。
#LiquidationMap
🔎 7天清算图显示:在当前价格下方,大约有700万美元的多头清算;而在当前价格上方,约有600万美元以上的空头清算。因此整体结构相对均衡,但略微偏向下行。
📉 在市场下方,附近的多头清算流动性主要集中在323.4–321.0附近,其中在323.4附近有一根明显的柱状标记,超过20万美元。更往下,在308.2–304.2以及296.2–294.2附近出现更大的集群,其中多根柱状标记大约在20万–28万美元。跌破323.4将把关注点转向321.0–319.0。
📈 在市场上方,空头清算流动性从约326.6开始逐步累积,并在330.6–332.6区间内变得更为密集。靠近331–332的最强集群接近29万美元。再往外,336.6以及340.6–342.6同样包含显著的流动性。
🧭 更广泛的格局略微利空,因为下方的多头清算敞口更大。跌破323.4会提高向321.0–319.0进行扫单的概率;而上破326.6则会把注意力转向330.6–332.6。
#LiquidationMap
1
18
·
--
看涨
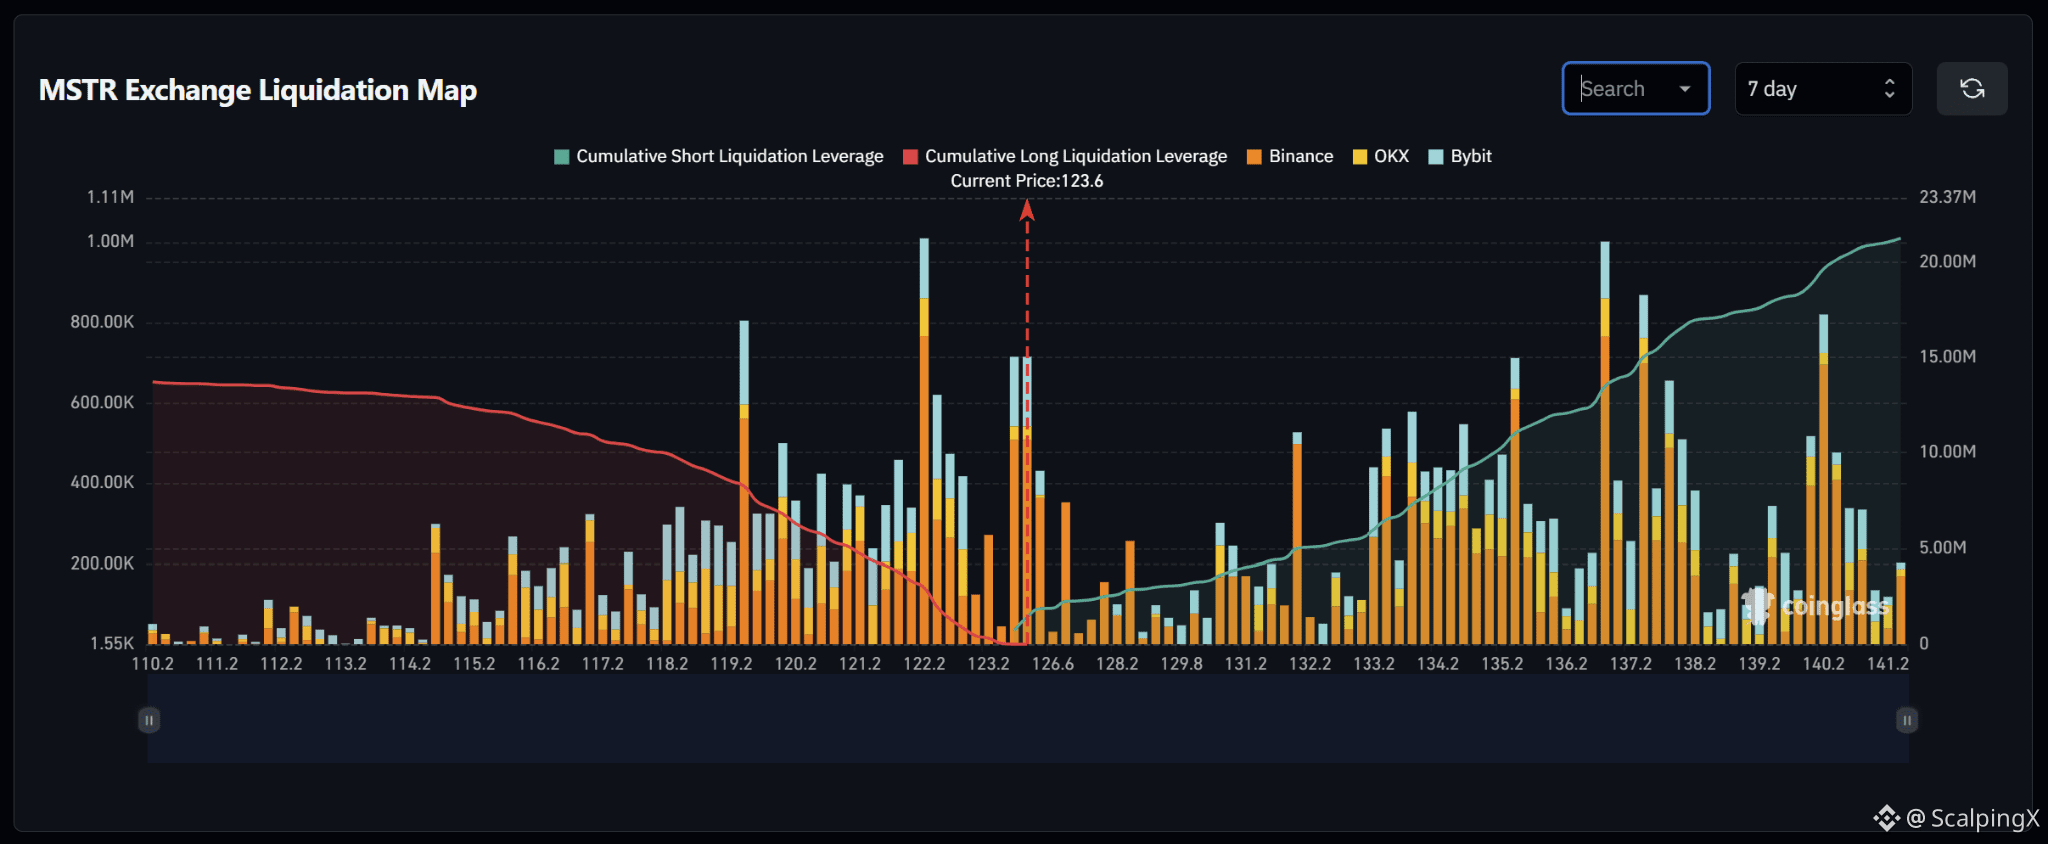
$MSTR – 强平地图(7天)– 当前价格 123.6
🔎 7天强平地图显示,在当前价格之上,大约有2,000万至2,100万美元的做空强平;而在当前价格之下,大约有1,300万至1,400万的做多强平。流动性结构因此更偏向上行:在市场上方累计流动性大约是市场下方的1.5倍。
📉 在市场下方,附近的做多强平流动性主要集中在 123.2–122.2。最强的集群位于 122.2 附近,此处强平柱大约达到100万;同时 119.2 也包含一个规模较大的集群,约在 80万美元附近。跌破 123.2 将提高价格扫向 122.2 的概率。
📈 在市场上方,做空强平流动性在 124–126.6 左右开始累积,然后在 133.2–137.2 区间内迅速上升。136.2–137.2 这一带尤为突出,强平柱大约在 85万至100万美元。再往外,140.2 位置也包含一个超过 80万美元的大型集群。
🧭 整体结构更偏向上行,因为上方的做空强平敞口大约是下方的1.5倍。有效突破 124–126.6 将提高向 133.2–137.2 区域推进的概率;而失守 123.2 则会把关注点转向 122.2。
#LiquidationMap
$MSTR – 强平地图(7天)– 当前价格 123.6
🔎 7天强平地图显示,在当前价格之上,大约有2,000万至2,100万美元的做空强平;而在当前价格之下,大约有1,300万至1,400万的做多强平。流动性结构因此更偏向上行:在市场上方累计流动性大约是市场下方的1.5倍。
📉 在市场下方,附近的做多强平流动性主要集中在 123.2–122.2。最强的集群位于 122.2 附近,此处强平柱大约达到100万;同时 119.2 也包含一个规模较大的集群,约在 80万美元附近。跌破 123.2 将提高价格扫向 122.2 的概率。
📈 在市场上方,做空强平流动性在 124–126.6 左右开始累积,然后在 133.2–137.2 区间内迅速上升。136.2–137.2 这一带尤为突出,强平柱大约在 85万至100万美元。再往外,140.2 位置也包含一个超过 80万美元的大型集群。
🧭 整体结构更偏向上行,因为上方的做空强平敞口大约是下方的1.5倍。有效突破 124–126.6 将提高向 133.2–137.2 区域推进的概率;而失守 123.2 则会把关注点转向 122.2。
#LiquidationMap
🔎 7天强平地图显示,在当前价格之上,大约有2,000万至2,100万美元的做空强平;而在当前价格之下,大约有1,300万至1,400万的做多强平。流动性结构因此更偏向上行:在市场上方累计流动性大约是市场下方的1.5倍。
📉 在市场下方,附近的做多强平流动性主要集中在 123.2–122.2。最强的集群位于 122.2 附近,此处强平柱大约达到100万;同时 119.2 也包含一个规模较大的集群,约在 80万美元附近。跌破 123.2 将提高价格扫向 122.2 的概率。
📈 在市场上方,做空强平流动性在 124–126.6 左右开始累积,然后在 133.2–137.2 区间内迅速上升。136.2–137.2 这一带尤为突出,强平柱大约在 85万至100万美元。再往外,140.2 位置也包含一个超过 80万美元的大型集群。
🧭 整体结构更偏向上行,因为上方的做空强平敞口大约是下方的1.5倍。有效突破 124–126.6 将提高向 133.2–137.2 区域推进的概率;而失守 123.2 则会把关注点转向 122.2。
#LiquidationMap
15
·
--
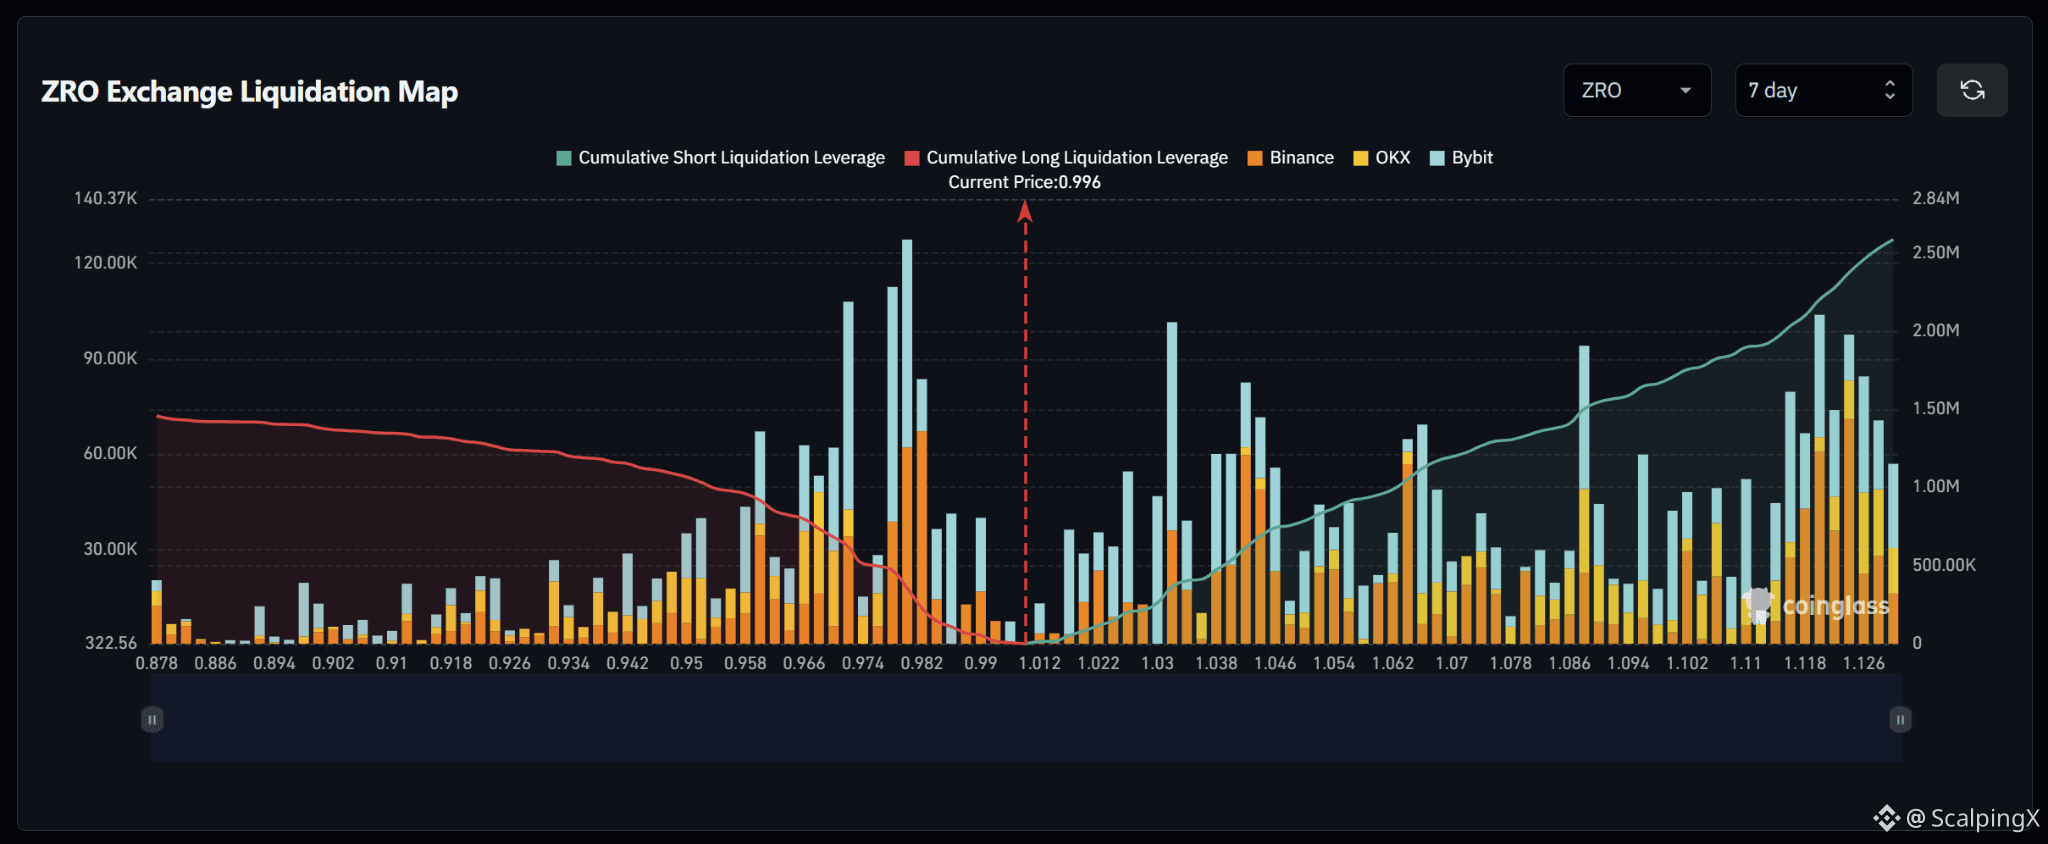
$ZRO – 强平地图(7天)– 当前价格 0.996
🔎 7天强平地图显示,在当前价格上方约有250万美元的空头强平,而低于当前价格下方约超过150万美元的多头强平。因此,流动性结构更偏向上涨,上方累计流动性大约为市场的1.6–1.7倍。
📉 在市场下方,附近的多头强平流动性主要集中在 0.982–0.966。最强的聚集区位于 0.978–0.982,此处强平柱大约达到 11万–13万美元,而 0.966–0.974 也包含显著的流动性。若跌破 0.982,关注点将转向 0.974–0.966。
📈 在市场上方,空头强平流动性从约 1.012 开始累积,并在 1.030–1.046 区间内逐步增强。再往外,1.086 以及尤其是 1.118–1.126 区域更为突出,有多根柱体大约在 9万–10.5万美元附近。这些构成了更值得关注的上行动能流动性区域。
🧭 整体格局偏向上涨,因为上方的空头强平敞口约为1.6–1.7倍。只要突破 1.012,就会提高向 1.030–1.046 进行扫荡的概率;而失守 0.982 则会把关注点转向 0.974–0.966。
#LiquidationMap
$ZRO – 强平地图(7天)– 当前价格 0.996
🔎 7天强平地图显示,在当前价格上方约有250万美元的空头强平,而低于当前价格下方约超过150万美元的多头强平。因此,流动性结构更偏向上涨,上方累计流动性大约为市场的1.6–1.7倍。
📉 在市场下方,附近的多头强平流动性主要集中在 0.982–0.966。最强的聚集区位于 0.978–0.982,此处强平柱大约达到 11万–13万美元,而 0.966–0.974 也包含显著的流动性。若跌破 0.982,关注点将转向 0.974–0.966。
📈 在市场上方,空头强平流动性从约 1.012 开始累积,并在 1.030–1.046 区间内逐步增强。再往外,1.086 以及尤其是 1.118–1.126 区域更为突出,有多根柱体大约在 9万–10.5万美元附近。这些构成了更值得关注的上行动能流动性区域。
🧭 整体格局偏向上涨,因为上方的空头强平敞口约为1.6–1.7倍。只要突破 1.012,就会提高向 1.030–1.046 进行扫荡的概率;而失守 0.982 则会把关注点转向 0.974–0.966。
#LiquidationMap
🔎 7天强平地图显示,在当前价格上方约有250万美元的空头强平,而低于当前价格下方约超过150万美元的多头强平。因此,流动性结构更偏向上涨,上方累计流动性大约为市场的1.6–1.7倍。
📉 在市场下方,附近的多头强平流动性主要集中在 0.982–0.966。最强的聚集区位于 0.978–0.982,此处强平柱大约达到 11万–13万美元,而 0.966–0.974 也包含显著的流动性。若跌破 0.982,关注点将转向 0.974–0.966。
📈 在市场上方,空头强平流动性从约 1.012 开始累积,并在 1.030–1.046 区间内逐步增强。再往外,1.086 以及尤其是 1.118–1.126 区域更为突出,有多根柱体大约在 9万–10.5万美元附近。这些构成了更值得关注的上行动能流动性区域。
🧭 整体格局偏向上涨,因为上方的空头强平敞口约为1.6–1.7倍。只要突破 1.012,就会提高向 1.030–1.046 进行扫荡的概率;而失守 0.982 则会把关注点转向 0.974–0.966。
#LiquidationMap
77
·
--
看涨
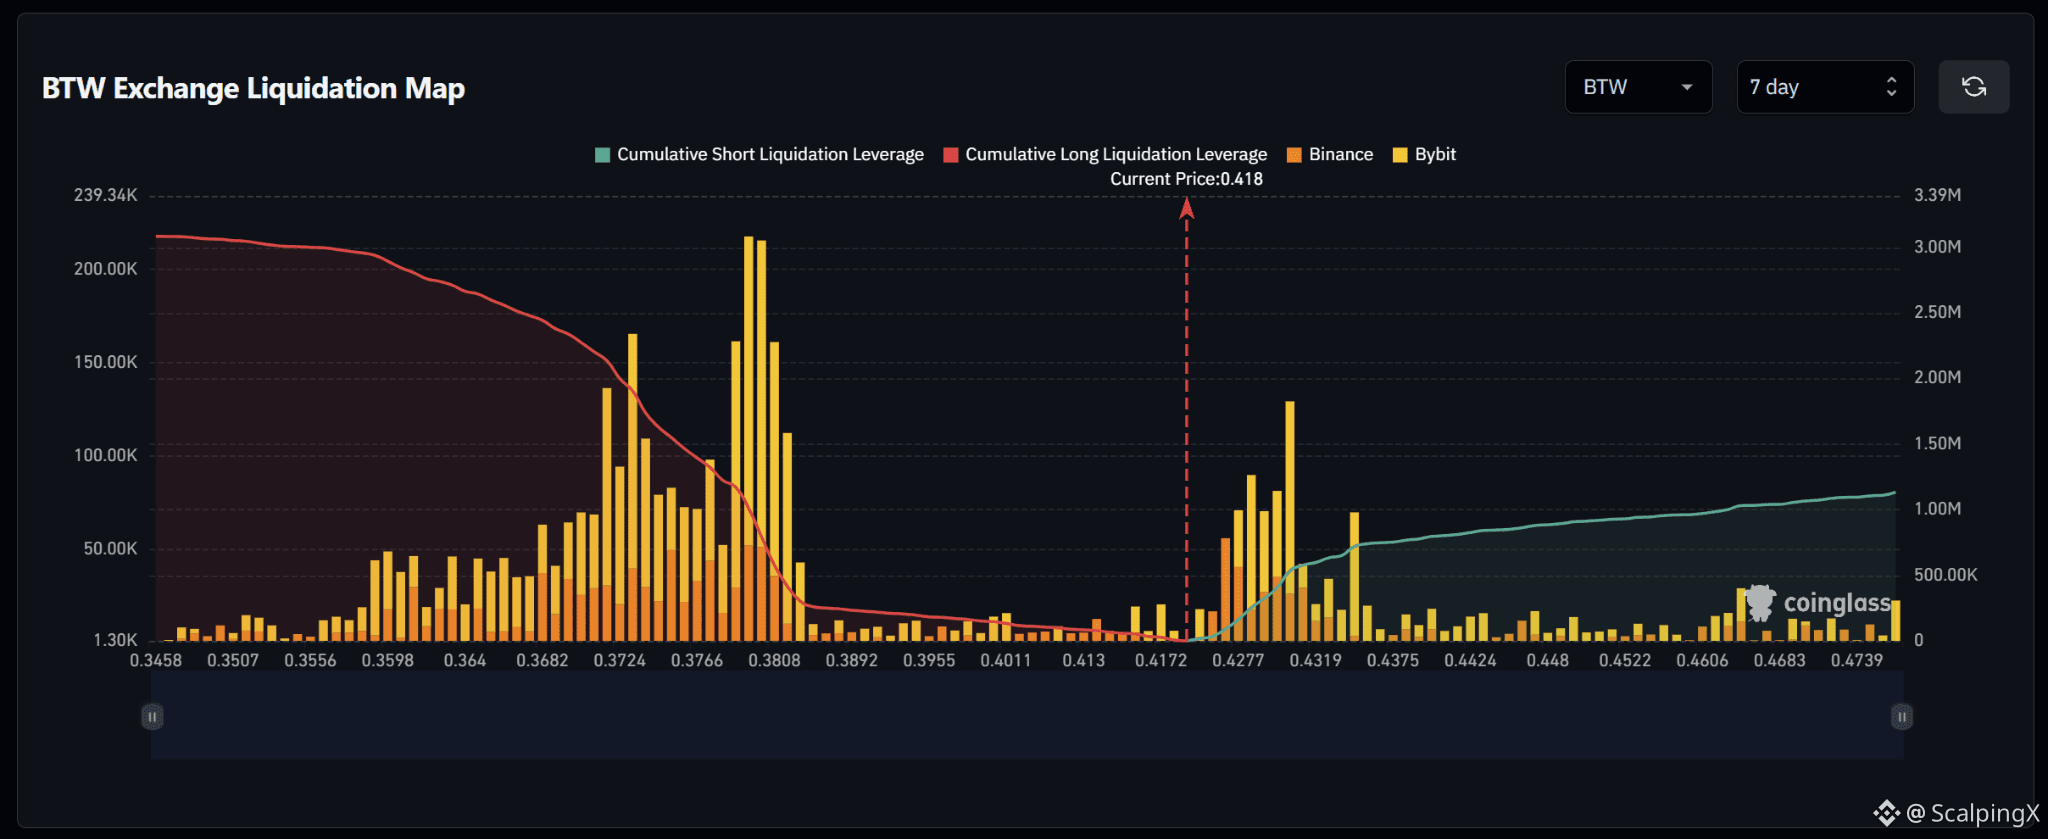
$BTW – 清算地图(7天)– 当前价格 0.418
🔎 7天清算地图显示:在当前价格下方约有310万美元的多头清算,而在当前价格上方的空头清算约为110万美元,接近前三倍。因此,流动性结构显然更偏向下行。
📉 在市场下方,附近的多头清算流动性相对较薄,集中在0.413–0.401;随后在0.389–0.372区间急剧增厚。最强的集群位于0.378–0.381,在此处清算柱超过20万美元;而0.372–0.377也同样包含相当可观的流动性。跌破0.413将逐步把关注点转向0.401–0.389。
📈 在市场上方,空头清算流动性从0.4277开始明显构建,并在0.4319–0.4375区间持续增加。最强集群出现在0.4319附近,此处清算柱大约达到13万美元;同时,0.4277–0.4319构成最近的、较显著的上行流动性区域。
🧭 由于下方的多头清算敞口几乎是上方的近三倍,整体结构更有利于下行。跌破0.413将提高对0.401–0.389区间进行扫盘的概率;而一旦突破0.4277,关注点则会转向0.4319–0.4375。
#LiquidationMap
$BTW – 清算地图(7天)– 当前价格 0.418
🔎 7天清算地图显示:在当前价格下方约有310万美元的多头清算,而在当前价格上方的空头清算约为110万美元,接近前三倍。因此,流动性结构显然更偏向下行。
📉 在市场下方,附近的多头清算流动性相对较薄,集中在0.413–0.401;随后在0.389–0.372区间急剧增厚。最强的集群位于0.378–0.381,在此处清算柱超过20万美元;而0.372–0.377也同样包含相当可观的流动性。跌破0.413将逐步把关注点转向0.401–0.389。
📈 在市场上方,空头清算流动性从0.4277开始明显构建,并在0.4319–0.4375区间持续增加。最强集群出现在0.4319附近,此处清算柱大约达到13万美元;同时,0.4277–0.4319构成最近的、较显著的上行流动性区域。
🧭 由于下方的多头清算敞口几乎是上方的近三倍,整体结构更有利于下行。跌破0.413将提高对0.401–0.389区间进行扫盘的概率;而一旦突破0.4277,关注点则会转向0.4319–0.4375。
#LiquidationMap
🔎 7天清算地图显示:在当前价格下方约有310万美元的多头清算,而在当前价格上方的空头清算约为110万美元,接近前三倍。因此,流动性结构显然更偏向下行。
📉 在市场下方,附近的多头清算流动性相对较薄,集中在0.413–0.401;随后在0.389–0.372区间急剧增厚。最强的集群位于0.378–0.381,在此处清算柱超过20万美元;而0.372–0.377也同样包含相当可观的流动性。跌破0.413将逐步把关注点转向0.401–0.389。
📈 在市场上方,空头清算流动性从0.4277开始明显构建,并在0.4319–0.4375区间持续增加。最强集群出现在0.4319附近,此处清算柱大约达到13万美元;同时,0.4277–0.4319构成最近的、较显著的上行流动性区域。
🧭 由于下方的多头清算敞口几乎是上方的近三倍,整体结构更有利于下行。跌破0.413将提高对0.401–0.389区间进行扫盘的概率;而一旦突破0.4277,关注点则会转向0.4319–0.4375。
#LiquidationMap
9
·
--
看涨
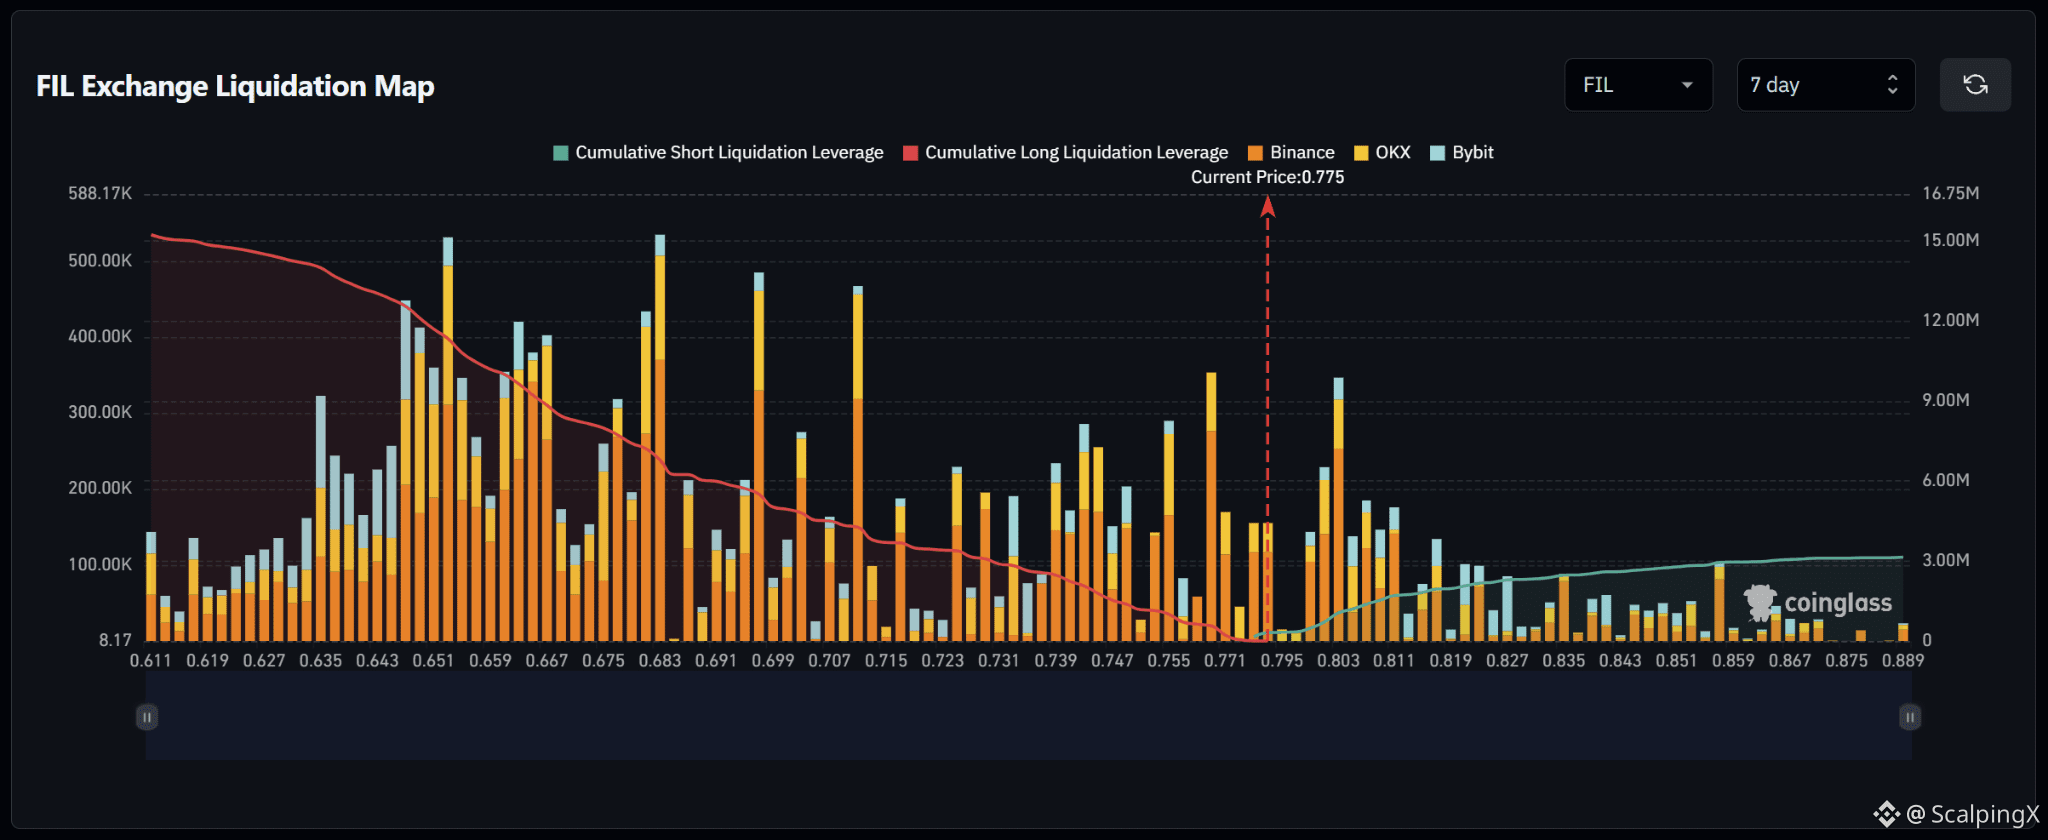
$FIL – 清算地图(7天)– 当前价格 0.775
🔎 7天清算地图显示:在当前价格下方,大约有1,500万美元的多头强平;而在当前价格上方,大约有300万美元的空头强平,相当于前者的约五倍。因此,流动性结构明显更偏向下行。
📉 在市场下方,附近的多头清算流动性主要集中在 0.771–0.747,其中在 0.755 和 0.747 附近有明显的聚集点。再往下,0.707–0.683 区间内的流动性急剧增加;而 0.667–0.643 区间则包含若干较大的柱状,规模约在 30万–53万美元之间。跌破 0.771 将提高触发扫盘的概率,扫向 0.755–0.747 区间。
📈 在市场上方,空头清算流动性在当前价格附近相对稀疏,并且从大约 0.795 起开始变得更清晰。最近的最强聚集点位于 0.803 附近,此处清算柱大约达到 34万美元,随后是 0.811–0.819。更远处的上行动能流动性明显更稀薄。
🧭 整体结构强烈偏向下行:下方的多头清算敞口大约是上方的五倍。跌破 0.771 将提高扫向 0.755–0.747 的概率;而一旦突破 0.795,注意力将转向 0.803–0.811。
#LiquidationMap
$FIL – 清算地图(7天)– 当前价格 0.775
🔎 7天清算地图显示:在当前价格下方,大约有1,500万美元的多头强平;而在当前价格上方,大约有300万美元的空头强平,相当于前者的约五倍。因此,流动性结构明显更偏向下行。
📉 在市场下方,附近的多头清算流动性主要集中在 0.771–0.747,其中在 0.755 和 0.747 附近有明显的聚集点。再往下,0.707–0.683 区间内的流动性急剧增加;而 0.667–0.643 区间则包含若干较大的柱状,规模约在 30万–53万美元之间。跌破 0.771 将提高触发扫盘的概率,扫向 0.755–0.747 区间。
📈 在市场上方,空头清算流动性在当前价格附近相对稀疏,并且从大约 0.795 起开始变得更清晰。最近的最强聚集点位于 0.803 附近,此处清算柱大约达到 34万美元,随后是 0.811–0.819。更远处的上行动能流动性明显更稀薄。
🧭 整体结构强烈偏向下行:下方的多头清算敞口大约是上方的五倍。跌破 0.771 将提高扫向 0.755–0.747 的概率;而一旦突破 0.795,注意力将转向 0.803–0.811。
#LiquidationMap
🔎 7天清算地图显示:在当前价格下方,大约有1,500万美元的多头强平;而在当前价格上方,大约有300万美元的空头强平,相当于前者的约五倍。因此,流动性结构明显更偏向下行。
📉 在市场下方,附近的多头清算流动性主要集中在 0.771–0.747,其中在 0.755 和 0.747 附近有明显的聚集点。再往下,0.707–0.683 区间内的流动性急剧增加;而 0.667–0.643 区间则包含若干较大的柱状,规模约在 30万–53万美元之间。跌破 0.771 将提高触发扫盘的概率,扫向 0.755–0.747 区间。
📈 在市场上方,空头清算流动性在当前价格附近相对稀疏,并且从大约 0.795 起开始变得更清晰。最近的最强聚集点位于 0.803 附近,此处清算柱大约达到 34万美元,随后是 0.811–0.819。更远处的上行动能流动性明显更稀薄。
🧭 整体结构强烈偏向下行:下方的多头清算敞口大约是上方的五倍。跌破 0.771 将提高扫向 0.755–0.747 的概率;而一旦突破 0.795,注意力将转向 0.803–0.811。
#LiquidationMap
36
·
--
看涨
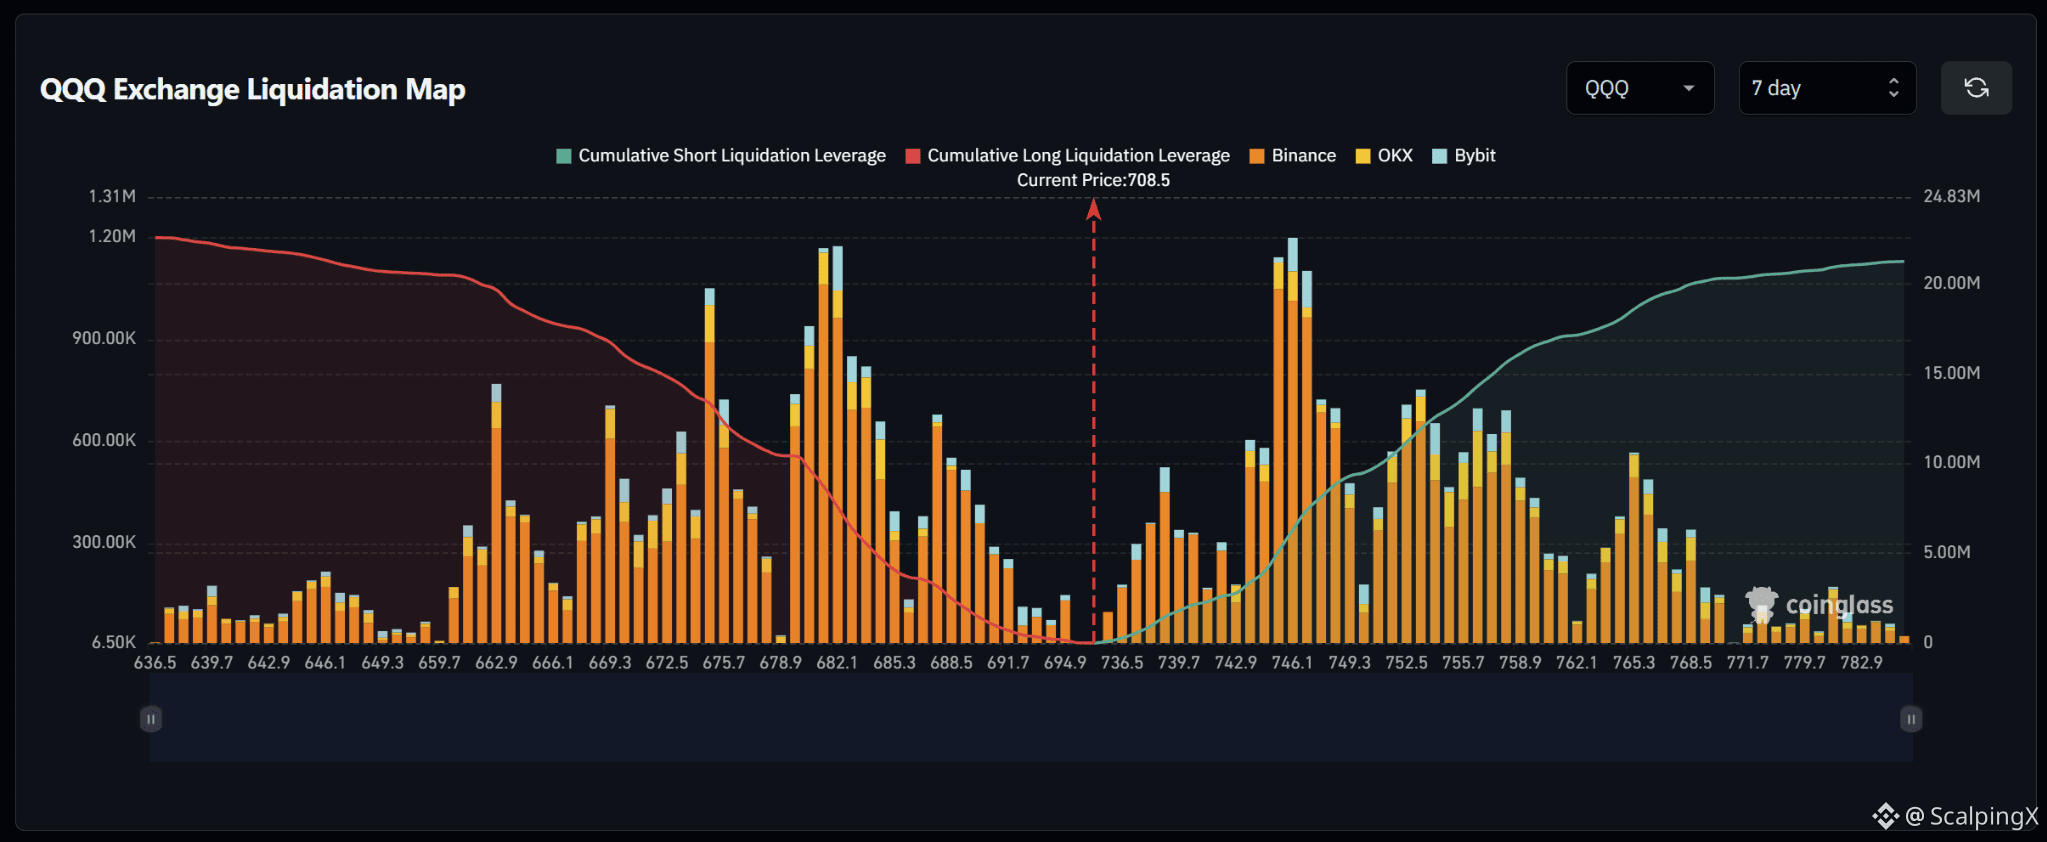
$QQQ – 清算地图(7天)– 当前价格 708.5
🔎 7天清算地图显示,在当前价格下方约有2200万美元的多头清算,略微超过当前价格上方约2100万美元的空头清算。整体结构因此相对均衡,但略微偏向下行。
📉 在市场下方,多头清算流动性主要高度集中在 688.5–675.7。最强的聚集点位于 682.1 附近,清算柱接近120万美元;同时 675.7 和 662.9 也在约70万–100万美元区间内包含较大的聚集。若跌破 694.9,注意力将转向 688.5–682.1。
📈 在市场上方,显著的空头清算流动性从约 736.5 起变得更明显,并在 742.9–749.3 之间急剧增加。最强的聚集点位于 746.1 附近,清算柱接近120万美元。更远处,752.5–758.9 也包含数个约50万–75万美元的聚集。
🧭 整体格局仍相对均衡,但略微利好下行。跌破 694.9 将提高扫向 688.5–682.1 的概率;而上破 736.5 则会把注意力转向 742.9–749.3。
#LiquidationMap
$QQQ – 清算地图(7天)– 当前价格 708.5
🔎 7天清算地图显示,在当前价格下方约有2200万美元的多头清算,略微超过当前价格上方约2100万美元的空头清算。整体结构因此相对均衡,但略微偏向下行。
📉 在市场下方,多头清算流动性主要高度集中在 688.5–675.7。最强的聚集点位于 682.1 附近,清算柱接近120万美元;同时 675.7 和 662.9 也在约70万–100万美元区间内包含较大的聚集。若跌破 694.9,注意力将转向 688.5–682.1。
📈 在市场上方,显著的空头清算流动性从约 736.5 起变得更明显,并在 742.9–749.3 之间急剧增加。最强的聚集点位于 746.1 附近,清算柱接近120万美元。更远处,752.5–758.9 也包含数个约50万–75万美元的聚集。
🧭 整体格局仍相对均衡,但略微利好下行。跌破 694.9 将提高扫向 688.5–682.1 的概率;而上破 736.5 则会把注意力转向 742.9–749.3。
#LiquidationMap
🔎 7天清算地图显示,在当前价格下方约有2200万美元的多头清算,略微超过当前价格上方约2100万美元的空头清算。整体结构因此相对均衡,但略微偏向下行。
📉 在市场下方,多头清算流动性主要高度集中在 688.5–675.7。最强的聚集点位于 682.1 附近,清算柱接近120万美元;同时 675.7 和 662.9 也在约70万–100万美元区间内包含较大的聚集。若跌破 694.9,注意力将转向 688.5–682.1。
📈 在市场上方,显著的空头清算流动性从约 736.5 起变得更明显,并在 742.9–749.3 之间急剧增加。最强的聚集点位于 746.1 附近,清算柱接近120万美元。更远处,752.5–758.9 也包含数个约50万–75万美元的聚集。
🧭 整体格局仍相对均衡,但略微利好下行。跌破 694.9 将提高扫向 688.5–682.1 的概率;而上破 736.5 则会把注意力转向 742.9–749.3。
#LiquidationMap
16
·
--
看涨
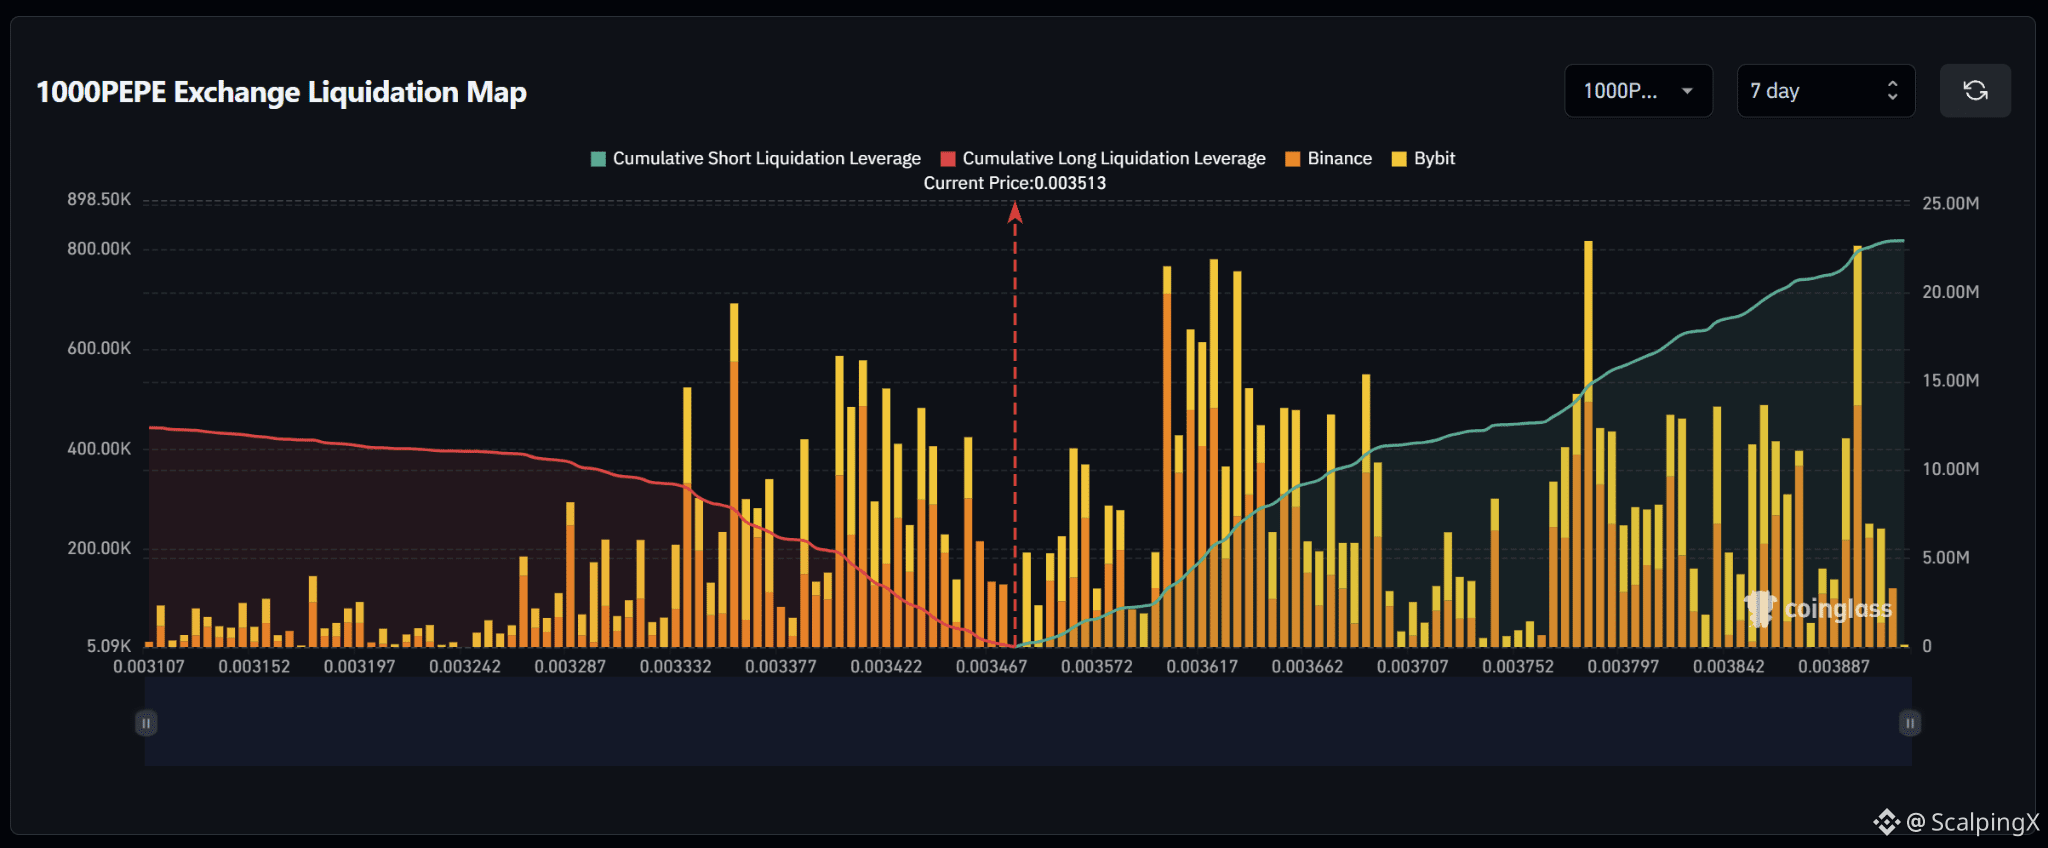
$PEPE – 清算地图(7天)– 当前价格 0.003513
🔎 7天清算地图显示,在当前价格之上约有2200万–2300万美元的空头清算;而在当前价格之下,约有约1200万美元的多头清算,几乎是其近乎两倍。因此,流动性结构明显更偏向上涨:市场上方的累计流动性约为市场下方的1.8–1.9倍。
📉 在市场下方,附近的多头清算流动性主要集中在 0.003467–0.003377。值得注意的是,在 0.003422–0.003377 附近出现了明显的集群,其中有多根清算柱大约达到40万–60万美元。再往下,0.003332 区域附近也包含一个接近50万美元的巨大集群。跌破 0.003467 将把注意力转向 0.003422–0.003377。
📈 在市场上方,空头清算流动性从约 0.003572 开始累积,并在 0.00360–0.00366 区间内快速增长;在该区间内,几根清算柱大约达到60万–78万美元。更远处,0.003797 和 0.003887 特别突出,其清算柱接近80万美元,形成了部分最大的看涨侧集群。
🧭 整体结构更利多,因为上方的空头清算敞口几乎是下方的两倍。只要突破 0.003572,就将提高价格向 0.00360–0.00366 区间扫盘的概率;而一旦跌破 0.003467,注意力则会转向 0.003422–0.003377。
#LiquidationMap
$PEPE – 清算地图(7天)– 当前价格 0.003513
🔎 7天清算地图显示,在当前价格之上约有2200万–2300万美元的空头清算;而在当前价格之下,约有约1200万美元的多头清算,几乎是其近乎两倍。因此,流动性结构明显更偏向上涨:市场上方的累计流动性约为市场下方的1.8–1.9倍。
📉 在市场下方,附近的多头清算流动性主要集中在 0.003467–0.003377。值得注意的是,在 0.003422–0.003377 附近出现了明显的集群,其中有多根清算柱大约达到40万–60万美元。再往下,0.003332 区域附近也包含一个接近50万美元的巨大集群。跌破 0.003467 将把注意力转向 0.003422–0.003377。
📈 在市场上方,空头清算流动性从约 0.003572 开始累积,并在 0.00360–0.00366 区间内快速增长;在该区间内,几根清算柱大约达到60万–78万美元。更远处,0.003797 和 0.003887 特别突出,其清算柱接近80万美元,形成了部分最大的看涨侧集群。
🧭 整体结构更利多,因为上方的空头清算敞口几乎是下方的两倍。只要突破 0.003572,就将提高价格向 0.00360–0.00366 区间扫盘的概率;而一旦跌破 0.003467,注意力则会转向 0.003422–0.003377。
#LiquidationMap
🔎 7天清算地图显示,在当前价格之上约有2200万–2300万美元的空头清算;而在当前价格之下,约有约1200万美元的多头清算,几乎是其近乎两倍。因此,流动性结构明显更偏向上涨:市场上方的累计流动性约为市场下方的1.8–1.9倍。
📉 在市场下方,附近的多头清算流动性主要集中在 0.003467–0.003377。值得注意的是,在 0.003422–0.003377 附近出现了明显的集群,其中有多根清算柱大约达到40万–60万美元。再往下,0.003332 区域附近也包含一个接近50万美元的巨大集群。跌破 0.003467 将把注意力转向 0.003422–0.003377。
📈 在市场上方,空头清算流动性从约 0.003572 开始累积,并在 0.00360–0.00366 区间内快速增长;在该区间内,几根清算柱大约达到60万–78万美元。更远处,0.003797 和 0.003887 特别突出,其清算柱接近80万美元,形成了部分最大的看涨侧集群。
🧭 整体结构更利多,因为上方的空头清算敞口几乎是下方的两倍。只要突破 0.003572,就将提高价格向 0.00360–0.00366 区间扫盘的概率;而一旦跌破 0.003467,注意力则会转向 0.003422–0.003377。
#LiquidationMap
1
23
·
--
看涨
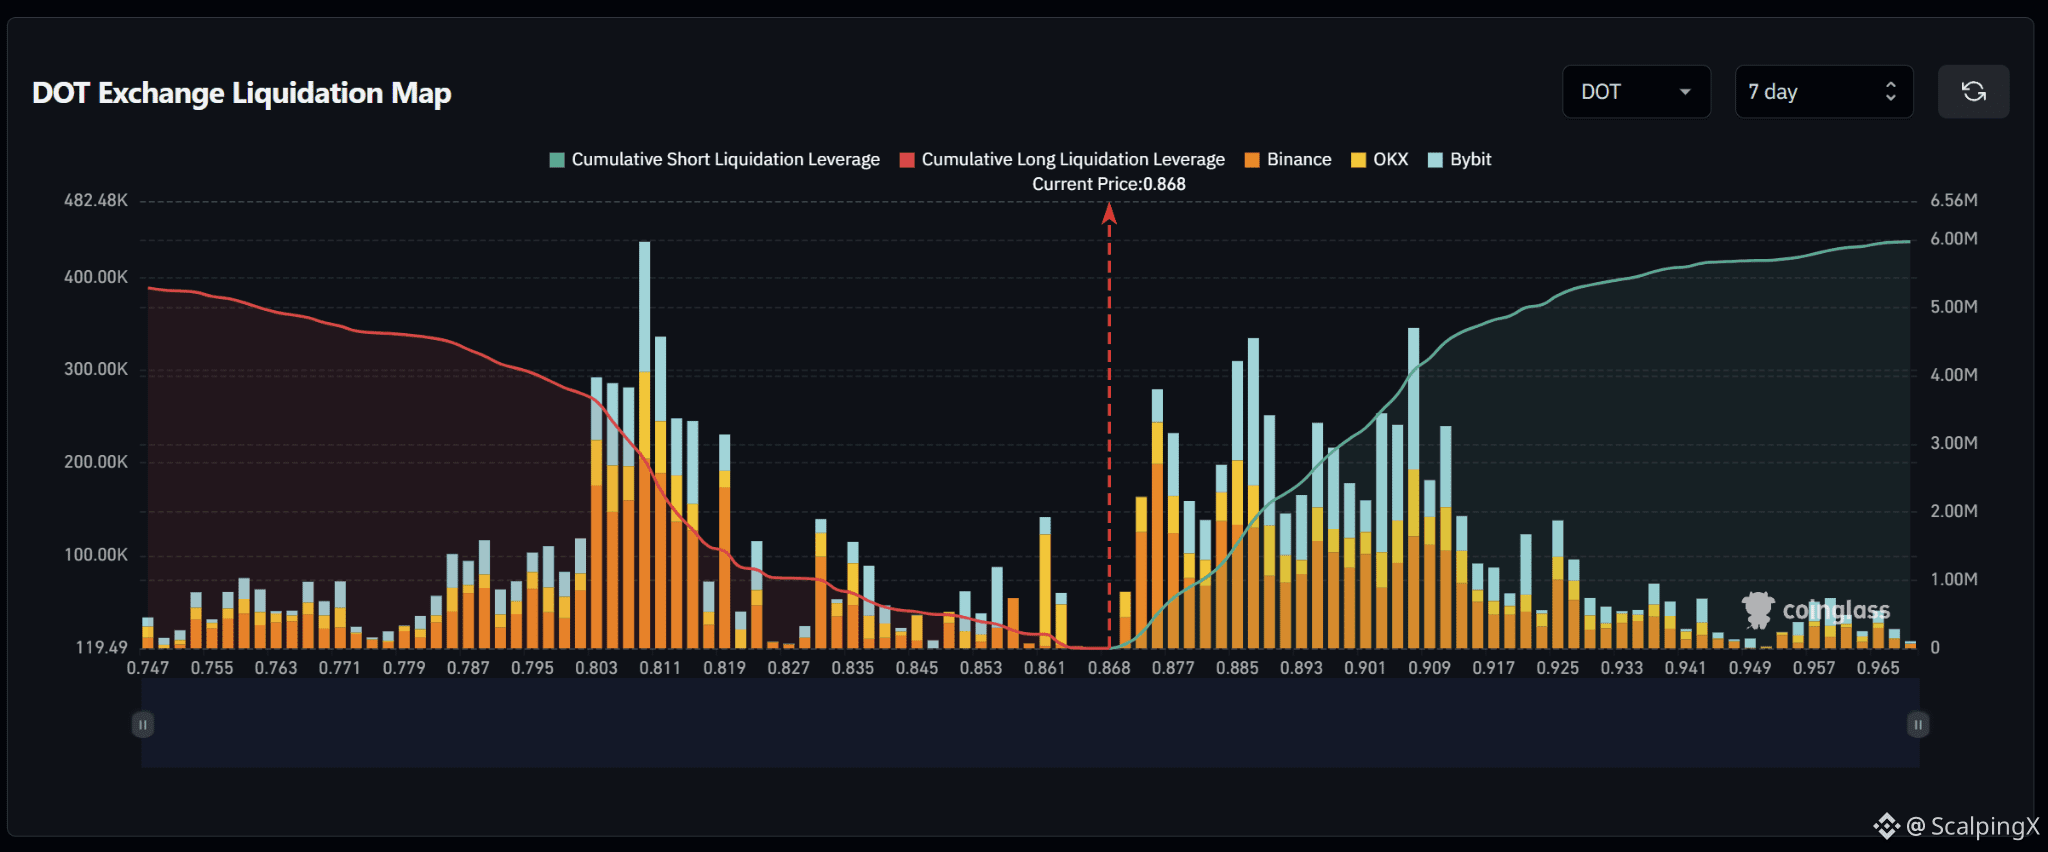
$DOT – 清算地图(7天)– 当前价格 0.868
🔎 7天清算地图显示,当前价格上方约有600万美元的做空清算,略高于当前价格下方约530万美元的做多清算。因此整体结构相对均衡,但略微偏向上行。
📉 在市场下方,附近的做多清算流动性相对偏薄,集中在0.861–0.845;随后在0.835–0.803区间内逐步增加。最强的聚集点在0.811附近,清算柱超过40万美元;而0.803–0.819区间也包含若干20万–30万美元的聚集簇。跌破0.861将使关注点转向0.853–0.835。
📈 在市场上方,做空清算流动性大约从0.877开始积累,并在0.885–0.909区间内变得更为密集。最强的聚集簇出现在0.885和0.909附近,规模约为30万–35万美元。更远处,0.917–0.925也包含显著的流动性。
🧭 整体布局略微有利于上行,因为上方的做空清算敞口更大。跌破0.877将提高价格向0.885–0.909区间进行扫荡的概率;而失守0.861则会把关注点转向0.853–0.835。
#LiquidationMap
$DOT – 清算地图(7天)– 当前价格 0.868
🔎 7天清算地图显示,当前价格上方约有600万美元的做空清算,略高于当前价格下方约530万美元的做多清算。因此整体结构相对均衡,但略微偏向上行。
📉 在市场下方,附近的做多清算流动性相对偏薄,集中在0.861–0.845;随后在0.835–0.803区间内逐步增加。最强的聚集点在0.811附近,清算柱超过40万美元;而0.803–0.819区间也包含若干20万–30万美元的聚集簇。跌破0.861将使关注点转向0.853–0.835。
📈 在市场上方,做空清算流动性大约从0.877开始积累,并在0.885–0.909区间内变得更为密集。最强的聚集簇出现在0.885和0.909附近,规模约为30万–35万美元。更远处,0.917–0.925也包含显著的流动性。
🧭 整体布局略微有利于上行,因为上方的做空清算敞口更大。跌破0.877将提高价格向0.885–0.909区间进行扫荡的概率;而失守0.861则会把关注点转向0.853–0.835。
#LiquidationMap
🔎 7天清算地图显示,当前价格上方约有600万美元的做空清算,略高于当前价格下方约530万美元的做多清算。因此整体结构相对均衡,但略微偏向上行。
📉 在市场下方,附近的做多清算流动性相对偏薄,集中在0.861–0.845;随后在0.835–0.803区间内逐步增加。最强的聚集点在0.811附近,清算柱超过40万美元;而0.803–0.819区间也包含若干20万–30万美元的聚集簇。跌破0.861将使关注点转向0.853–0.835。
📈 在市场上方,做空清算流动性大约从0.877开始积累,并在0.885–0.909区间内变得更为密集。最强的聚集簇出现在0.885和0.909附近,规模约为30万–35万美元。更远处,0.917–0.925也包含显著的流动性。
🧭 整体布局略微有利于上行,因为上方的做空清算敞口更大。跌破0.877将提高价格向0.885–0.909区间进行扫荡的概率;而失守0.861则会把关注点转向0.853–0.835。
#LiquidationMap
40
·
--
看涨
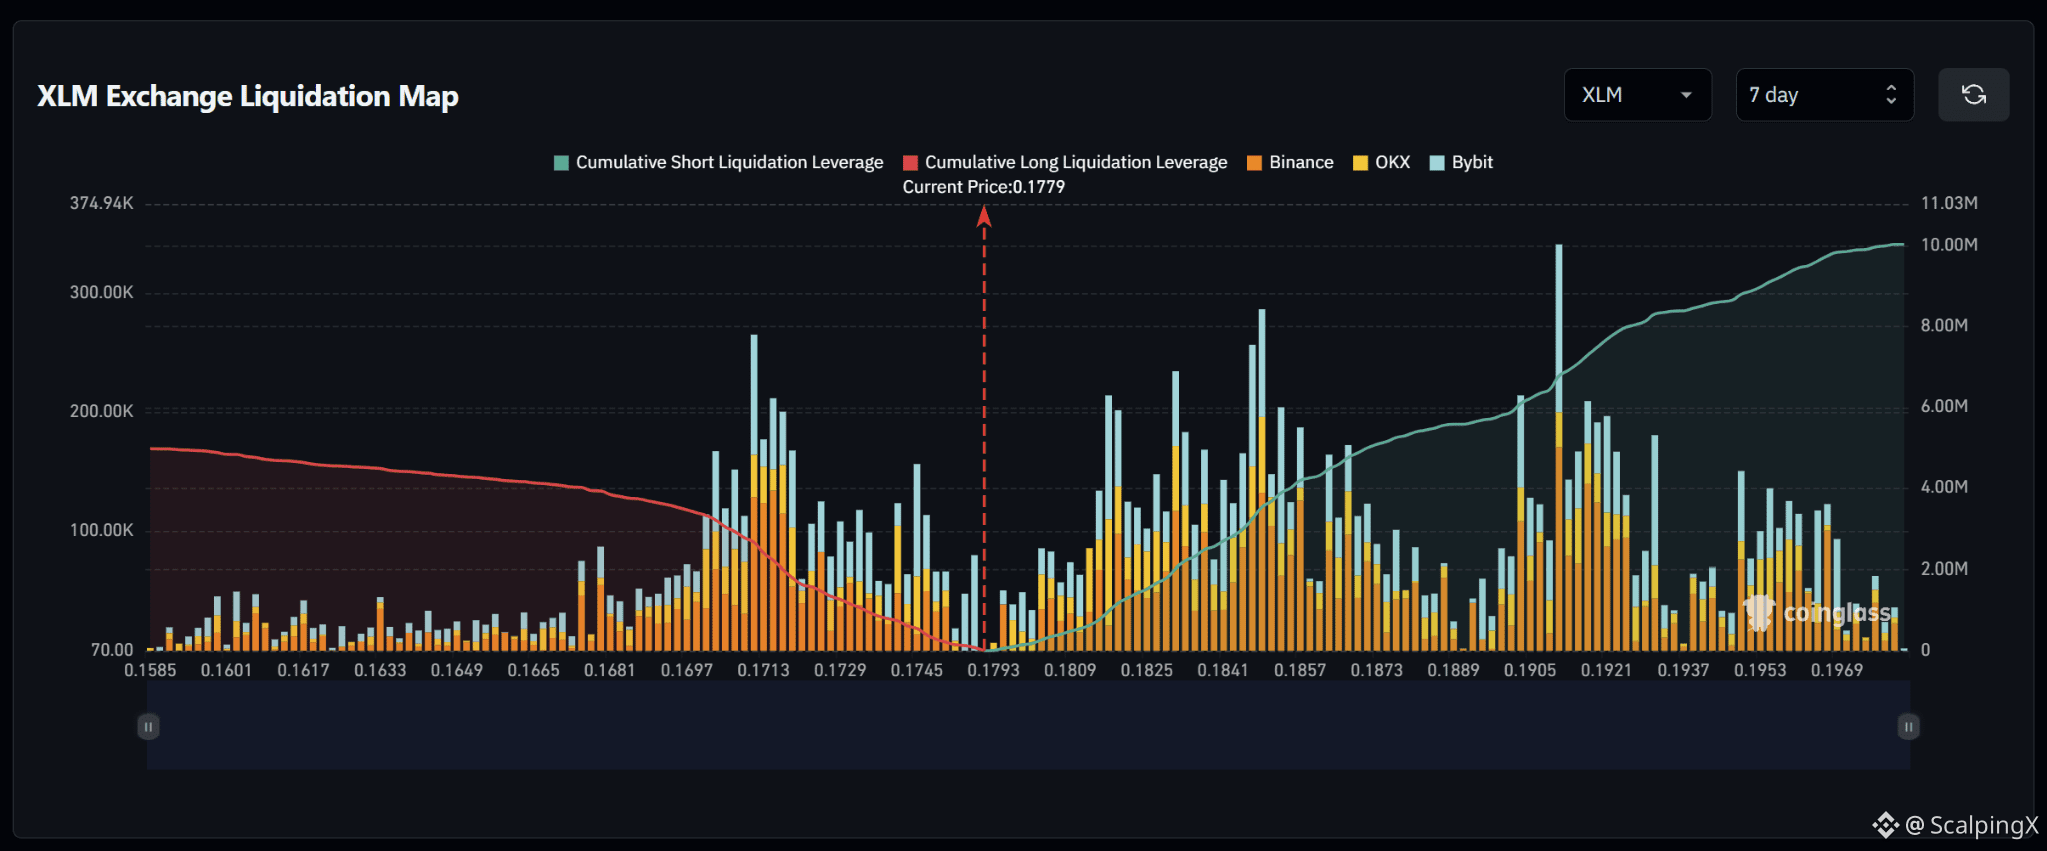
$XLM – 强制平仓地图(7天)– 当前价格 0.1779
🔎 7天强制平仓地图显示:在当前价格之上,约有1,000万美元的做空强平;而在当前价格之下,约有500万美元的做多强平。整体流动性结构明显更偏向上涨。
📉 在市场下方,附近的做多强平流动性主要集中在 0.1745–0.1713。最强的聚集区在 0.1713 附近,此处强平柱大约达到 25万–27万美元;另外 0.1697–0.1681 也包含可观的流动性。跌破 0.1745 将提高向 0.1729–0.1713 扫盘的概率。
📈 在市场上方,做空强平流动性从 0.1809 附近开始累积,并在 0.1825–0.1857 区间内逐渐变得更密集。更远处,0.1905–0.1921 更加突出,其中 0.1905 附近的最大柱体超过 30万美元。若突破 0.1809,0.1825–0.1857 将首先进入视线。
🧭 整体结构偏向上涨:因为当前价格上方的做空强平敞口几乎是下方的两倍。突破 0.1809 将提高向 0.1825–0.1857 扫盘的概率;而跌破 0.1745 则会把注意力转向 0.1729–0.1713。
#LiquidationMap
$XLM – 强制平仓地图(7天)– 当前价格 0.1779
🔎 7天强制平仓地图显示:在当前价格之上,约有1,000万美元的做空强平;而在当前价格之下,约有500万美元的做多强平。整体流动性结构明显更偏向上涨。
📉 在市场下方,附近的做多强平流动性主要集中在 0.1745–0.1713。最强的聚集区在 0.1713 附近,此处强平柱大约达到 25万–27万美元;另外 0.1697–0.1681 也包含可观的流动性。跌破 0.1745 将提高向 0.1729–0.1713 扫盘的概率。
📈 在市场上方,做空强平流动性从 0.1809 附近开始累积,并在 0.1825–0.1857 区间内逐渐变得更密集。更远处,0.1905–0.1921 更加突出,其中 0.1905 附近的最大柱体超过 30万美元。若突破 0.1809,0.1825–0.1857 将首先进入视线。
🧭 整体结构偏向上涨:因为当前价格上方的做空强平敞口几乎是下方的两倍。突破 0.1809 将提高向 0.1825–0.1857 扫盘的概率;而跌破 0.1745 则会把注意力转向 0.1729–0.1713。
#LiquidationMap
🔎 7天强制平仓地图显示:在当前价格之上,约有1,000万美元的做空强平;而在当前价格之下,约有500万美元的做多强平。整体流动性结构明显更偏向上涨。
📉 在市场下方,附近的做多强平流动性主要集中在 0.1745–0.1713。最强的聚集区在 0.1713 附近,此处强平柱大约达到 25万–27万美元;另外 0.1697–0.1681 也包含可观的流动性。跌破 0.1745 将提高向 0.1729–0.1713 扫盘的概率。
📈 在市场上方,做空强平流动性从 0.1809 附近开始累积,并在 0.1825–0.1857 区间内逐渐变得更密集。更远处,0.1905–0.1921 更加突出,其中 0.1905 附近的最大柱体超过 30万美元。若突破 0.1809,0.1825–0.1857 将首先进入视线。
🧭 整体结构偏向上涨:因为当前价格上方的做空强平敞口几乎是下方的两倍。突破 0.1809 将提高向 0.1825–0.1857 扫盘的概率;而跌破 0.1745 则会把注意力转向 0.1729–0.1713。
#LiquidationMap
22
·
--
看涨
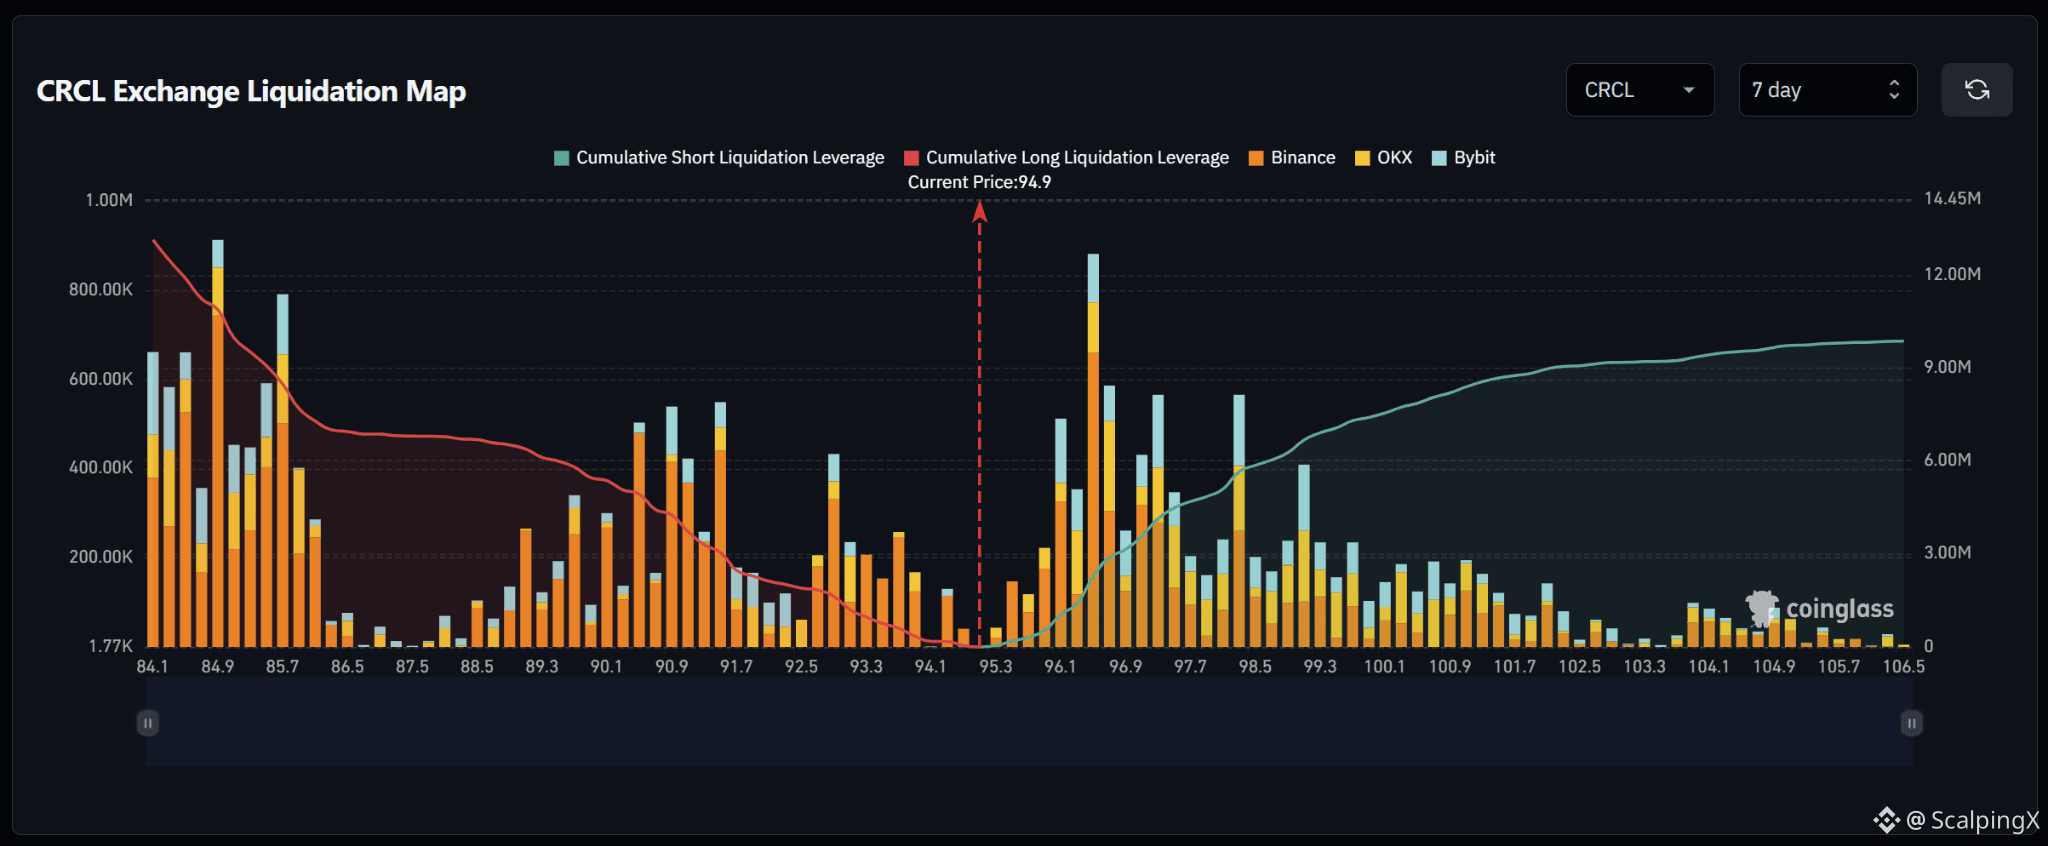
$CRCL – 清算地图(7天)– 当前价格 94.9
🔎 7天清算地图显示,在当前价格下方约有1300万美元的多头清算,而在当前价格上方约有900–1000万美元的空头清算。由于流动性结构偏向下行,多头累积流动性大约是市场下方的1.3–1.4倍。
📉 在市场下方,临近的多头清算流动性在94.1附近相对偏薄,然后在93.3–92.5区间逐步增厚。再往下,91.7–90.1包含若干簇,集中在约30万–55万美元。跌破94.1将提高向93.3–92.5区间扫盘的概率。
📈 在市场上方,空头清算流动性从95.3–96.1开始构建,并在96.1–96.9区间内快速增加。最强的附近聚集点位于96.5附近,此处清算柱接近90万美元。更远处,97.7–99.3同样包含显著的流动性。若上破95.3,96.1–96.9将首先进入关注。
🧭 整体格局略微偏向下行,因为市场下方的多头清算敞口大约是1.3–1.4倍。跌破94.1将提高向93.3–92.5扫盘的概率,而上破95.3则会将注意力转向96.1–96.9。
#LiquidationMap
$CRCL – 清算地图(7天)– 当前价格 94.9
🔎 7天清算地图显示,在当前价格下方约有1300万美元的多头清算,而在当前价格上方约有900–1000万美元的空头清算。由于流动性结构偏向下行,多头累积流动性大约是市场下方的1.3–1.4倍。
📉 在市场下方,临近的多头清算流动性在94.1附近相对偏薄,然后在93.3–92.5区间逐步增厚。再往下,91.7–90.1包含若干簇,集中在约30万–55万美元。跌破94.1将提高向93.3–92.5区间扫盘的概率。
📈 在市场上方,空头清算流动性从95.3–96.1开始构建,并在96.1–96.9区间内快速增加。最强的附近聚集点位于96.5附近,此处清算柱接近90万美元。更远处,97.7–99.3同样包含显著的流动性。若上破95.3,96.1–96.9将首先进入关注。
🧭 整体格局略微偏向下行,因为市场下方的多头清算敞口大约是1.3–1.4倍。跌破94.1将提高向93.3–92.5扫盘的概率,而上破95.3则会将注意力转向96.1–96.9。
#LiquidationMap
🔎 7天清算地图显示,在当前价格下方约有1300万美元的多头清算,而在当前价格上方约有900–1000万美元的空头清算。由于流动性结构偏向下行,多头累积流动性大约是市场下方的1.3–1.4倍。
📉 在市场下方,临近的多头清算流动性在94.1附近相对偏薄,然后在93.3–92.5区间逐步增厚。再往下,91.7–90.1包含若干簇,集中在约30万–55万美元。跌破94.1将提高向93.3–92.5区间扫盘的概率。
📈 在市场上方,空头清算流动性从95.3–96.1开始构建,并在96.1–96.9区间内快速增加。最强的附近聚集点位于96.5附近,此处清算柱接近90万美元。更远处,97.7–99.3同样包含显著的流动性。若上破95.3,96.1–96.9将首先进入关注。
🧭 整体格局略微偏向下行,因为市场下方的多头清算敞口大约是1.3–1.4倍。跌破94.1将提高向93.3–92.5扫盘的概率,而上破95.3则会将注意力转向96.1–96.9。
#LiquidationMap
24
·
--
看涨
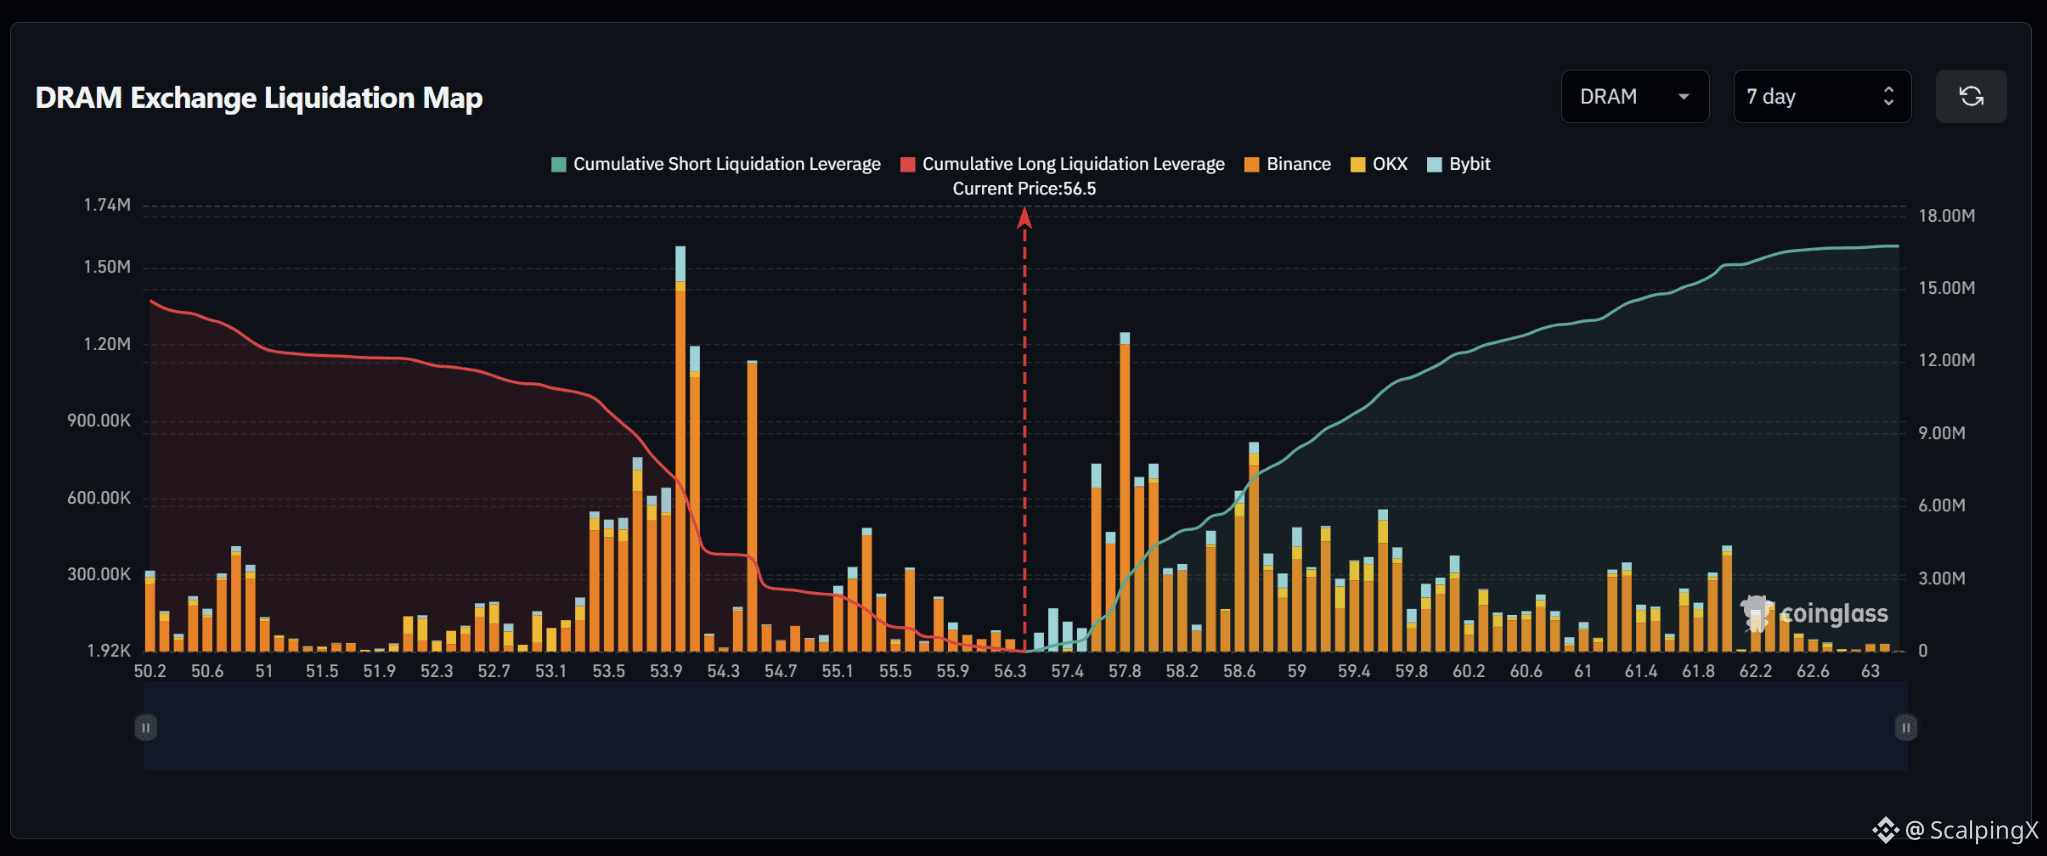
$DRAM – 清算地图(7天)– 当前价格 56.5
🔎 7天清算地图显示,在当前价格上方的约1600万美元空头清算,略高于当前价格下方约1400–1500万美元多头清算。整体结构因此相对均衡,但略微偏向上行。
📉 在市场下方,附近的多头清算流动性主要集中在55.9–55.1,随后在54.7–53.5区间变得密集得多。最强的集群位于53.9–54.3附近,这里最大的清算柱约达160万美元。若跌破55.9,将提高向55.1–54.7扫荡的概率,然后更大的下行流动性集群才会进入视野。
📈 在市场上方,空头清算流动性从57.4附近开始建立,并在57.8–58.6区间内迅速上升。57.8这一集群尤为突出,其清算柱高于120万美元,而58.6处也包含显著的流动性。更远处的59.0–59.8仍维持相对密集的流动性。
🧭 更广泛的格局整体上略微利好上行,因为上方的空头清算敞口更大。跌破57.4将提高向57.8–58.6扫荡的概率,而失守55.9则会把注意力转向55.1–54.7。
#LiquidationMap
$DRAM – 清算地图(7天)– 当前价格 56.5
🔎 7天清算地图显示,在当前价格上方的约1600万美元空头清算,略高于当前价格下方约1400–1500万美元多头清算。整体结构因此相对均衡,但略微偏向上行。
📉 在市场下方,附近的多头清算流动性主要集中在55.9–55.1,随后在54.7–53.5区间变得密集得多。最强的集群位于53.9–54.3附近,这里最大的清算柱约达160万美元。若跌破55.9,将提高向55.1–54.7扫荡的概率,然后更大的下行流动性集群才会进入视野。
📈 在市场上方,空头清算流动性从57.4附近开始建立,并在57.8–58.6区间内迅速上升。57.8这一集群尤为突出,其清算柱高于120万美元,而58.6处也包含显著的流动性。更远处的59.0–59.8仍维持相对密集的流动性。
🧭 更广泛的格局整体上略微利好上行,因为上方的空头清算敞口更大。跌破57.4将提高向57.8–58.6扫荡的概率,而失守55.9则会把注意力转向55.1–54.7。
#LiquidationMap
🔎 7天清算地图显示,在当前价格上方的约1600万美元空头清算,略高于当前价格下方约1400–1500万美元多头清算。整体结构因此相对均衡,但略微偏向上行。
📉 在市场下方,附近的多头清算流动性主要集中在55.9–55.1,随后在54.7–53.5区间变得密集得多。最强的集群位于53.9–54.3附近,这里最大的清算柱约达160万美元。若跌破55.9,将提高向55.1–54.7扫荡的概率,然后更大的下行流动性集群才会进入视野。
📈 在市场上方,空头清算流动性从57.4附近开始建立,并在57.8–58.6区间内迅速上升。57.8这一集群尤为突出,其清算柱高于120万美元,而58.6处也包含显著的流动性。更远处的59.0–59.8仍维持相对密集的流动性。
🧭 更广泛的格局整体上略微利好上行,因为上方的空头清算敞口更大。跌破57.4将提高向57.8–58.6扫荡的概率,而失守55.9则会把注意力转向55.1–54.7。
#LiquidationMap
66
·
--
看涨
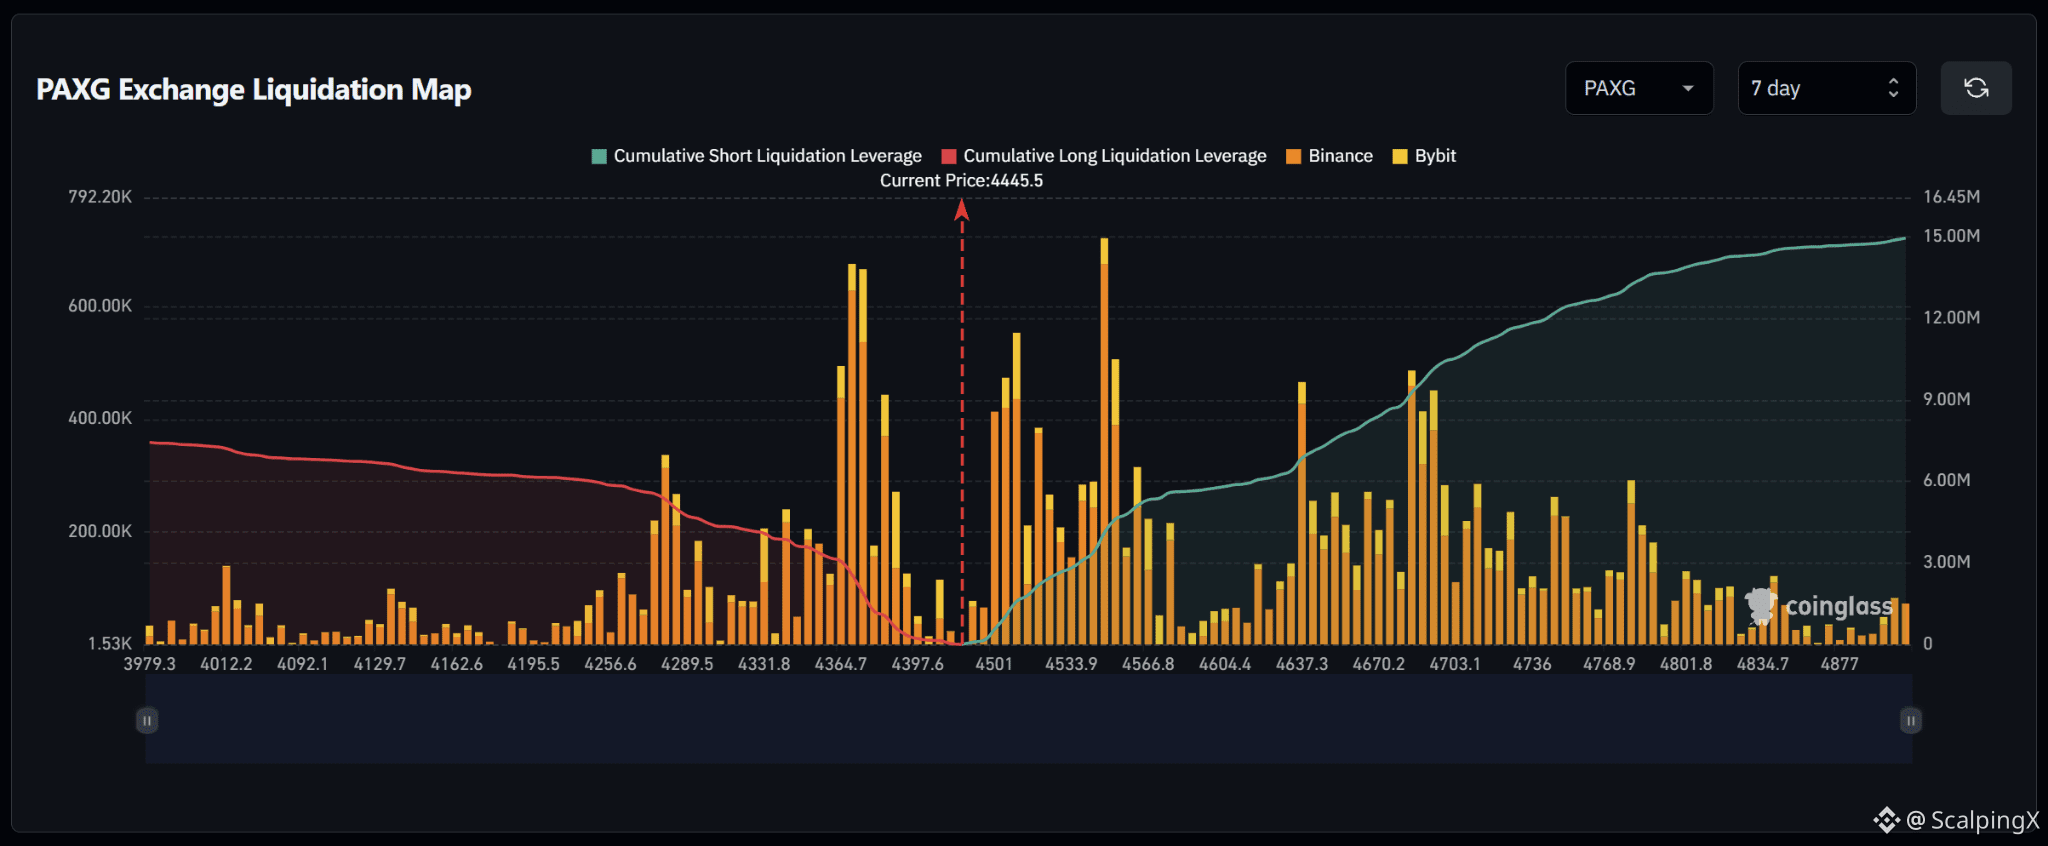
$PAXG – 清算地图(7天)– 当前价格 4,445.5
🔎 7天清算地图显示,在当前价格之上约有1,500万美元的做空清算,显著高于当前价格下方约650万–700万美元的做多清算。因此,流动性结构明显偏向上行:市场上方的累计流动性大约是市场下方的2.2倍。
📉 在市场下方,做多清算流动性主要集中在4,397.6–4,364.7。最强的聚集点位于4,364.7附近,在那里清算柱大约达到65万–70万美元;而4,331.8–4,289.5同样包含显著的流动性。跌破4,397.6将提高向4,364.7–4,331.8区间扫荡的概率。
📈 在市场上方,做空清算流动性从4,501开始逐步累积,并在4,533.9–4,566.8区间快速增加。最强的聚集点出现在4,550附近,此处清算柱超过70万美元。更远处的4,637.3–4,703.1同样包含大量流动性。若突破4,501,下一步将把焦点带到4,533.9–4,566.8。
🧭 整体结构偏向上行,因为上方的做空清算敞口大约是下方的2.2倍。突破4,501将提高向4,533.9–4,566.8区间扫荡的概率;而跌破4,397.6则会把注意力转向4,364.7–4,331.8。
#LiquidationMap
$PAXG – 清算地图(7天)– 当前价格 4,445.5
🔎 7天清算地图显示,在当前价格之上约有1,500万美元的做空清算,显著高于当前价格下方约650万–700万美元的做多清算。因此,流动性结构明显偏向上行:市场上方的累计流动性大约是市场下方的2.2倍。
📉 在市场下方,做多清算流动性主要集中在4,397.6–4,364.7。最强的聚集点位于4,364.7附近,在那里清算柱大约达到65万–70万美元;而4,331.8–4,289.5同样包含显著的流动性。跌破4,397.6将提高向4,364.7–4,331.8区间扫荡的概率。
📈 在市场上方,做空清算流动性从4,501开始逐步累积,并在4,533.9–4,566.8区间快速增加。最强的聚集点出现在4,550附近,此处清算柱超过70万美元。更远处的4,637.3–4,703.1同样包含大量流动性。若突破4,501,下一步将把焦点带到4,533.9–4,566.8。
🧭 整体结构偏向上行,因为上方的做空清算敞口大约是下方的2.2倍。突破4,501将提高向4,533.9–4,566.8区间扫荡的概率;而跌破4,397.6则会把注意力转向4,364.7–4,331.8。
#LiquidationMap
🔎 7天清算地图显示,在当前价格之上约有1,500万美元的做空清算,显著高于当前价格下方约650万–700万美元的做多清算。因此,流动性结构明显偏向上行:市场上方的累计流动性大约是市场下方的2.2倍。
📉 在市场下方,做多清算流动性主要集中在4,397.6–4,364.7。最强的聚集点位于4,364.7附近,在那里清算柱大约达到65万–70万美元;而4,331.8–4,289.5同样包含显著的流动性。跌破4,397.6将提高向4,364.7–4,331.8区间扫荡的概率。
📈 在市场上方,做空清算流动性从4,501开始逐步累积,并在4,533.9–4,566.8区间快速增加。最强的聚集点出现在4,550附近,此处清算柱超过70万美元。更远处的4,637.3–4,703.1同样包含大量流动性。若突破4,501,下一步将把焦点带到4,533.9–4,566.8。
🧭 整体结构偏向上行,因为上方的做空清算敞口大约是下方的2.2倍。突破4,501将提高向4,533.9–4,566.8区间扫荡的概率;而跌破4,397.6则会把注意力转向4,364.7–4,331.8。
#LiquidationMap
26
登录解锁更多内容
加入币安广场,与全球加密货币用户互动
⚡️ 获取关于加密货币的最新实用信息。
💬 受到全球最大加密货币交易平台的信赖。
👍 发现来自认证创作者的真知灼见。
邮箱/手机号码
热门话题
1
#英国FCA获法院令追缴85.1万英镑
30,478 次浏览
139 人讨论中
2
#Chainlink上线CCIP2支持企业验证
44,860 次浏览
168 人讨论中
3
#黄金跌至4144美元
156,785 次浏览
501 人讨论中
4
#QNT从日内高点回落逾40%
61,436 次浏览
259 人讨论中
5
#USDT一周新增84.59万持有者
15,668 次浏览
62 人讨论中
6
#韩股Kospi指数跌2.7%三星SK海力士跌超5%
57,111 次浏览
148 人讨论中
7
#Bitget确认3.88亿美元资产被盗
118,930 次浏览
158 人讨论中
8
#比特币跌破8.3万美元
189,873 次浏览
658 人讨论中
9
#Bitget公布安全事件时间线
41,481 次浏览
84 人讨论中
10
#比特币现货ETF周净流入23.9亿美元
49,284 次浏览
184 人讨论中