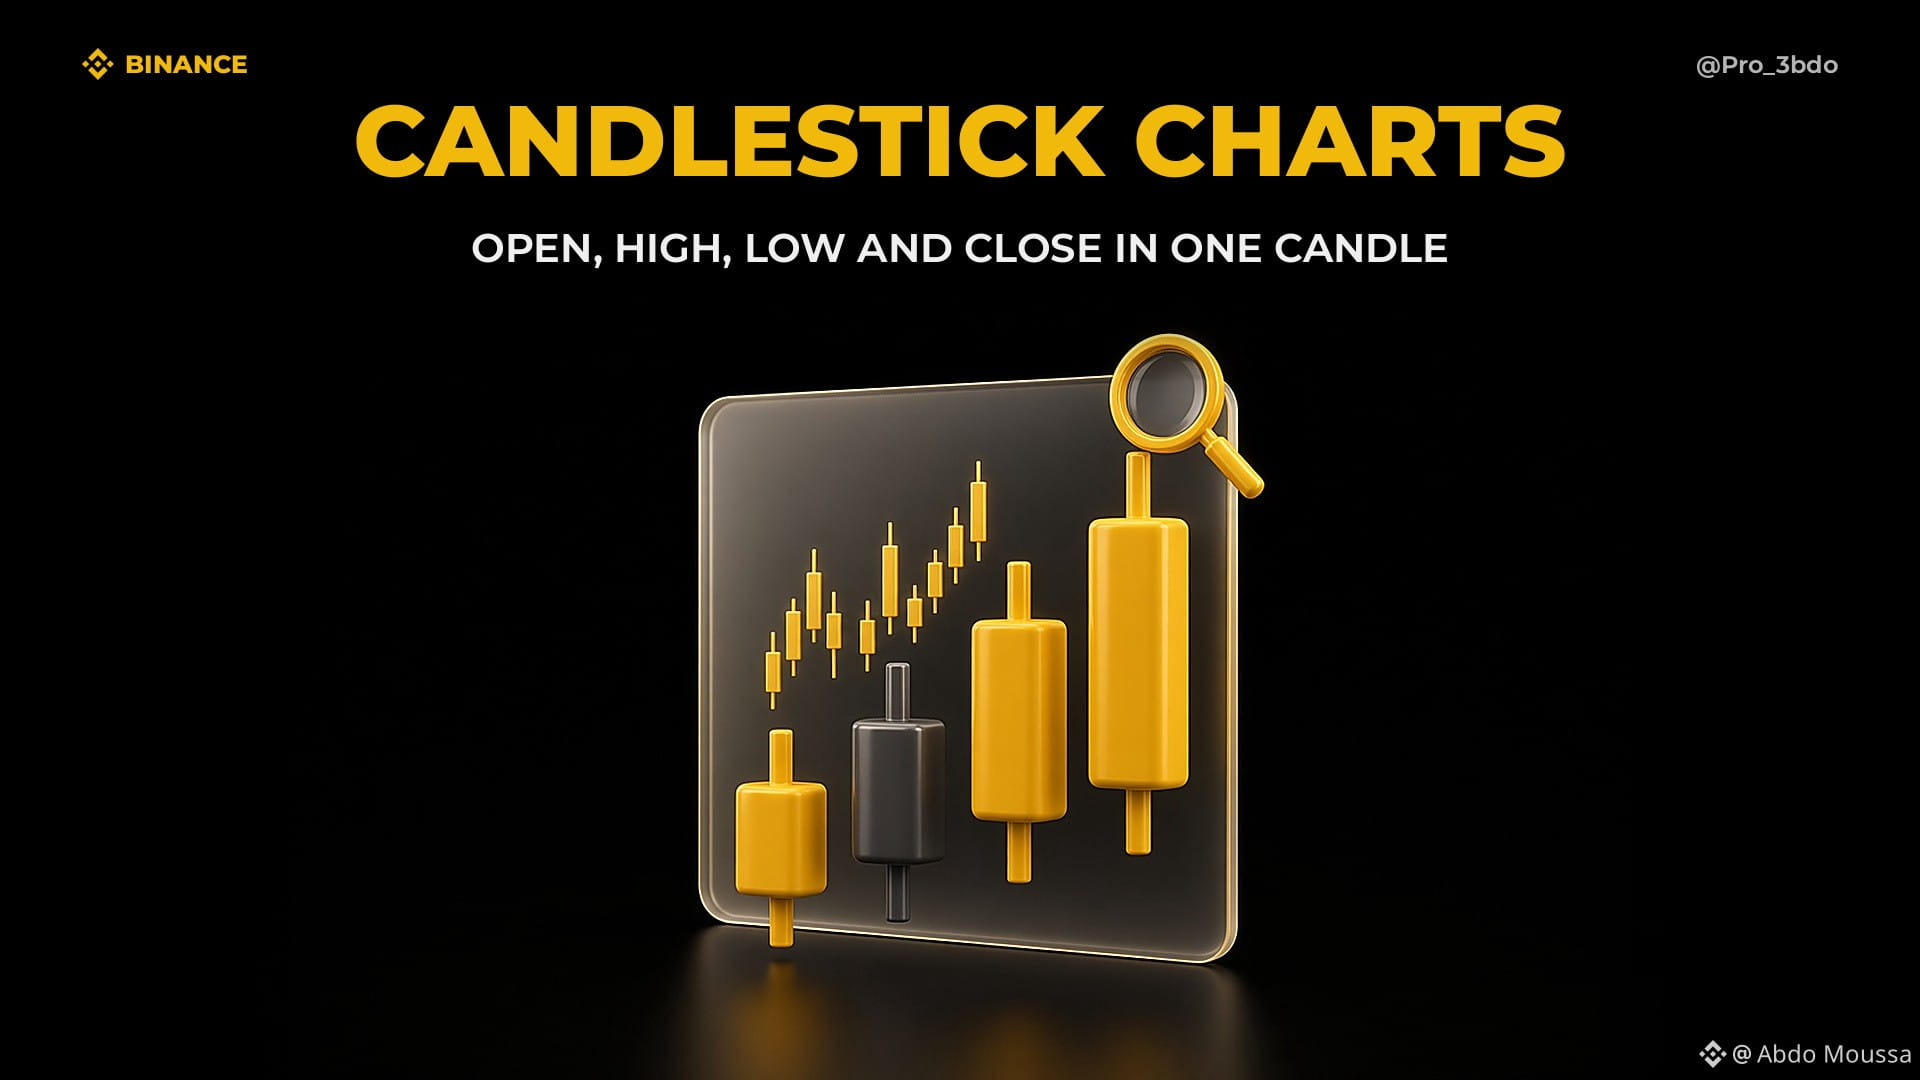
𝐄𝐯𝐞𝐫 𝐥𝐨𝐨𝐤𝐞𝐝 𝐚𝐭 𝐚 𝐜𝐡𝐚𝐫𝐭 𝐟𝐮𝐥𝐥 𝐨𝐟 𝐠𝐫𝐞𝐞𝐧 𝐚𝐧𝐝 𝐫𝐞𝐝 𝐜𝐚𝐧𝐝𝐥𝐞𝐬 𝐚𝐧𝐝 𝐰𝐨𝐧𝐝𝐞𝐫𝐞𝐝 𝐰𝐡𝐚𝐭 𝐭𝐡𝐞𝐲'𝐫𝐞 𝐚𝐜𝐭𝐮𝐚𝐥𝐥𝐲 𝐭𝐞𝐥𝐥𝐢𝐧𝐠 𝐲𝐨𝐮? 𝐄𝐧𝐭𝐞𝐫 𝐂𝐚𝐧𝐝𝐥𝐞𝐬𝐭𝐢𝐜𝐤 𝐂𝐡𝐚𝐫𝐭𝐬 🕯️📊
𝐷𝑟𝑎𝑤𝑖𝑛𝑔 𝑓𝑟𝑜𝑚 𝑓𝑜𝑢𝑛𝑑𝑎𝑡𝑖𝑜𝑛𝑎𝑙 𝑙𝑒𝑠𝑠𝑜𝑛𝑠 𝑜𝑛 #BinanceAcademy, ℎ𝑒𝑟𝑒 𝑖𝑠 𝑦𝑜𝑢𝑟 𝑞𝑢𝑖𝑐𝑘 𝐶𝑎𝑛𝑑𝑙𝑒𝑠𝑡𝑖𝑐𝑘 𝐶ℎ𝑎𝑟𝑡𝑠 𝑏𝑟𝑒𝑎𝑘𝑑𝑜𝑤𝑛:
1️⃣ 𝐅𝐨𝐮𝐫 𝐏𝐫𝐢𝐜𝐞𝐬 𝐈𝐧 𝐎𝐧𝐞 𝐂𝐚𝐧𝐝𝐥𝐞:
• Each candle is built from OHLC data, open, high, low and close, for one timeframe that can range from one second to one year.
2️⃣ 𝐁𝐨𝐝𝐲, 𝐖𝐢𝐜𝐤𝐬 𝐀𝐧𝐝 𝐂𝐨𝐥𝐨𝐫:
• The body spans the open to the close, the wicks mark the high and low, green usually means price closed above the open and red means it closed below.
3️⃣ 𝐖𝐡𝐚𝐭 𝐀 𝐂𝐚𝐧𝐝𝐥𝐞 𝐂𝐚𝐧'𝐭 𝐓𝐞𝐥𝐥 𝐘𝐨𝐮:
• It doesn't show whether the high or the low came first, short timeframes can be noisy, and Heikin-Ashi candles use averaged data to help smooth trends.
⚠️ 𝐑𝐢𝐬𝐤 𝐍𝐨𝐭𝐞:
Candles show what already happened, they can't predict prices with certainty, so many traders pair them with tools like support and resistance.
Learning to read a single candle changed how I look at every chart, start simple and build from there 💛
📖 Learn more on Binance Academy: https://www.binance.com/en/academy/articles/a-beginners-guide-to-candlestick-charts
Crypto involves risk, this is not financial advice, always DYOR 💡
#CandlestickCharts #TechnicalAnalysis #CryptoBasics
Follow me for more 💛
𝐷𝑟𝑎𝑤𝑖𝑛𝑔 𝑓𝑟𝑜𝑚 𝑓𝑜𝑢𝑛𝑑𝑎𝑡𝑖𝑜𝑛𝑎𝑙 𝑙𝑒𝑠𝑠𝑜𝑛𝑠 𝑜𝑛 #BinanceAcademy, ℎ𝑒𝑟𝑒 𝑖𝑠 𝑦𝑜𝑢𝑟 𝑞𝑢𝑖𝑐𝑘 𝐶𝑎𝑛𝑑𝑙𝑒𝑠𝑡𝑖𝑐𝑘 𝐶ℎ𝑎𝑟𝑡𝑠 𝑏𝑟𝑒𝑎𝑘𝑑𝑜𝑤𝑛:
1️⃣ 𝐅𝐨𝐮𝐫 𝐏𝐫𝐢𝐜𝐞𝐬 𝐈𝐧 𝐎𝐧𝐞 𝐂𝐚𝐧𝐝𝐥𝐞:
• Each candle is built from OHLC data, open, high, low and close, for one timeframe that can range from one second to one year.
2️⃣ 𝐁𝐨𝐝𝐲, 𝐖𝐢𝐜𝐤𝐬 𝐀𝐧𝐝 𝐂𝐨𝐥𝐨𝐫:
• The body spans the open to the close, the wicks mark the high and low, green usually means price closed above the open and red means it closed below.
3️⃣ 𝐖𝐡𝐚𝐭 𝐀 𝐂𝐚𝐧𝐝𝐥𝐞 𝐂𝐚𝐧'𝐭 𝐓𝐞𝐥𝐥 𝐘𝐨𝐮:
• It doesn't show whether the high or the low came first, short timeframes can be noisy, and Heikin-Ashi candles use averaged data to help smooth trends.
⚠️ 𝐑𝐢𝐬𝐤 𝐍𝐨𝐭𝐞:
Candles show what already happened, they can't predict prices with certainty, so many traders pair them with tools like support and resistance.
Learning to read a single candle changed how I look at every chart, start simple and build from there 💛
📖 Learn more on Binance Academy: https://www.binance.com/en/academy/articles/a-beginners-guide-to-candlestick-charts
Crypto involves risk, this is not financial advice, always DYOR 💡
#CandlestickCharts #TechnicalAnalysis #CryptoBasics
Follow me for more 💛