

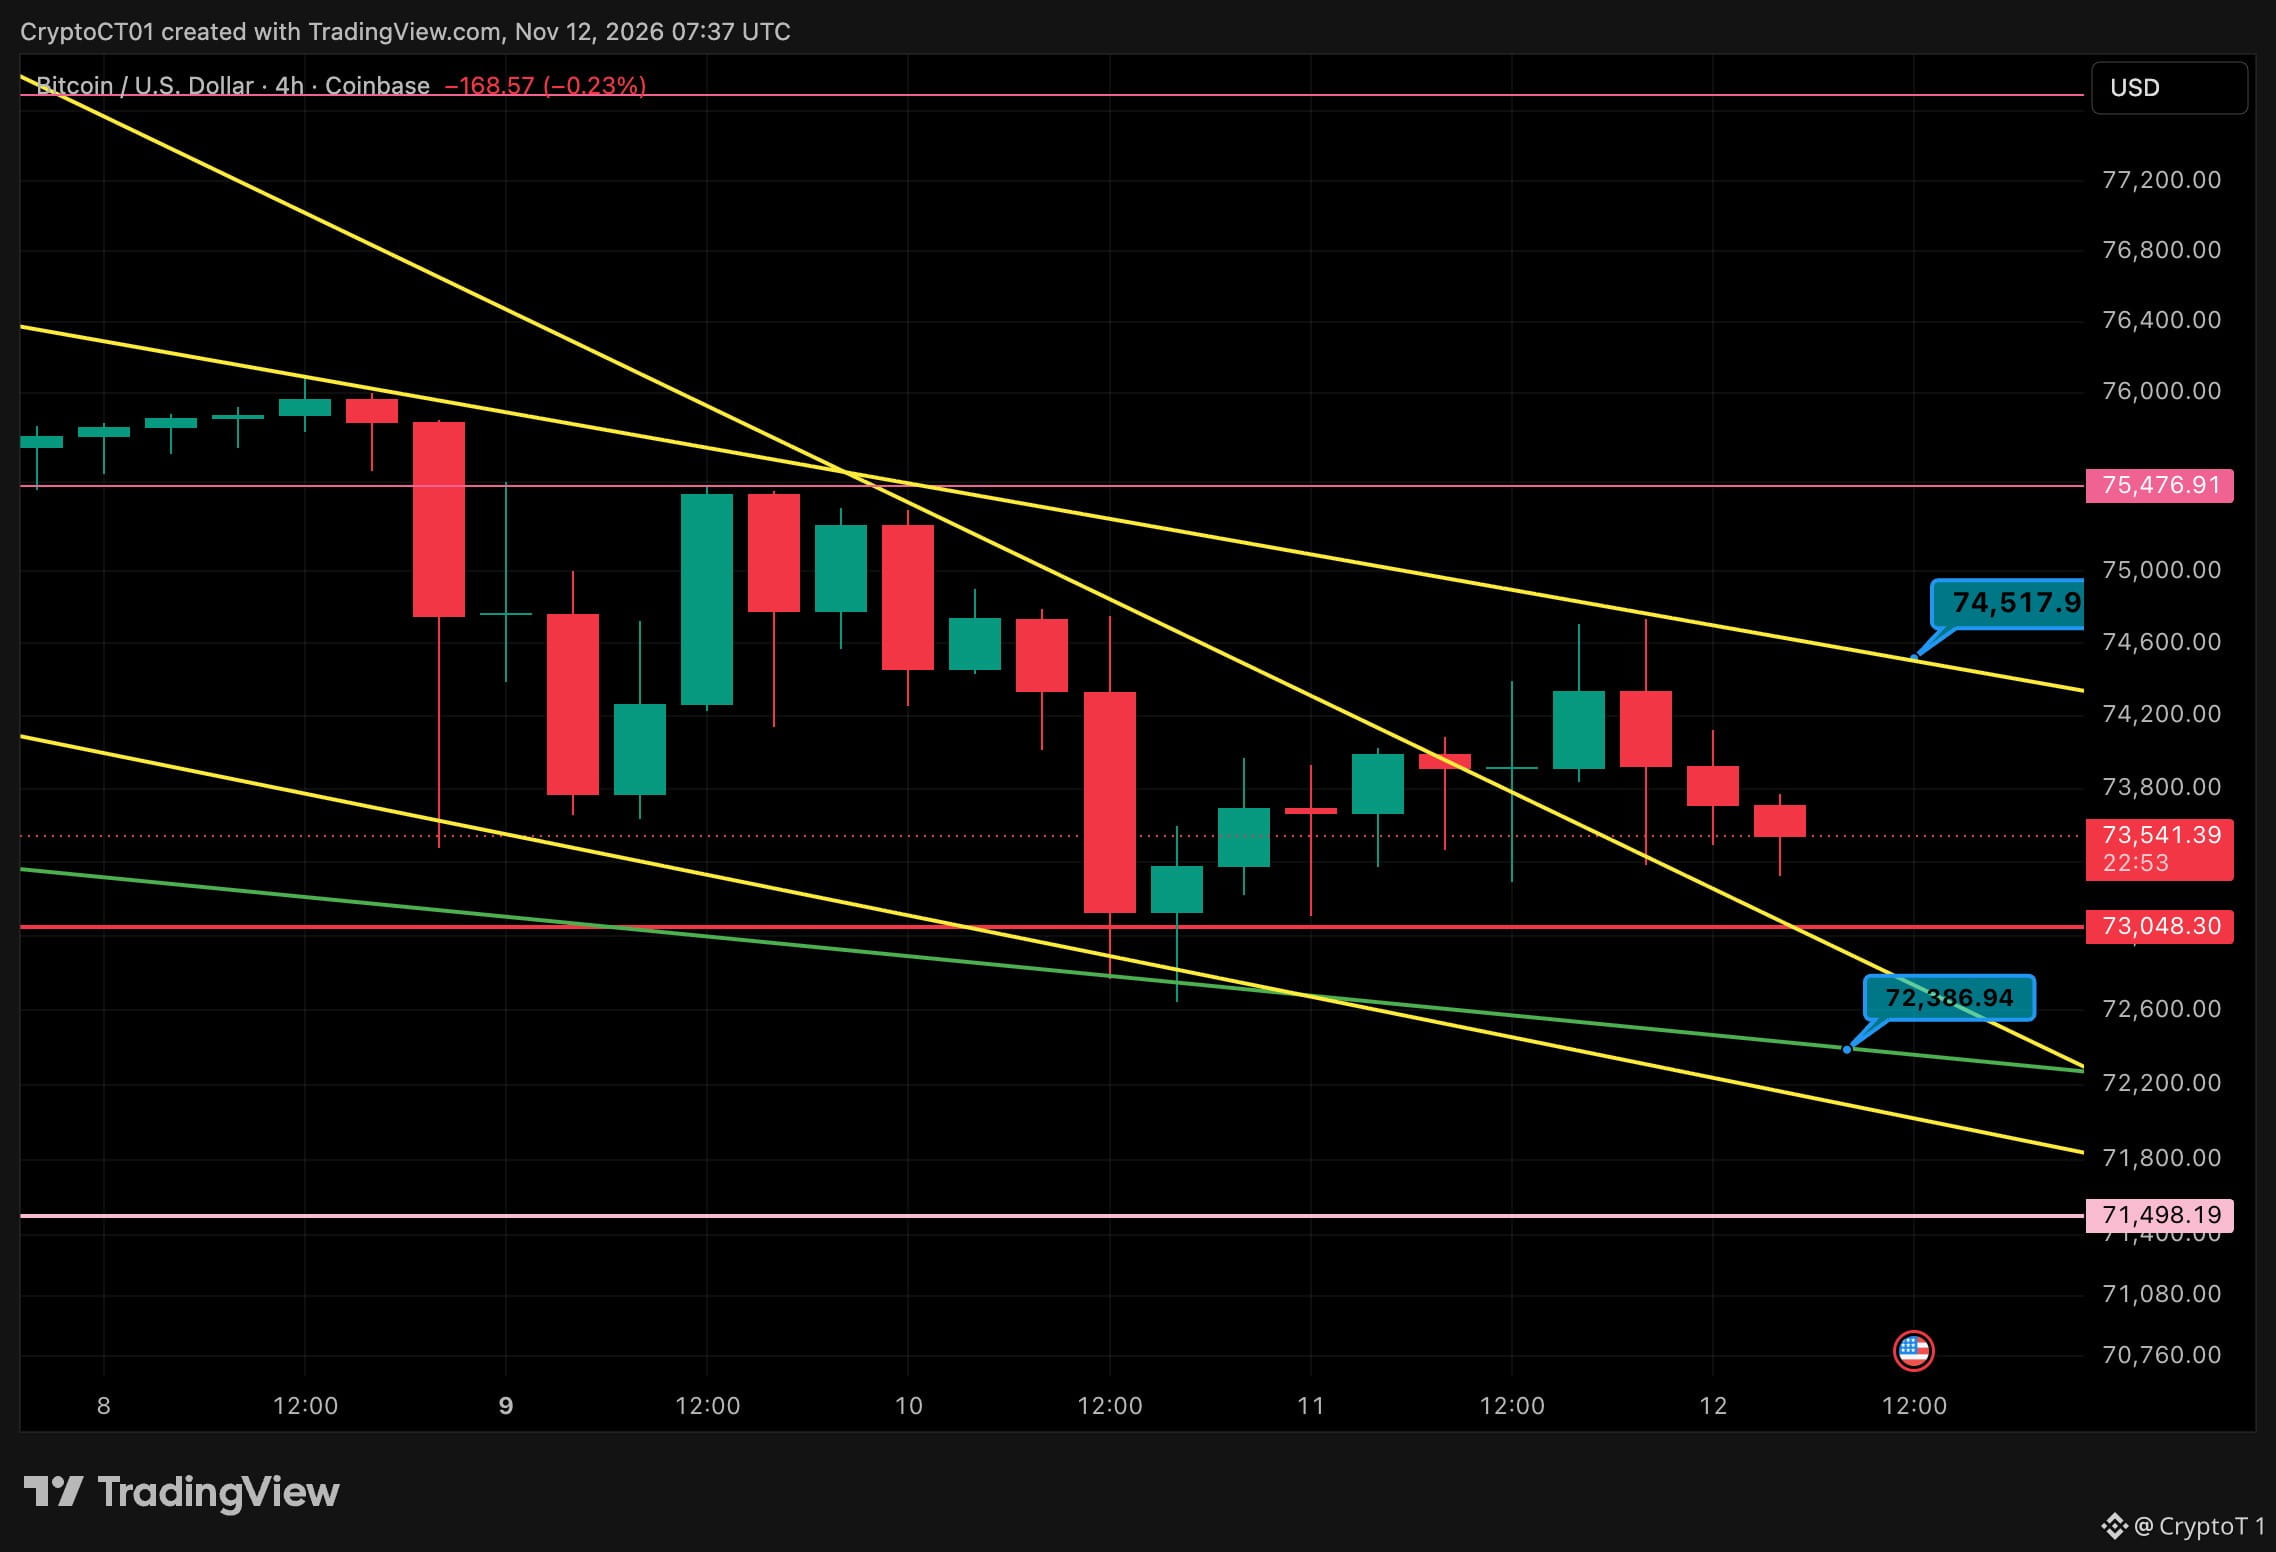
$BTC Stuck Between The Lines 📐 4h chart. Price is at 73.5K, squeezed between the top of the wedge and the steep trendline it broke above yesterday. 🔴 Resistance: 74,517 (wedge top), then 75,477 🟢 Support: 73,048, then 72,387, then 71,498 Context: Five straight days of ETF outflows, MSCI dropping $MSTR , and $BTC has barely moved. It's still holding just above the 200-day average around 73.2K. My read: No chase from here. 74.5K has rejected it twice, so I want a 4h close above it before I lean bullish. That opens 75.5K. Lose 73K and the green trendline at 72.4K is the next real test. Below that I'm watching 71.5K. The risk: This is a squeeze. When it breaks, it moves fast. Let price pick a side first. Break above 74.5K or a flush to 72.4K first? 👇 #BTC #Bitcoin
Tham gia cùng người dùng tiền mã hóa toàn cầu trên Binance Square
⚡️ Nhận thông tin mới nhất và hữu ích về tiền mã hóa.
💬 Được tin cậy bởi sàn giao dịch tiền mã hóa lớn nhất thế giới.
👍 Khám phá những thông tin chuyên sâu thực tế từ những nhà sáng tạo đã xác minh.
Email / Số điện thoại