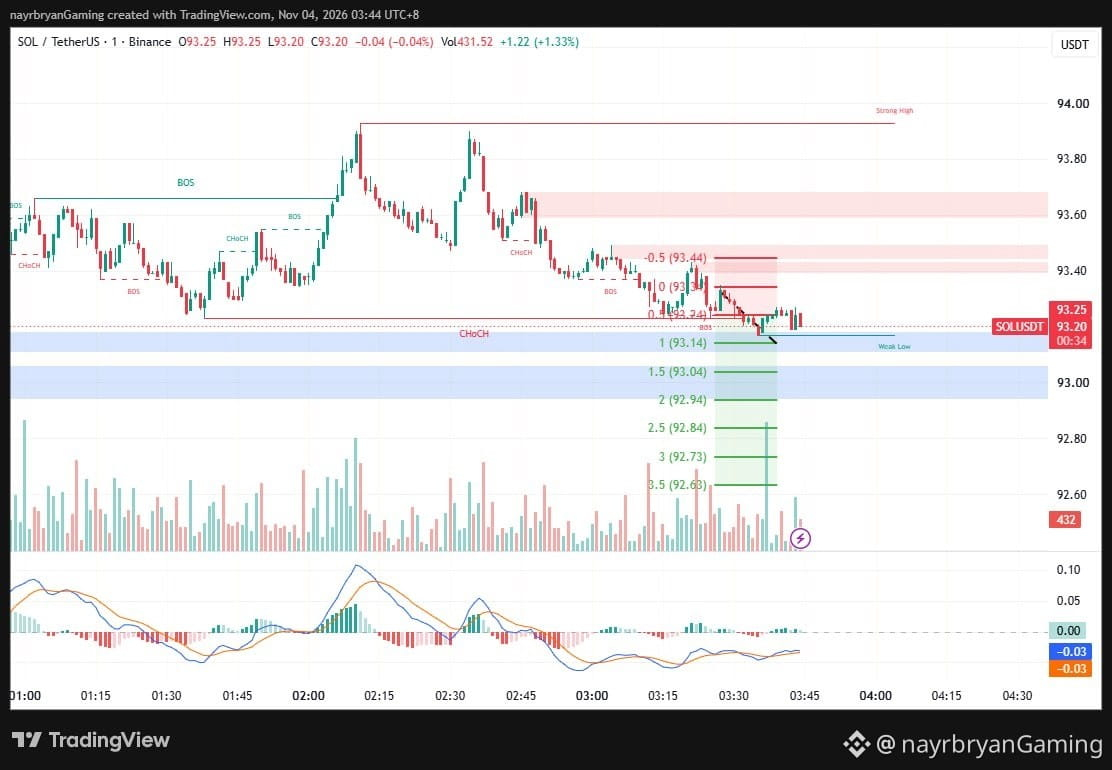
LIGHT ANALYSIS / CHART SETUP — SOL/USDT
📈 STRUCTURE OVERVIEW
Market Phase:
Bearish rejection → Lower highs → Support test
Current Price:
93.20
Immediate Resistance:
93.24
Key Resistance:
93.34–93.44
Major Supply:
93.58–93.68
Strong High:
93.92
Immediate Support:
93.14
Secondary Support:
93.04–92.94
Next Downside Levels:
92.84 → 92.73 → 92.63
---
📌 WHAT I'M WATCHING
SCENARIO A — BEARISH CONTINUATION
If SOL loses 93.14 with sustained selling pressure, price may rotate toward:
93.04 → 92.94 → 92.84 → 92.73 → 92.63
Each Fibonacci extension represents a potential reaction area.
A breakdown should be confirmed rather than assumed from a single candle.
SCENARIO B — SUPPORT REACTION / BULLISH RECOVERY
If buyers defend 93.14 and price reclaims 93.24, SOL may attempt a recovery toward:
93.34 → 93.44
A stronger bullish recovery would require overcoming the 93.40–93.48 supply zone.
The 93.58–93.68 region remains the next major resistance area.
---
📊 INDICATOR CHECK
MACD:
Approximately -0.03, with momentum near the zero histogram line.
Price Structure:
Lower highs following rejection from supply.
Immediate Support:
93.14 weak-low region.
Bearish Confirmation:
Breakdown below 93.14.
Bullish Confirmation:
Reclaim 93.24 → 93.34 → 93.44.
---
📝 CHART NOTE
The short-term structure favors caution toward the downside while SOL remains below the nearby resistance levels.
However, the 93.14 support area is important. A reaction from this level could temporarily interrupt bearish momentum.
This is an educational chart framework, not a trade recommendation.
— @nayrbryanGaming
#SOLAnalysis #ChartSetup #PriceAction #SmartMoney #Fibonacci #CryptoTrading #Binance #DYOR #NFA
📈 STRUCTURE OVERVIEW
Market Phase:
Bearish rejection → Lower highs → Support test
Current Price:
93.20
Immediate Resistance:
93.24
Key Resistance:
93.34–93.44
Major Supply:
93.58–93.68
Strong High:
93.92
Immediate Support:
93.14
Secondary Support:
93.04–92.94
Next Downside Levels:
92.84 → 92.73 → 92.63
---
📌 WHAT I'M WATCHING
SCENARIO A — BEARISH CONTINUATION
If SOL loses 93.14 with sustained selling pressure, price may rotate toward:
93.04 → 92.94 → 92.84 → 92.73 → 92.63
Each Fibonacci extension represents a potential reaction area.
A breakdown should be confirmed rather than assumed from a single candle.
SCENARIO B — SUPPORT REACTION / BULLISH RECOVERY
If buyers defend 93.14 and price reclaims 93.24, SOL may attempt a recovery toward:
93.34 → 93.44
A stronger bullish recovery would require overcoming the 93.40–93.48 supply zone.
The 93.58–93.68 region remains the next major resistance area.
---
📊 INDICATOR CHECK
MACD:
Approximately -0.03, with momentum near the zero histogram line.
Price Structure:
Lower highs following rejection from supply.
Immediate Support:
93.14 weak-low region.
Bearish Confirmation:
Breakdown below 93.14.
Bullish Confirmation:
Reclaim 93.24 → 93.34 → 93.44.
---
📝 CHART NOTE
The short-term structure favors caution toward the downside while SOL remains below the nearby resistance levels.
However, the 93.14 support area is important. A reaction from this level could temporarily interrupt bearish momentum.
This is an educational chart framework, not a trade recommendation.
— @nayrbryanGaming
#SOLAnalysis #ChartSetup #PriceAction #SmartMoney #Fibonacci #CryptoTrading #Binance #DYOR #NFA