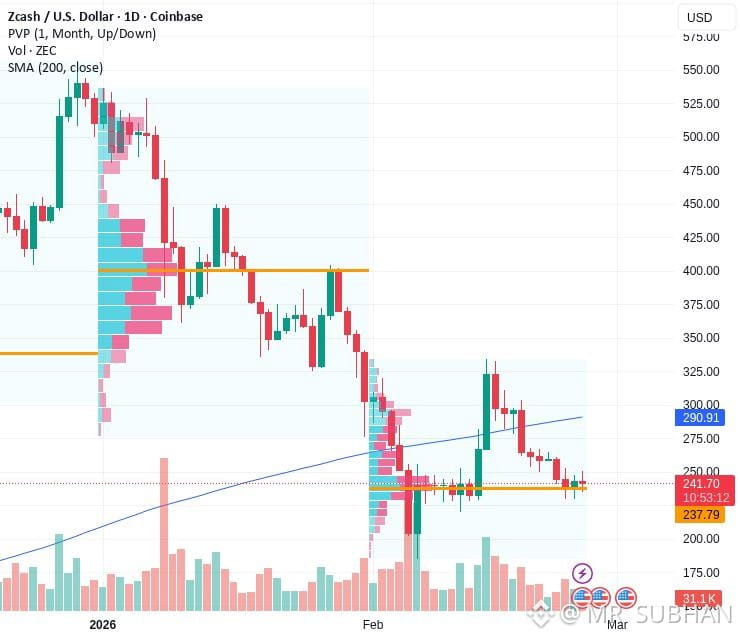
$ZEC WILL GOING UP??
#USMidtermElections #Verify1to1BinanceReserves
Zcash (ZEC) using candlestick patterns, trend direction, support and resistance, and possible bullish or bearish setups.
The key is to identify whether ZEC is showing a genuine reversal, a continuation of its downtrend, or a consolidation before its next major move.
Large bearish candle: Strong selling pressure has pushed ZEC down approximately 11% in 24 hours.
Support breakdown: Price reportedly fell below the rising trendline and the $1,201 area, weakening the short-term structure.
Potential rebound: Oversold short-term indicators could produce a relief bounce, but that alone would not confirm a trend reversal.
Volatility: The wide daily trading range suggests elevated liquidation and stop-loss risk.
Scenario A — Bullish recovery
A 4H candle closes above $1,175, followed by a successful retest.
First target: $1,238
Second target: $1,300–$1,392
Scenario B — Bearish continuation
A strong candle closes below $1,101, with selling volume increasing.
First target: $1,040
Second target: $964
Scenario C — Sideways consolidation
Price holds $1,101 but cannot break $1,175.
Possible range: $1,101–$1,175.
These are conditional technic
experiencing a strong correction after a major rally. The $1,101 support area is the most important level to watch now.
Above $1,175: recovery momentum may improve.
Below $1,101: downside risk increases.
Between these levels: wait for confirmation rather than guessing direction.
#USMidtermElections #Verify1to1BinanceReserves
Zcash (ZEC) using candlestick patterns, trend direction, support and resistance, and possible bullish or bearish setups.
The key is to identify whether ZEC is showing a genuine reversal, a continuation of its downtrend, or a consolidation before its next major move.
Large bearish candle: Strong selling pressure has pushed ZEC down approximately 11% in 24 hours.
Support breakdown: Price reportedly fell below the rising trendline and the $1,201 area, weakening the short-term structure.
Potential rebound: Oversold short-term indicators could produce a relief bounce, but that alone would not confirm a trend reversal.
Volatility: The wide daily trading range suggests elevated liquidation and stop-loss risk.
Scenario A — Bullish recovery
A 4H candle closes above $1,175, followed by a successful retest.
First target: $1,238
Second target: $1,300–$1,392
Scenario B — Bearish continuation
A strong candle closes below $1,101, with selling volume increasing.
First target: $1,040
Second target: $964
Scenario C — Sideways consolidation
Price holds $1,101 but cannot break $1,175.
Possible range: $1,101–$1,175.
These are conditional technic
experiencing a strong correction after a major rally. The $1,101 support area is the most important level to watch now.
Above $1,175: recovery momentum may improve.
Below $1,101: downside risk increases.
Between these levels: wait for confirmation rather than guessing direction.