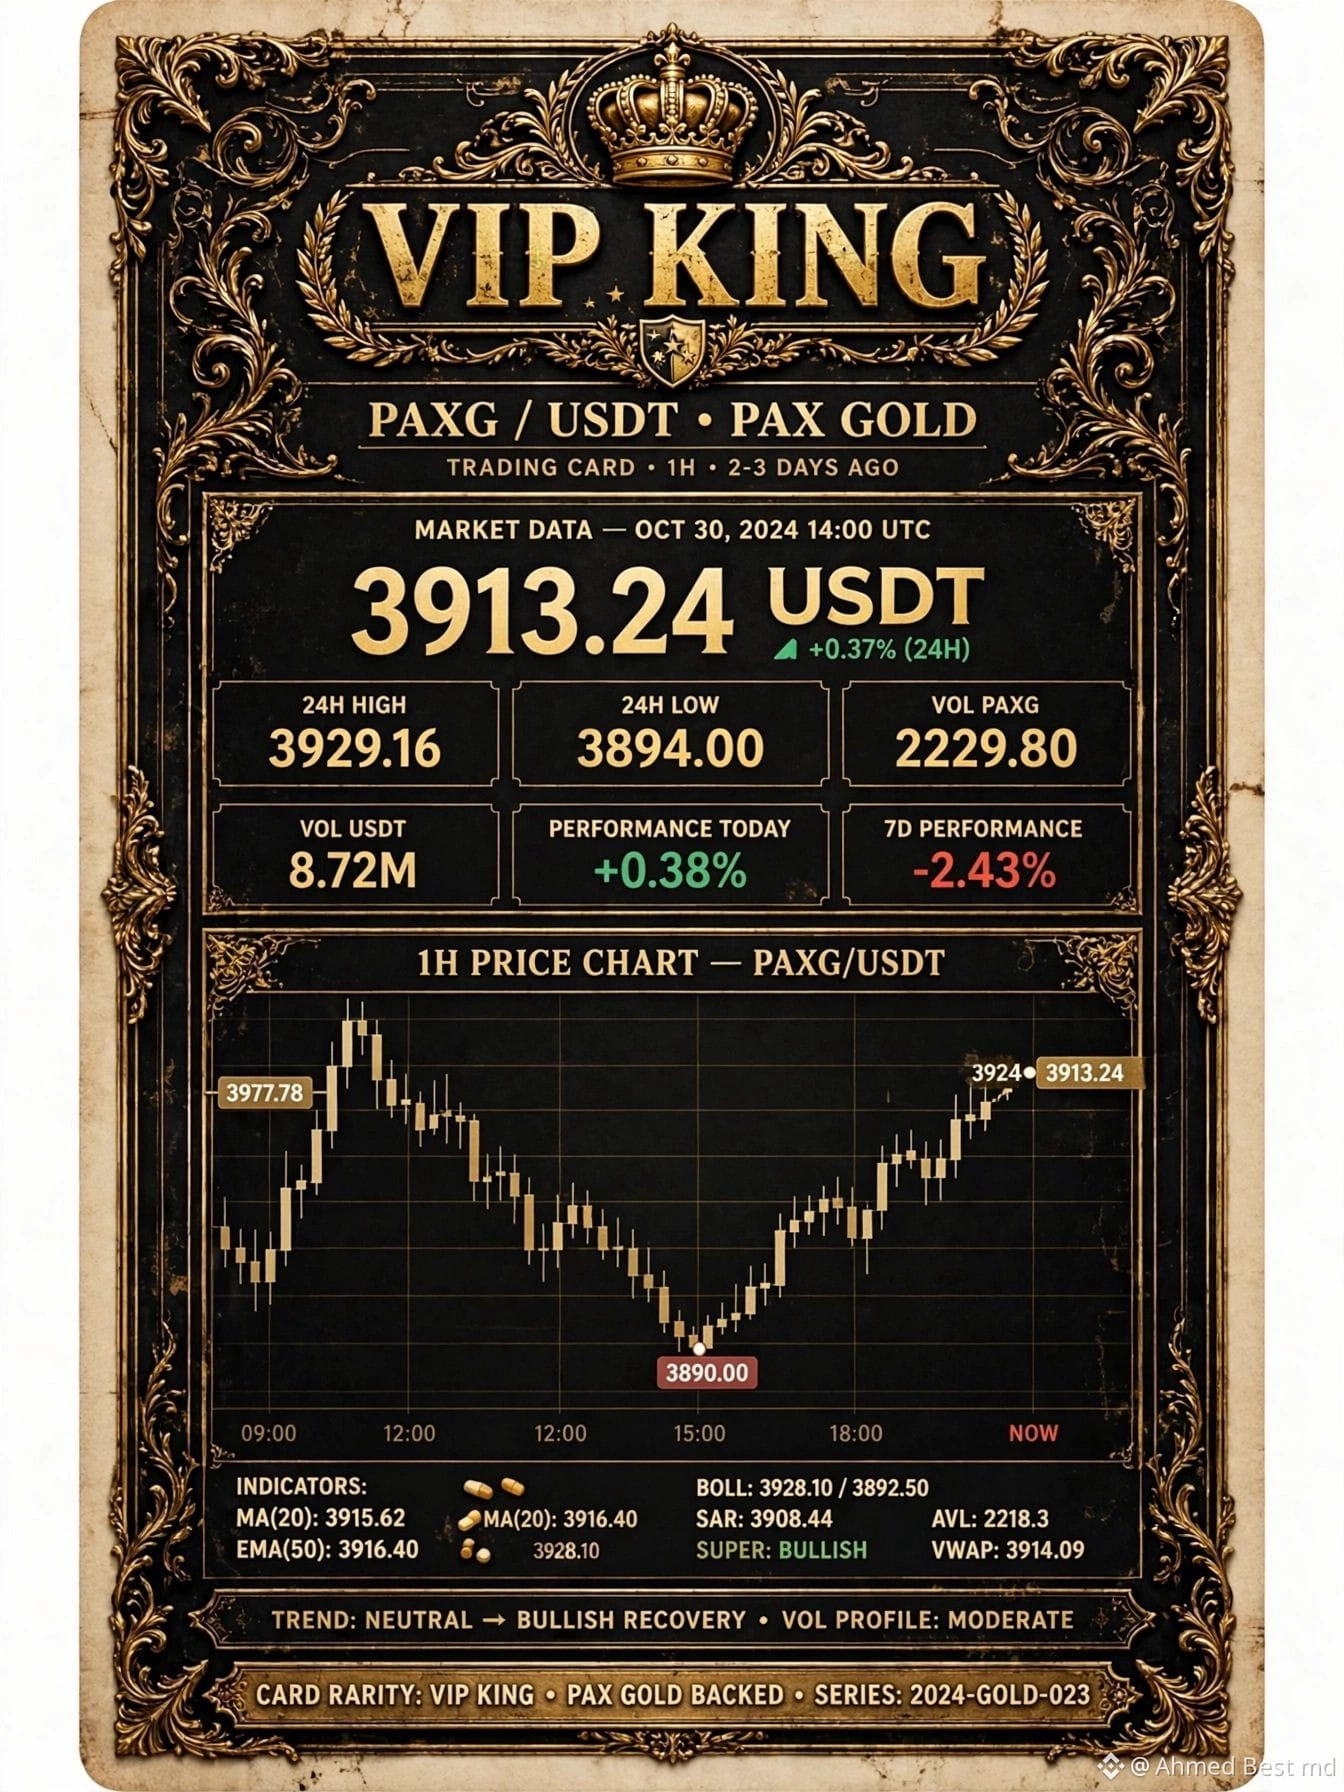
$PAXG stock latest analyse
*3,913.24 Rs1,085,493.64 +0.37%*
24h High 3,929.16 / 24h Low 3,894.00 / 24h Vol(PAXG) 2,229.80 / 24h Vol(USDT) 8.72M
tCommodities
*Performance:*
Today +0.38% / 7 Days -2.43% / 30 Days -5.78% / 90 Days -3.26% / 180 Days -14.04% / 1 Year -2.50%
*1H DUMP & RECOVERY:*
3,977.78 High → 3,890.00 Low = *-87.78 (-2.20%) dump*
Current 3,913.24 = *+23.24 (+0.59%) bounce* from low
*Chart:* Long red capitulation wick from 3,977.78 top, then flat consolidation at 3,890.00 low for almost 24h. Then strong green breakout Nov 02 09:00, 3,924 peak, now 3,913.24 holding above VWAP and MA.
*Strategy:*
Support 3,890.00 (Mega Low / Demand)
Resistance 3,924.23 then 3,929.16 (24h High) then 3,977.78
Long above 3,904.92 target 3,929.16, Stop below 3,890.00
Bias: Bullish recovery, Today +0.38% green, gold momentum returning.
#BrazilVirtualAssetLicenseDeadlineDrawsAbout40Firms #BitcoinClosesAbove50WeekMAFor7thStraightWeek #BinanceRestores28FiatWithdrawals
-🤫
*3,913.24 Rs1,085,493.64 +0.37%*
24h High 3,929.16 / 24h Low 3,894.00 / 24h Vol(PAXG) 2,229.80 / 24h Vol(USDT) 8.72M
tCommodities
*Performance:*
Today +0.38% / 7 Days -2.43% / 30 Days -5.78% / 90 Days -3.26% / 180 Days -14.04% / 1 Year -2.50%
*1H DUMP & RECOVERY:*
3,977.78 High → 3,890.00 Low = *-87.78 (-2.20%) dump*
Current 3,913.24 = *+23.24 (+0.59%) bounce* from low
*Chart:* Long red capitulation wick from 3,977.78 top, then flat consolidation at 3,890.00 low for almost 24h. Then strong green breakout Nov 02 09:00, 3,924 peak, now 3,913.24 holding above VWAP and MA.
*Strategy:*
Support 3,890.00 (Mega Low / Demand)
Resistance 3,924.23 then 3,929.16 (24h High) then 3,977.78
Long above 3,904.92 target 3,929.16, Stop below 3,890.00
Bias: Bullish recovery, Today +0.38% green, gold momentum returning.
#BrazilVirtualAssetLicenseDeadlineDrawsAbout40Firms #BitcoinClosesAbove50WeekMAFor7thStraightWeek #BinanceRestores28FiatWithdrawals
-🤫