

🟡 Gold Market Analysis — Monday, 19 October 2026
📊 Day-Trading Report | XAU/USD | 15-Minute Candlesticks | USD per Troy Ounce | Preparation for Tuesday, 20 October 2026
⚠️ Important data limitation: A verified live XAU/USD 15-minute OHLC feed is not available in this conversation. The reported prices below should be treated as reference data, not guaranteed live quotes. Exact candle-by-candle analysis requires a current chart or historical OHLC data.
🌍 Today's Gold Market Snapshot
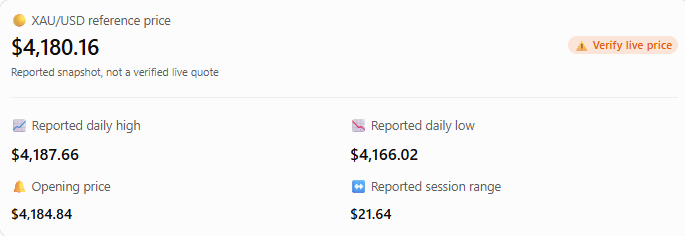
🌐 Market direction: The reported snapshot is below the opening reference, suggesting intraday selling pressure at that point.
📉 Bearish confirmation: A sustained move below the session low could strengthen the bearish case.
📈 Bullish confirmation: Reclaiming the opening price and breaking the session high could improve the bullish outlook.
⚖️ Trading bias: Remain neutral until the 15-minute chart confirms a breakout, breakdown, or clear reversal.
📰 Major Factors Influencing Gold
💵 U.S. Dollar Index (DXY): A stronger dollar can pressure gold, while a weaker dollar may support prices.
🏦 U.S. Treasury yields: Falling yields can make gold more attractive; rising yields can increase downside pressure.
📊 Federal Reserve expectations: Changes in interest-rate expectations can create sharp movements in XAU/USD.
🔥 Inflation Higher-than-expected inflation can affect expectations for monetary policy and market volatility.
🛢️ Oil prices: Energy-price movements can influence inflation expectations and, indirectly, gold.
🌍 Geopolitical uncertainty: Safe-haven demand can support gold during periods of elevated uncertainty.
💹 Market liquidity: London and New York trading activity can produce stronger moves, false breakouts, and rapid reversals.
⚠️ News risk: Unexpected economic releases or central-bank headlines can invalidate a technical setup quickly.
🕯️ Today's 15-Minute Candlestick Analysis
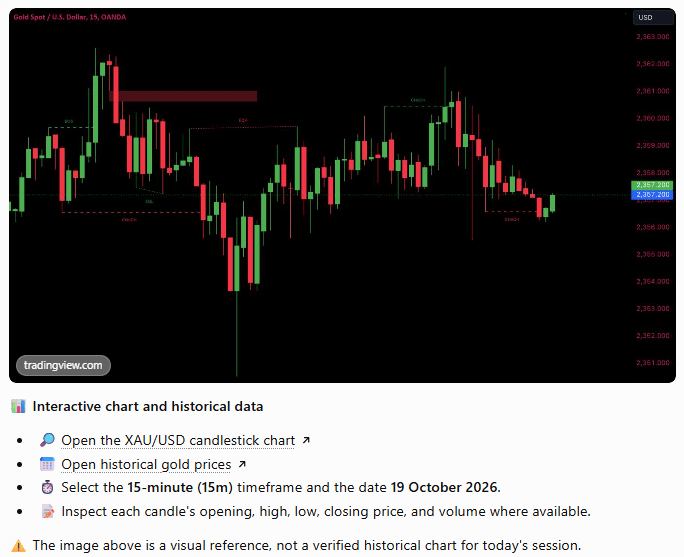
📍 Key Support and Resistance
Level
Price (USD)
🔴 Resistance 2
$4,198.84
🔴 Resistance 1
$4,187.66
🟡 Opening reference
$4,184.84
⚪ Reported price
$4,180.16
🟢 Support 1
$4,166.02
🟢 Support 2
$4,147.26
📈 Bullish setup: A confirmed 15-minute close above $4,187.66 and successful retest.
📉 Bearish setup: A confirmed close below $4,166.02 and failed retest.
⚖️ No-trade zone: Sideways movement between support and resistance without clear confirmation.
📅 Plan for Tuesday, 20 October
🌏 Asian session: Mark the previous day's high and low; identify the initial range.
🇬🇧 London session: Watch for breakouts, liquidity sweeps, and retests.
🇺🇸 New York session: Monitor the US dollar, Treasury yields, and scheduled economic releases.
📰 News risk: Avoid impulsive entries around high-impact announcements.
🎯 Trade confirmation: Align the 1-hour trend with a 15-minute entry signal.
🛡️ Risk Management
💰 Risk approximately 0.25%–0.5% of account equity per trade while testing a strategy.
🛑 Set your stop-loss before entering.
📊 Aim for a favorable risk/reward ratio after trading costs.
🚫 Avoid revenge trading, excessive leverage, and oversized positions.
🔮 Final Market Outlook
⚖️ Base case: Neutral until the price breaks out or breaks down with confirmation.
🟢 Bullish confirmation: Sustained trading above $4,187.66, followed by a successful retest.
🔴 Bearish confirmation: A 15-minute close below $4,166.02, followed by a failed attempt to reclaim that level.
🟡 No-trade condition: Price continues moving sideways between the reference levels without a clear directional move.
🌐 Macro confirmation: Check whether the U.S. dollar and Treasury yields support or contradict the price action.
🛡️ Trading priority: Protect capital first; take a trade only when the entry, invalidation level, and potential reward are clearly defined.
⚠️ Disclaimer: These scenarios are educational, not guaranteed forecasts or personalized financial advice. The reference prices must be verified before being used for trading.
#GoldMarketAnalysis #GoldTrading #XAUUSD #GoldTechnicalAnalysis