

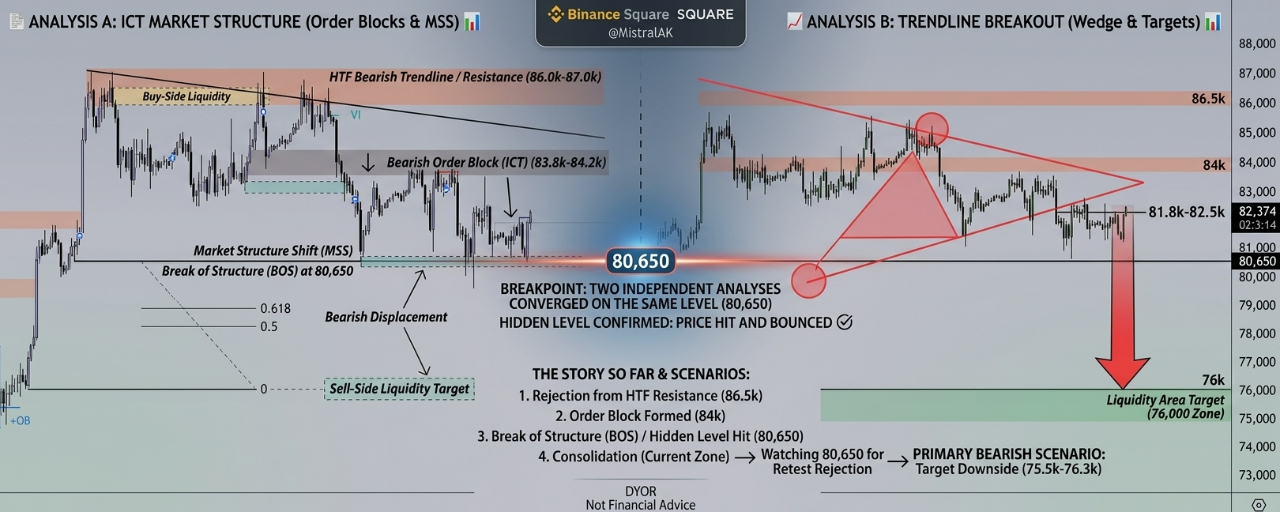

When two independent chart readings - using different tools, different timeframes, different language - converge on the same invalidation level, it’s worth paying attention to the structure behind the agreement rather than the headline number itself. Both analyses this week identified 80,650 as the key line in the sand for $BTC . Price has already traded down to it. What happens next depends on levels that haven’t been tested yet.
KEY LEVELS
▪️ Resistance zone: 86,000-87,000 - repeated rejection, flagged by both analyses as buy-side liquidity
▪️ Bearish order block: 83,800-84,200 - the last pocket of bullish control before the move down accelerated
▪️ Break of Structure: 80,650 - the level both independent analyses converged on
▪️ Current price: consolidating in the 81,800-82,500 zone after touching 80,000
▪️ Downside liquidity target: 75,500-76,317 - the next resting sell-stop pool if structure stays broken
WHAT ALREADY HAPPENED (AND WHY IT MATTERS)
Price rallied into 86,000-87,000 and was rejected at a descending higher-timeframe trendline. A bearish order block formed around 83,800-84,200 — the last pocket of buying pressure before a Market Structure Shift tipped momentum toward sellers. The real confirmation came when price broke and closed below 80,650 — a genuine Break of Structure, not just a wick. Price has since touched 80,000 and is now consolidating.
WHY TWO INDEPENDENT ANALYSES AGREEING MATTERS
One chart calling a level is an opinion. Two separate breakdowns, built independently with different Fibonacci anchors, arriving at the same 80,650 line and the same 75,500-76,317 target is a stronger signal the structure is real rather than curve-fitted. That doesn’t make the outcome certain — it means the level is worth watching closely.
THE SCENARIOS FROM HERE
Bearish continuation: If 80,650 keeps acting as resistance on any retest, the path toward 75,500-76,317 stays open.
Invalidation/reclaim: If BTC reclaims 80,650 and holds it as support — building higher lows above it - the bearish thesis weakens significantly.
Neutral/range: Price could simply consolidate in the 81,000-83,000 band without resolving either way for a while.
WHAT TO ACTUALLY WATCH, NOT TRADE ON
▪️ Whether a bounce into 80,650 gets rejected or breaks back above with a held close
▪️ Candle closes at the 83,800-84,200 order block on any deeper retrace
▪️ Volume/follow-through on any move toward 75,500-76,317
▪️ Macro liquidity conditions - the real driver behind BTC’s pressure this month
THE PART WORTH REPEATING
An order block, a Fibonacci level, or a liquidity zone doesn’t guarantee anything alone. A level only means something once price action confirms it - a real close, real rejection, real follow-through. Treating a marked-up chart as a prediction rather than a framework is the most common way these setups get misused.
BOTTOM LINE
BTC has already done the hard part both analyses were watching for - it broke 80,650. What hasn’t happened yet is confirmation of what that break means: continuation toward 75,500-76,317, or a reclaim that invalidates the bearish structure. The next test of 80,650 is the level to watch.
Does a confirmed break below 80,650 change your read on $BTC ’s next move, or are you waiting to see if sellers can hold it on a retest?
Not financial advice. Always DYOR.
Like & Follow for Daily Trade Analytics & Insider News. @MistralAK
#BTC #TradingSignals #TrendingTopic #Shortbtc
