

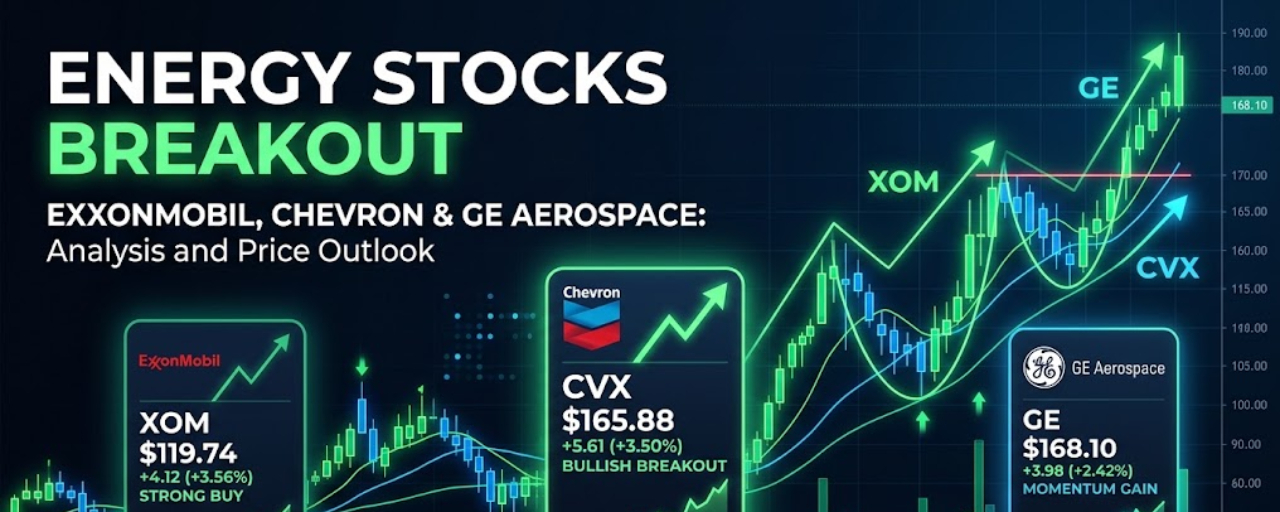

Top 3 Stocks to Watch Next Week: XOM, CVX & GE (Oct 19–23, 2026)
Can energy stocks continue to outperform while the broader technology sector struggles? Let’s examine the actual market price data, key technical indicators, critical support/resistance levels, and precise trade triggers based on data from Friday, October 16, 2026.
Market Context & Setup
The broader U.S. stock market experienced a challenging week, led by a sharp drawdown in the Nasdaq. However, sector rotation into energy majors like ExxonMobil ($XOM) and Chevron ($CVX) highlights localized relative strength. Meanwhile, GE Aerospace ($GE) presents a distinct, catalyst-driven scenario ahead of its upcoming Q3 earnings release.
Detailed Stock Breakdown
🥇 1. ExxonMobil ($XOM

) — Strong Trend, But Don't Chase
ExxonMobil finished Friday's session up +2.46% at $178.98, setting a new 52-week intraday high of $179.16. While the daily moving averages signal a strong uptrend, volume came in slightly light at 13.13 million shares (below the 50-day average of 13.5M).
Price Action & Key Levels: -------------------------------------------------------------------------------- Resistance / Target: [======================] $179.16 (52-Wk High) Current Close: [====================] $178.98 Support Zone: [=================] $173.75 - $175.30 -------------------------------------------------------------------------------- Indicators: RSI(14): 72.95 (Overbought) | Vol: 13.13M (Below Avg)
Technical Evidence: Daily moving averages are strictly bullish, but an RSI(14) of 72.95 warns of overbought conditions. Short-term oscillators signal potential temporary exhaustion.
Key Levels:
Near-Term Resistance: $179.16
Potential Support: $173.75 – $175.30
Execution Strategy: Wait for a pullback or confirmed breakout. Avoid buying immediately after a strong rally without high-volume breakout confirmation above $180.
🥈 2. Chevron ($CVX

) — Bullish Structure, High Momentum Risk
Chevron advanced +2.59% on Friday to close at $224.99, reaching a new 52-week high of $225.31. Price closed near the session high, confirming intraday demand.
Moving Average Overlay vs. Price: -------------------------------------------------------------------------------- Current Price: [==========================] $224.99 20-Day SMA: [====================] $209.61 50-Day SMA: [===================] $207.13 200-Day SMA: [=================] $189.87 -------------------------------------------------------------------------------- Indicators: RSI(14): 70.77 (Overbought) | MACD: Bullish
Technical Evidence: CVX trades comfortably above its 20-day ($209.61), 50-day ($207.13), and 200-day ($189.87) moving averages. However, an RSI(14) of 70.77 indicates extended conditions.
Key Levels:
First Support: $221.83 | Secondary Support: $218.67
Breakout Resistance: $226.73 | Upside Targets: $228.47 & $231.63
Execution Strategy: Look for a successful retest of support or a volume-backed breakout above $226.73.
🥉 3. GE Aerospace ($GE ) — Earnings Catalyst, Mixed Chart
GE Aerospace gained +0.59% on Friday, closing at $313.83. While $GE reclaimed its 20-day moving average, the daily chart formed a potential shooting-star candlestick, signaling upper-wick rejection at $321.17.
Intraday Range & Targets: -------------------------------------------------------------------------------- Resistance Targets: [======================] $324.00 - $326.82 Friday High: [====================] $321.17 Current Close: [==================] $313.83 Friday Low / Support: [=================] $311.00 - $313.20 -------------------------------------------------------------------------------- Catalyst: Q3 Earnings (Tuesday, Oct 20 Before Market Open)
Technical Evidence: Short-term recovery above the 20-day SMA, but the broader trend summary remains mixed/weak.
Catalyst Alert: GE reports Q3 earnings on Tuesday, October 20, before the market opens. Gap risk is high.
Key Levels:
Support Levels: $311.00 and $308.18
Upside Triggers: Above $318.91, with confirmation above $321.17
Execution Strategy: Avoid entering prior to earnings. Wait for post-earnings market response before acting on price confirmation.
Summary Watchlist Comparison
TickerPrimary StrengthMain RiskPreferred Strategy$XOMStrong bullish trend, 52-week highOverbought RSI (72.95), lower volumePullback entry or confirmed breakout above $180$CVXPrice above 20/50/200-day SMAsExtended distance from moving averagesSupport retest around $221.83 or breakout > $226.73$GEEarnings catalyst, 20-day SMA recoveryShooting star candlestick, binary gap riskWait for post-earnings price reaction
Trade Execution Checklist
Before taking any trade during the week of October 19–23, 2026:
Price Confirmation: Has price clearly sustained above resistance or held support?
Volume Confirmation: Is institutional buying present on upside breaks?
Market Regimes: Is the broader market (S&P 500 / Nasdaq) stabilizing?
Risk Management: Is your stop-loss structured to maintain a minimum 1:2 Risk-to-Reward ratio?
Product Availability: Verify tokenized or stock-linked asset availability in your local jurisdiction.
Final Verdict
Top Focus: $XOM (Strongest trend structure)
Second Focus: CVX (High momentum, monitor extension)
Catalyst Watch: $GE (Stand down until after Oct 20 earnings)
Disclaimer: Educational market analysis only. Historical technical levels and indicators are subject to change and do not constitute financial advice. Always verify live market quotes, trading fees, and regulatory requirements before trading.