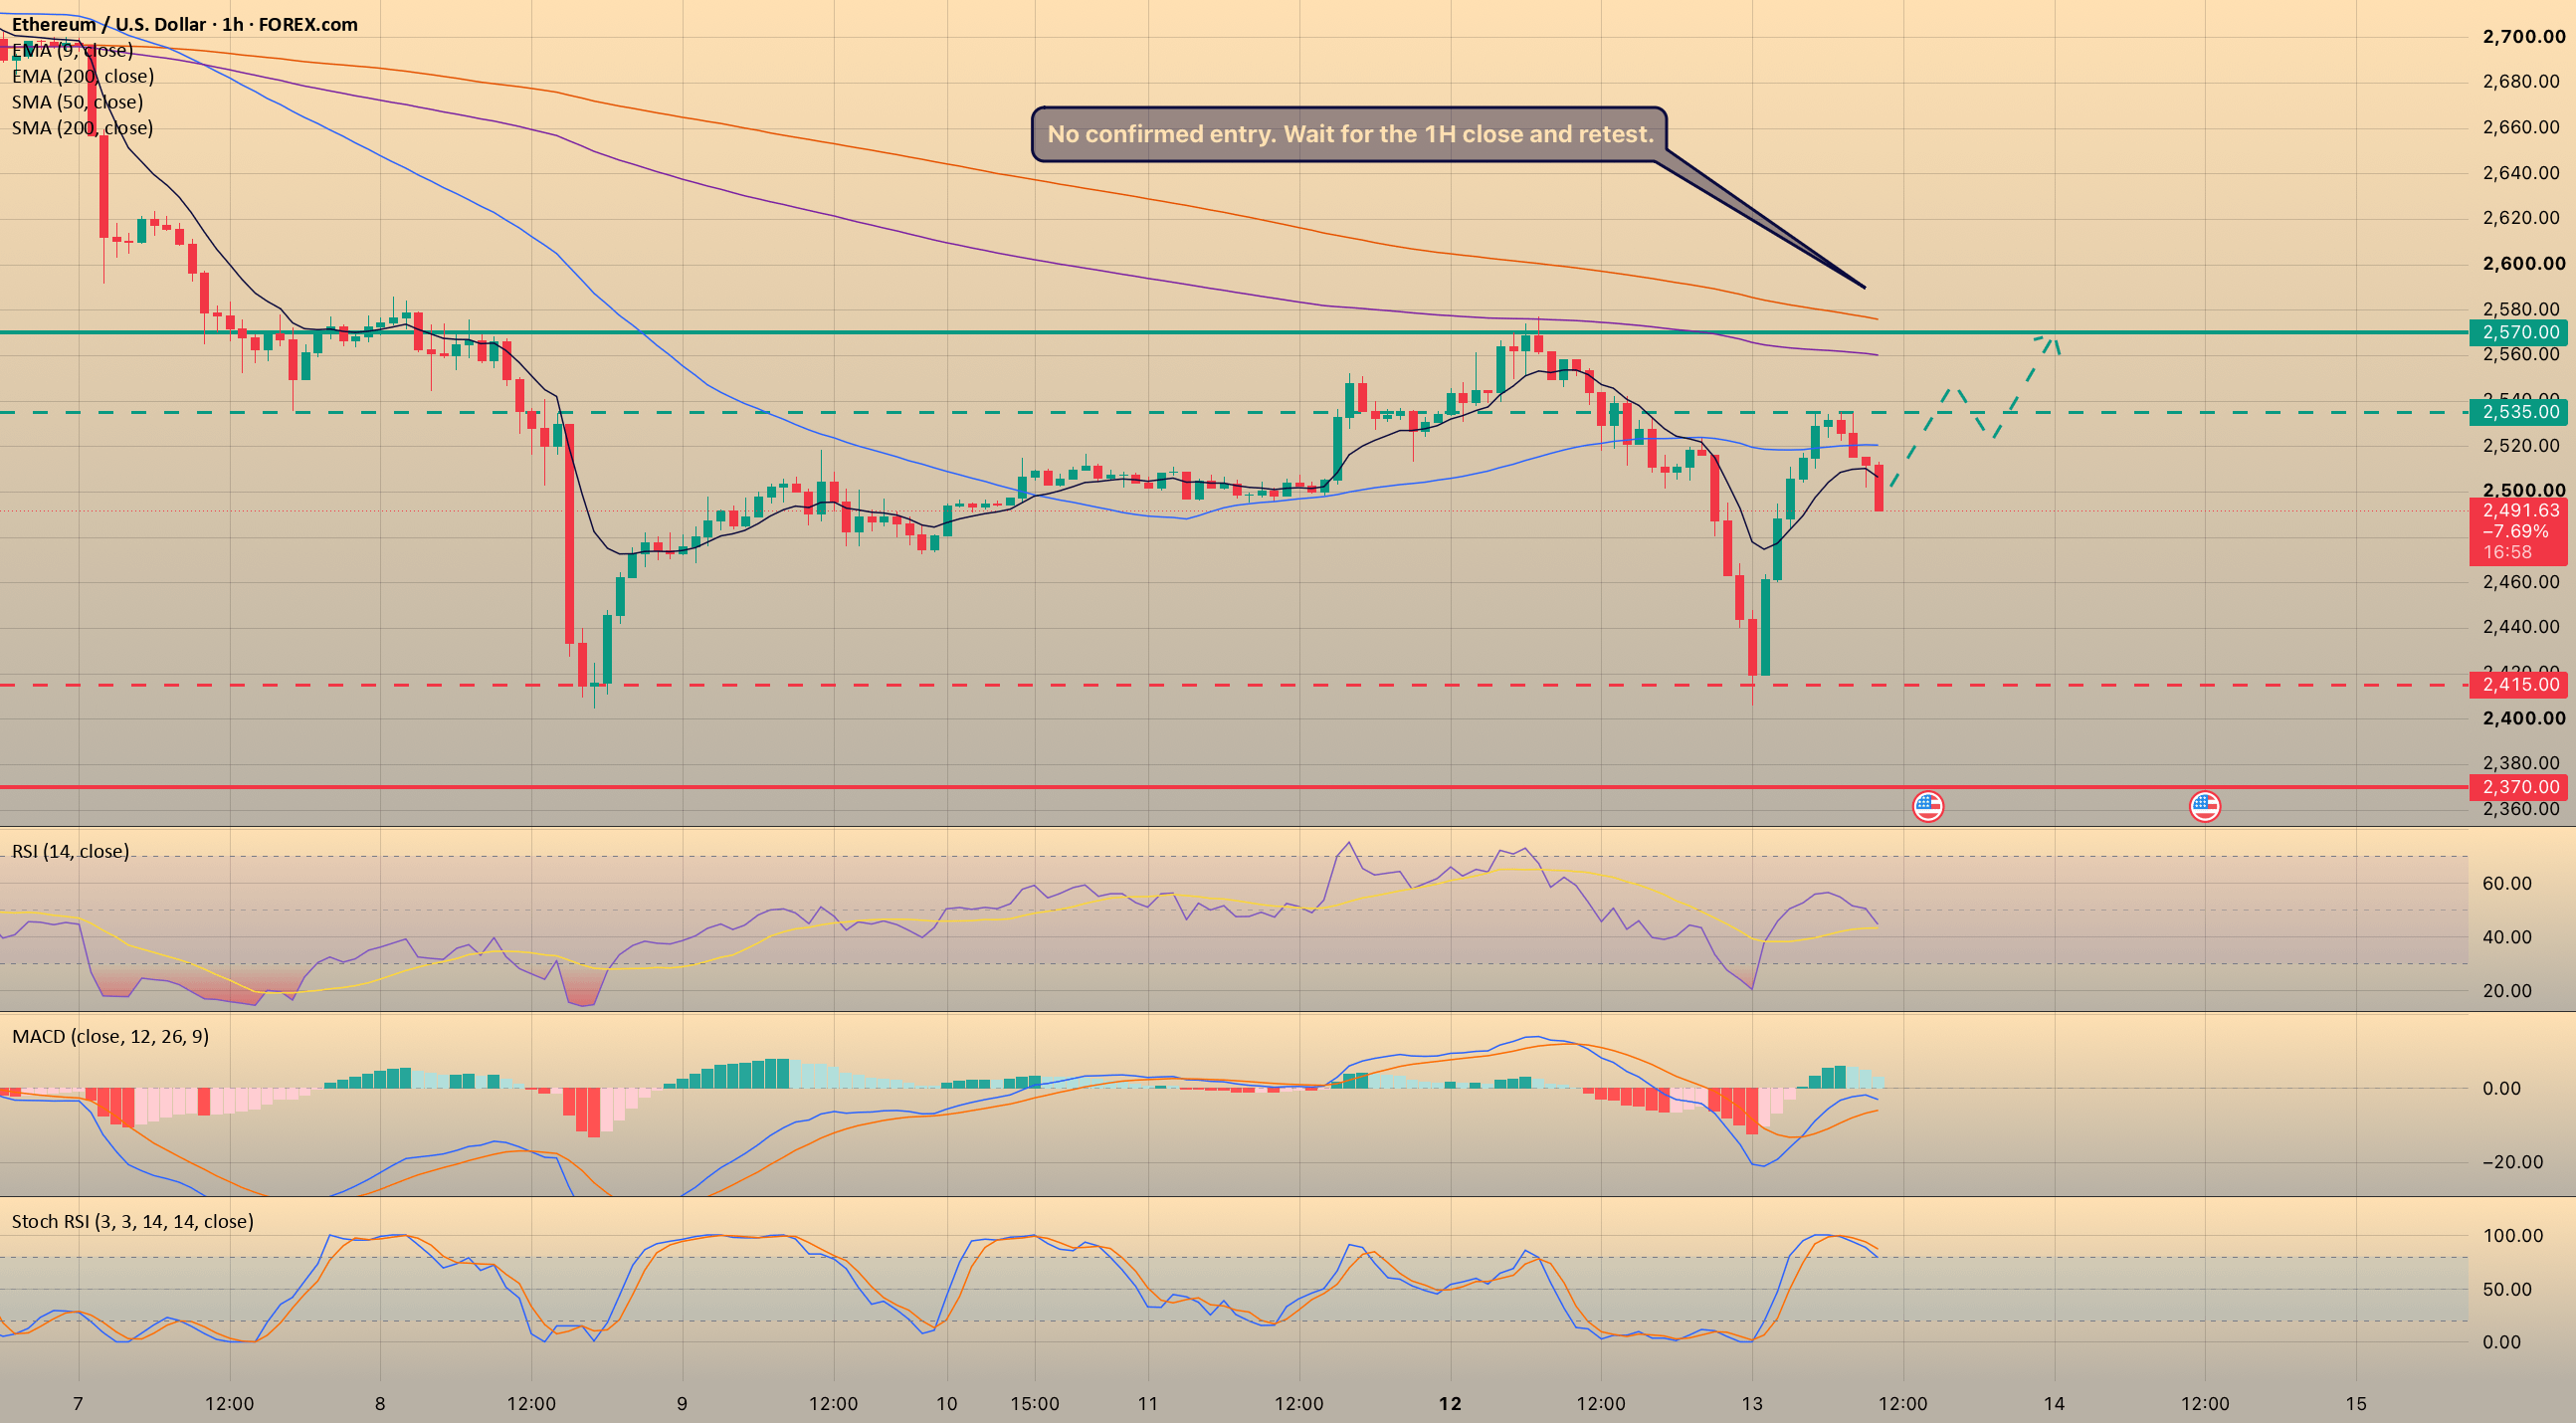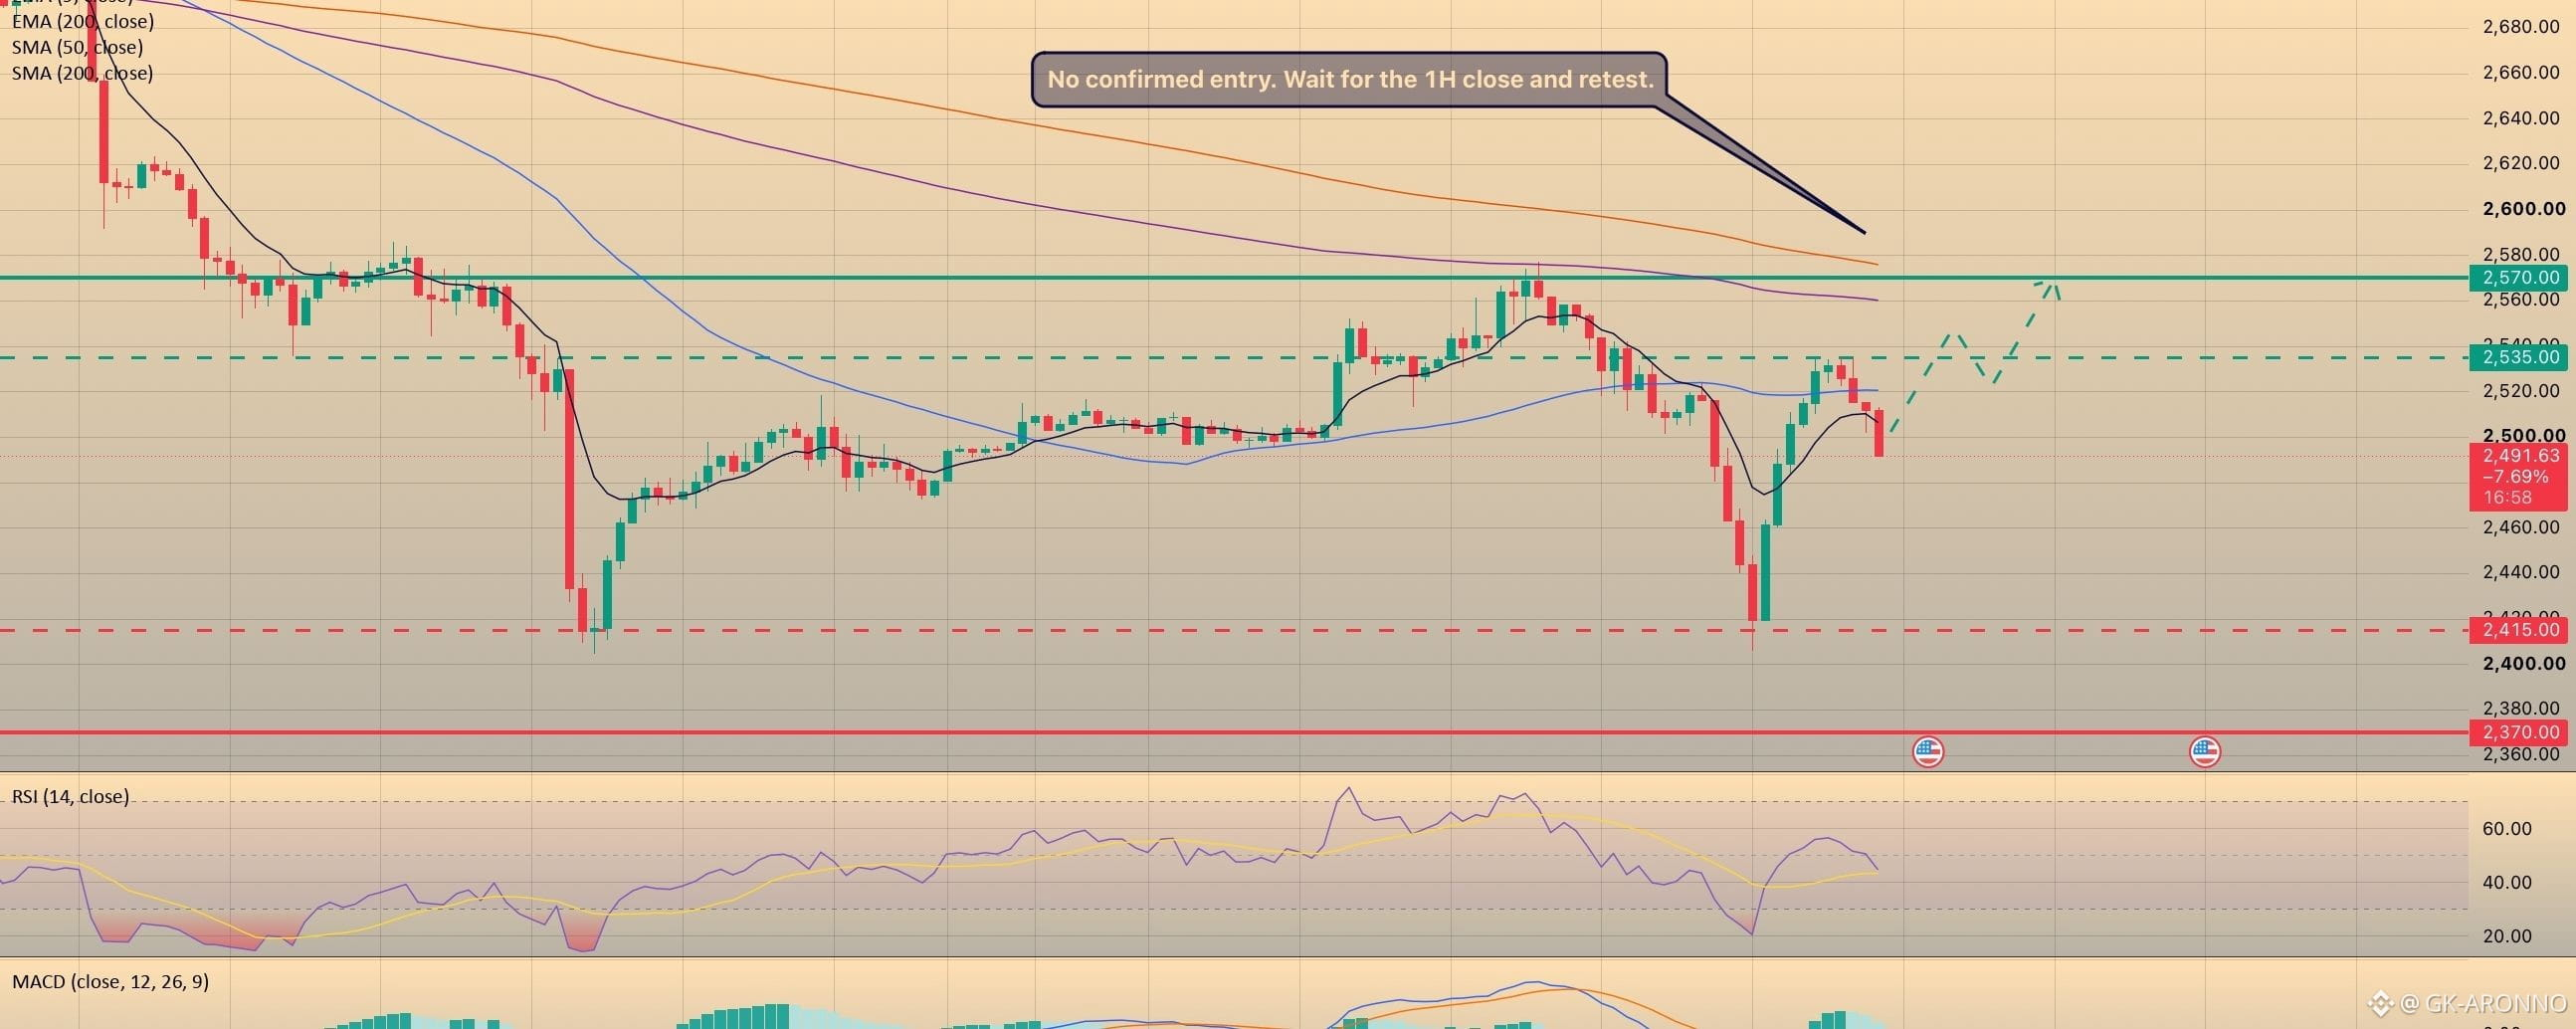


Ethereum rebounded from $2,405–$2,420, but stalled near $2,535. On the hourly chart, price is around $2,504, below the 9 EMA near $2,509 and 50 SMA near $2,521. The declining 200-period averages at $2,560–$2,576 remain overhead resistance.
The fundamental backdrop remains cautious: US Ethereum ETFs recorded $85.4 million in net outflows on October 12, their tenth consecutive negative session.
RSI near 48 shows no clear directional strength. MACD remains above its signal line but below zero, with a shrinking positive histogram. Stochastic RSI is turning lower from elevated levels. These readings suggest the rebound is losing momentum, without confirming another breakdown.
No confirmed trade setup yet.
- Bullish scenario: an hourly close above $2,535, followed by a successful retest of $2,520–$2,535, would strengthen the recovery case toward $2,560–$2,576.
- Bearish scenario: an hourly close below $2,500 and a failed reclaim would bring $2,480–$2,490, then $2,450–$2,460, into focus. Below those supports, watch $2,405–$2,420; $2,370 is a further downside reference.
For now, I’m waiting for confirmation. Nearby support limits the room for a short, while buyers still need to reclaim resistance before a stronger recovery can develop.
⚠️ Not financial advice.