

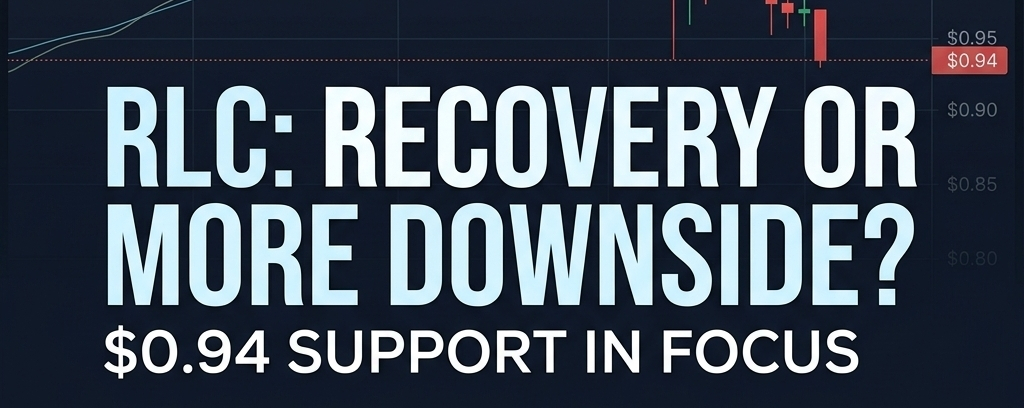

RLC/USDT is facing a notable pullback after reaching a recent 24-hour high of $1.1119. According to the latest Binance screenshots, RLC is trading around $0.9385, with a 24-hour low of $0.9123.
The key question now is whether buyers can defend support and trigger a recovery—or whether further downside is possible.
📊 1H Chart: Short-Term Pressure
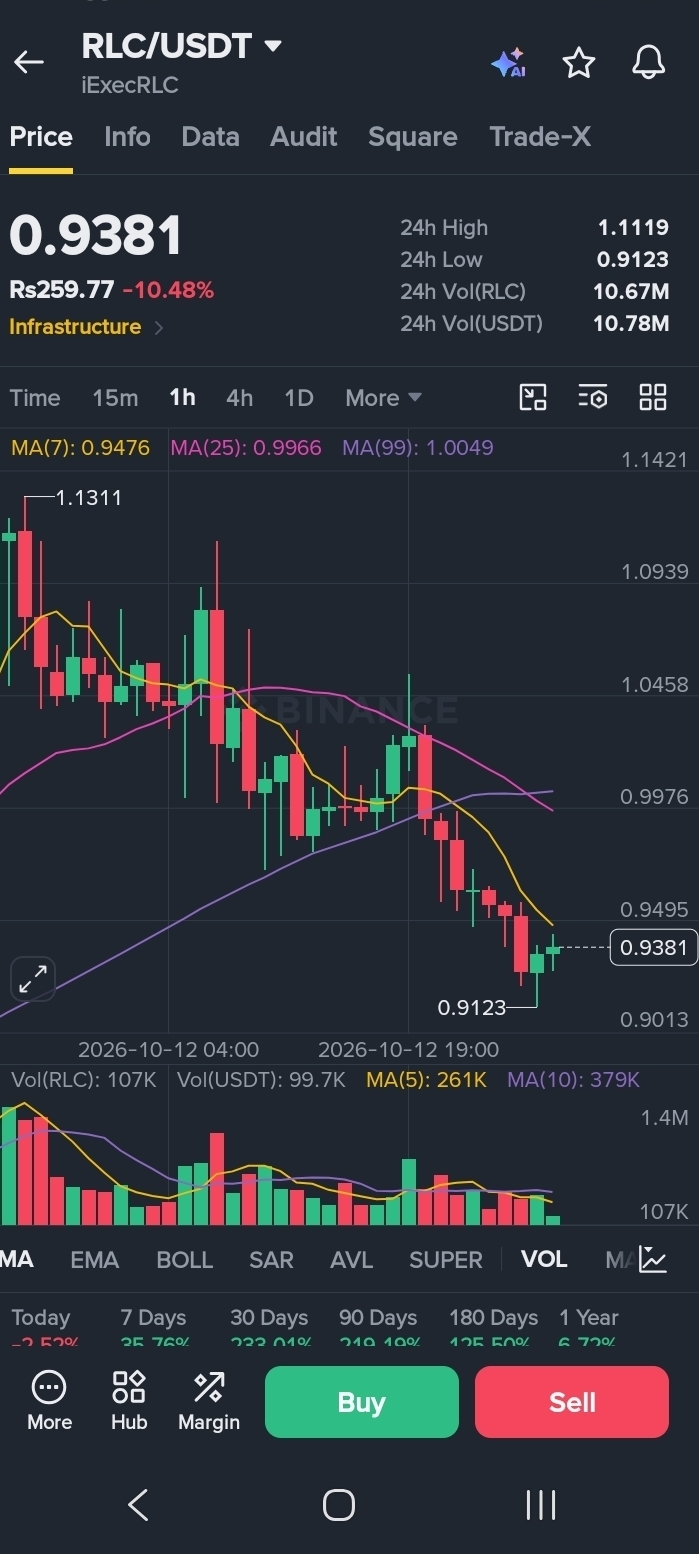
The 1-hour chart shows RLC trading below all three displayed moving averages:
MA(7): $0.9476
MA(25): $0.9966
MA(99): $1.0049
This suggests short-term momentum remains weak. The first challenge for buyers is to reclaim the $0.9476 area. A stronger recovery would need to push price toward the $0.9966–$1.0049 resistance zone.
If RLC fails to recover these levels, selling pressure could continue.
📈 1D Chart: The Bigger Picture
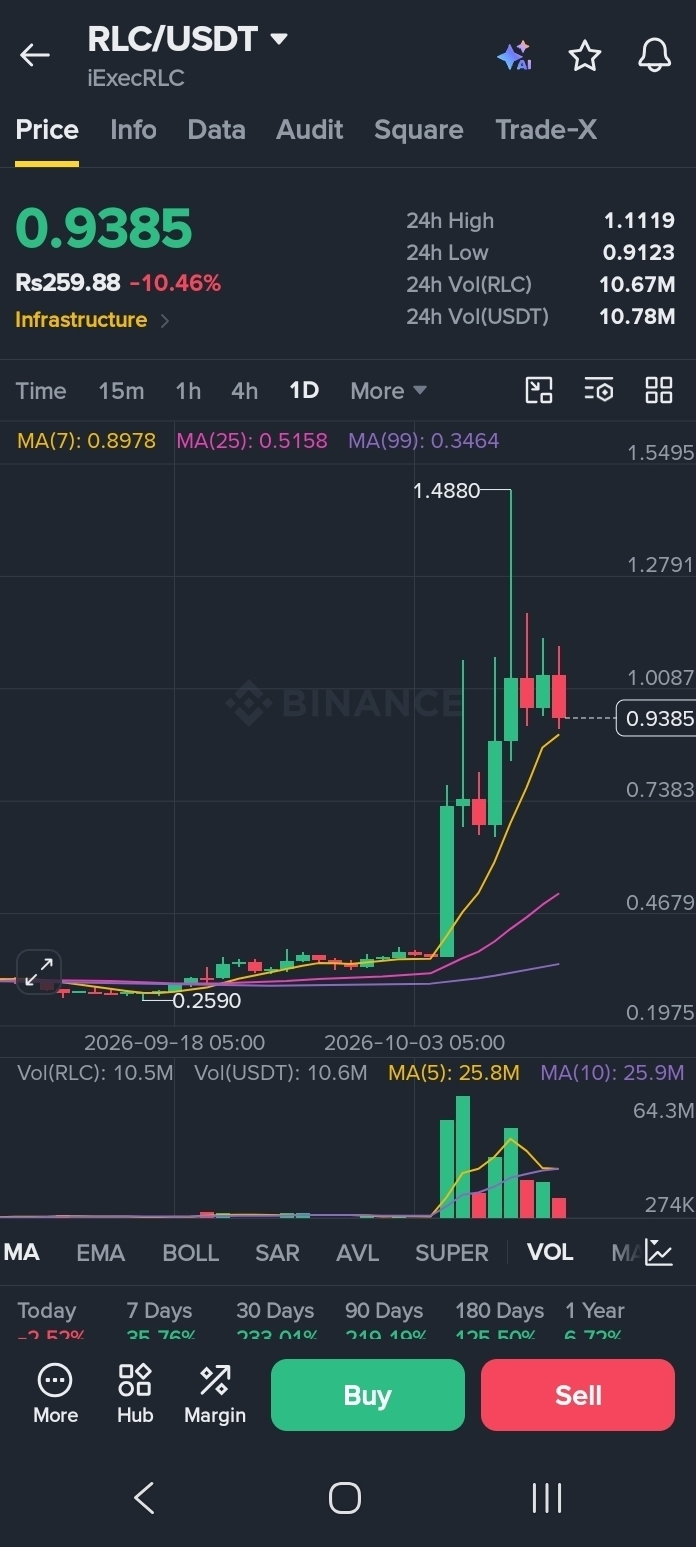
The daily chart presents a different perspective:
MA(7): $0.8978
MA(25): $0.5158
MA(99): $0.3464
RLC remains above these displayed daily moving averages, including the short-term MA(7). This may indicate that the broader recovery structure has not completely broken down, although the recent pullback deserves caution.
🎯 Key Support and Resistance Levels
Support levels
$0.9123 — recent 24-hour low
$0.9013 — another level to watch on the displayed chart
$0.8978 — daily MA(7)
Resistance levels
$0.9476 — 1H MA(7)
$0.9966–$1.0049 — 1H MA(25) and MA(99)
$1.0458 — potential next recovery area
$1.1119 — recent 24-hour high
These are reference levels from the screenshots, not guaranteed turning points.
🔍 What Could Happen Next?
Bullish scenario: If RLC holds the $0.9123–$0.8978 area and reclaims $0.9476, buyers may attempt a recovery toward $0.9966–$1.0049. A sustained move above that zone would provide a stronger recovery signal.
Bearish scenario: If price breaks below $0.9123 and fails to recover, the $0.9013–$0.8978 area becomes important to monitor. Losing that zone could increase downside risk.
💡 Final Thoughts
RLC is showing short-term weakness, while its daily chart still retains some signs of a broader recovery. The next move depends on whether buyers can defend support and reclaim the nearby resistance levels.
Rather than chasing a falling price, traders may prefer to wait for confirmation from price action and volume.
What do you think? Will RLC recover above $1.00, or revisit the $0.90 area first? Share your view below.
Disclaimer: This article is for educational purposes only and is not financial advice. Cryptocurrency markets are volatile. Always do your own research and manage risk carefully.
#RLC #RLCUSDT #CryptoAnalysis #BinanceSquare #TechnicalAnalysis #Altcoins #cryptotrading