


The first chart I pulled up had an RSI of 26.7. That's not a pullback. That's a chart that got taken out back and shot. The second one was even worse. An RSI of 18.8. The third had an RSI of 94. One of these is not like the others.
That's the tape right now. It's split down the middle. Some charts are bleeding out while the crowd refuses to let go. Others are vertical, and everyone is already long. You don't trade the same way in both rooms.
$US is the first one. Down 20% on the day, and the RSI is sitting at 26.7. The chart ran from 0.01 to 0.04 in four days, then gave most of it back in two. That's the signature of a squeeze, not a trend.
Funding is positive at +0.0459% per four hours. Longs are still paying shorts. Open interest sits around $31.2 million, up nearly 200% in a day. That means the leveraged money is still in the trade. The story is Talus, an on-chain AI agent play. No product launch. No revenue. Just the word "AI" and a contract that lets agents execute tasks.
The level that matters is $0.0158. That's the most recent high before the dump. A clean reclaim opens the door toward $0.02. Lose $0.0110 and the bid disappears.
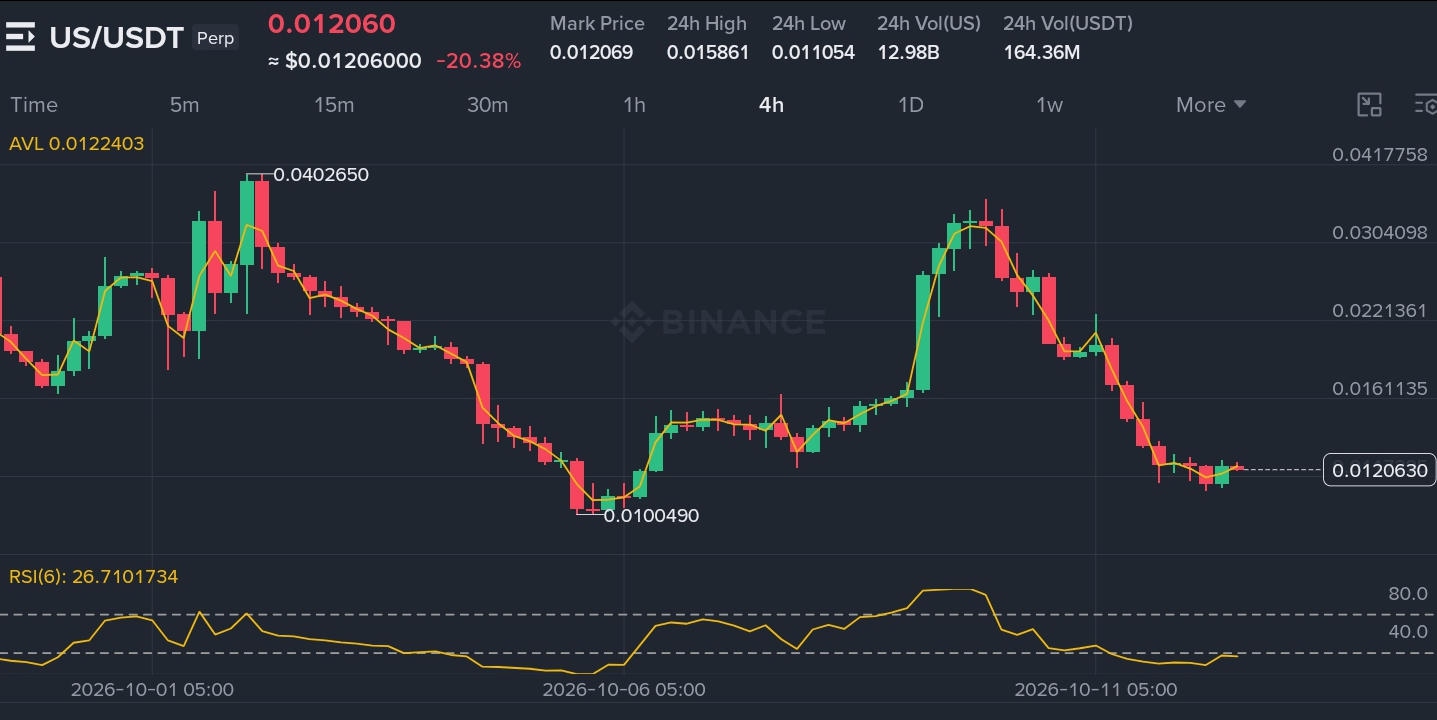
Above $0.0158 and I'm watching $0.02 first, then $0.025. Lose $0.0110 and I'm done. I've held a "dip" in a parabolic fade before, watched it look like support, and then gave back every dollar I made on the way up.


$BOME is the second one. And this one is on the other side of the pain trade. Down 16.5% on the day, and the RSI is at 18.8. That's as washed out as it gets.
Funding is positive at +0.0029%. That's mild. Open interest is $109.2 million, up over 100% in seven days. That's a massive OI spike for a meme coin. The crowd isn't just here. They're levered. The story is simple. It's a Solana meme coin with no utility, no roadmap, and no reason to exist except attention.
The level that matters is $0.0009122. That's the recent low. A clean reclaim opens the door toward $0.0011. Lose $0.00088 and the bid thins out.
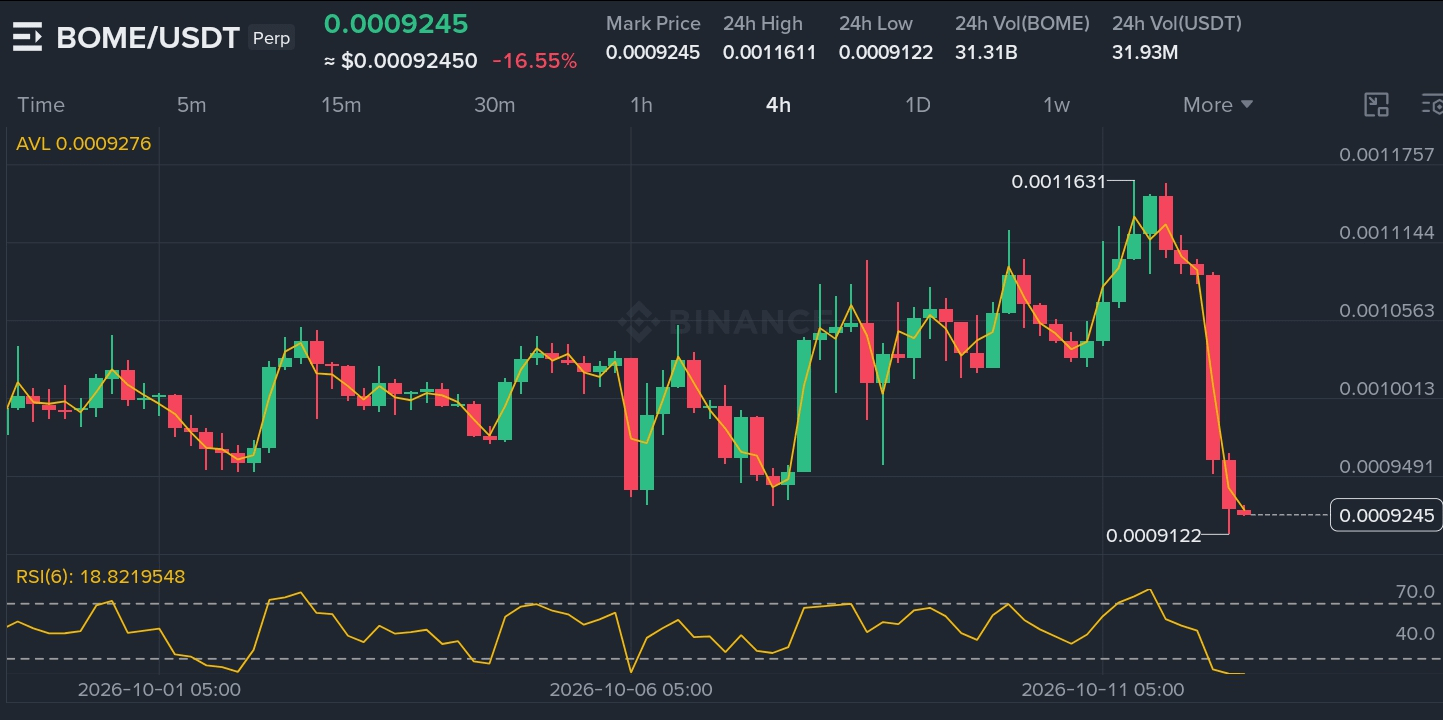
Above $0.0009122 and I'm watching $0.0011 first, then $0.0012. Lose $0.00088 and I'm out.

$RSR is the third chart. And it's the one that made me pause. Up 51% on the day, and the RSI is at 94. That's the same reading I saw on the first chart, right before it rolled over.
Funding is positive at +0.0086% across eight exchanges. Longs are paying shorts. Open interest sits at 3.3 billion RSR, worth about $5.46 million. That's not a crowded trade yet. But the RSI says the crowd is already there. The move was a single green candle out of nowhere. No major headline. No partnership. Just a thin order book and a pocket of liquidity that got swept.
The level that matters is $0.002589. That's the high from the spike. A clean reclaim opens the door toward $0.003. Lose $0.001467 and the bid thins out.
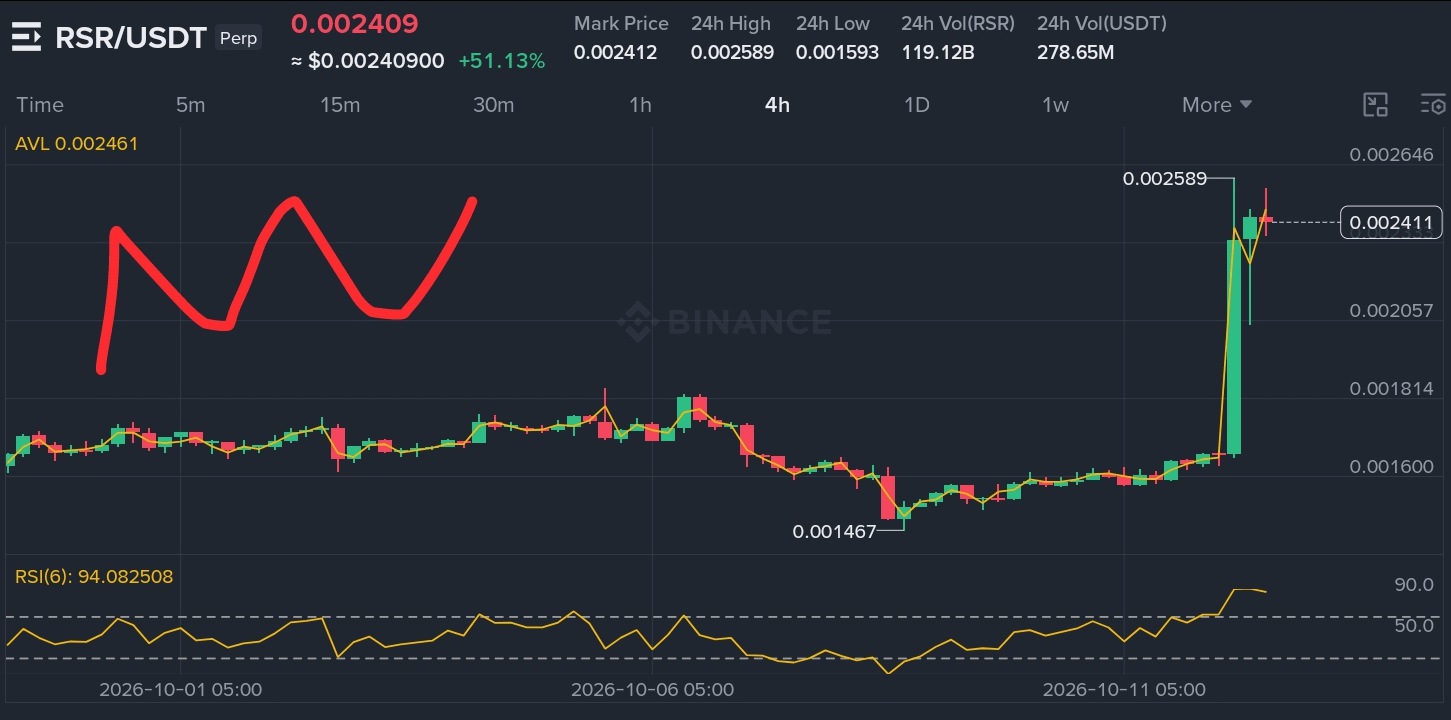
Above $0.002589 and I'm watching $0.003 first, then $0.0035. Lose $0.001467 and I'm out.

The wider market matters here. Bitcoin is holding near $83,800 after tapping $87,000 earlier this month. Dominance is sitting around 59%, up from 58.6% a week ago. That's the spine of this whole trade.
When dominance is rising, the marginal dollar is moving back toward Bitcoin. That's not an altcoin season. The Altcoin Season Index is at 61 out of 100. It was 23 a month ago. That's a sharp move, but it's still below the 75 level that confirms a full rotation. The market is in the middle zone. Some names are running. Most are not.
Open interest across crypto perps is elevated. The crowd is leaning into these meme plays and AI narratives. Where I could be wrong is if Bitcoin dominance reclaims 60% and this rotation stalls. Then the late longs get paid and these bounces fail.
I've been on the wrong side of a "confirmed breakout" before. The chart looked perfect, every box checked, and then the bid vanished. That's why I don't trust a wick at the high.
The levels are the levels. The tape will tell you which ones matter.
Are you fading the move, or are you the liquidity?