



October 12–18, 2026
Gm, and happy Columbus Day. welcome to another weekly $BTC analysis article, where I share my market views using profile charts.
If you’re new here, I’m Trader Leumas, and I use market profile to analyze market structure, participant behavior, and auction development. Without further ado, let’s get into it.
Last Week’s Recap
In my previous article, I highlighted the structural weakness that had been developing since the September 21 high.
Last week began strongly, but buyers eventually lost momentum after failing to push price beyond the $87K area. The market was then largely controlled by short and longer term timeframe (seller), who continued repairing the weak structure through initiative selling.
The 8/10 selloff was the final downside move, with sellers driving price toward the $80.3K area. Buyers responded aggressively at the lows, creating excess at the bottom of the 8/10 profile.
Dominant Concerns
The 10 year Treasury yield trading near its highest level since 2002.
The FOMC meeting on 7/10
Geopolitical tension, including Iran’s attacks on tankers, which triggered a short term market selloff.
The Week Ahead
The week has started strongly, but I’m not yet convinced that the strength will continue. I’m anticipating a possible change in tone during the week.
Short term sellers are still present, but the immediate pressure is now on both short and longer term buyers to extend price higher and demonstrate acceptance above 7/10 vaH profile.
Dominant Concern for the week
CPI news 14/10
PPI news15/10
Top Down Analysis
monthly timeframe
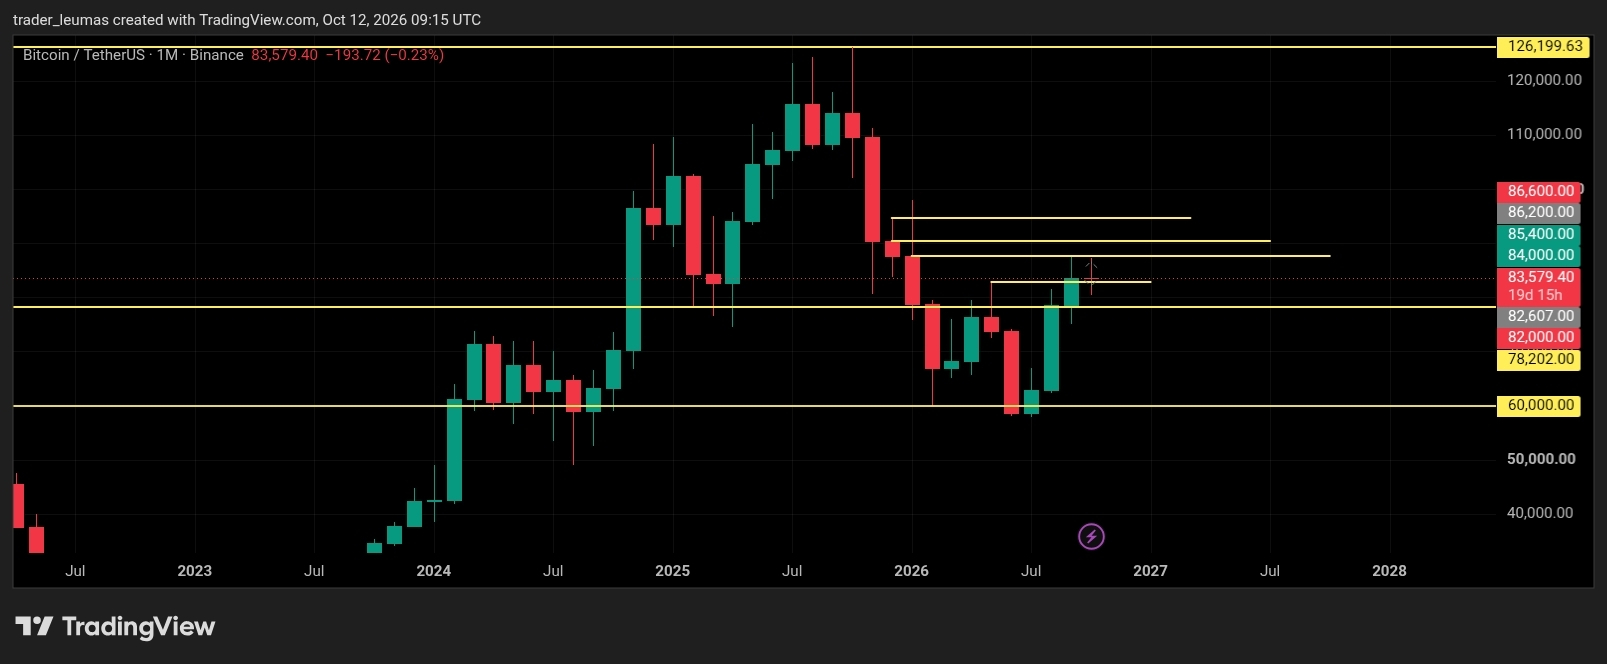
The month opened strongly, but longer-term buyers are beginning to lose momentum to sellers. It will be important to see whether sellers can gain control of the higher timeframe.
The current monthly range is approximately:
High: $87.2K.
Low: $80.3K.
weekly timeframe
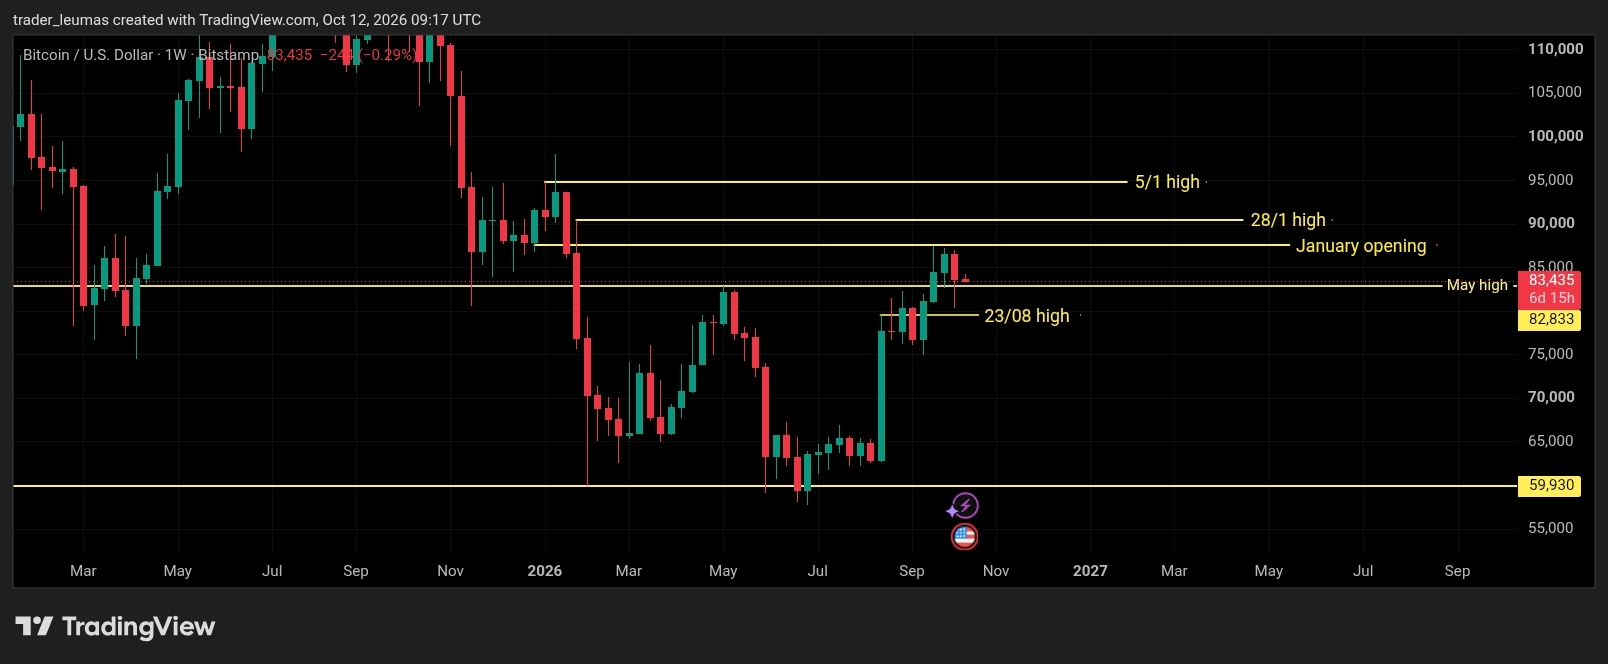
The weekly trend is still developing, but sellers dominated last week and extended the range down toward $80.3K. Buyers failed to extend price above the $87K area, leaving the weekly structure looking weak.
For the weekly trend to improve, buyers need to regain control and demonstrate acceptance above the recent resistance area.
daily timeframe
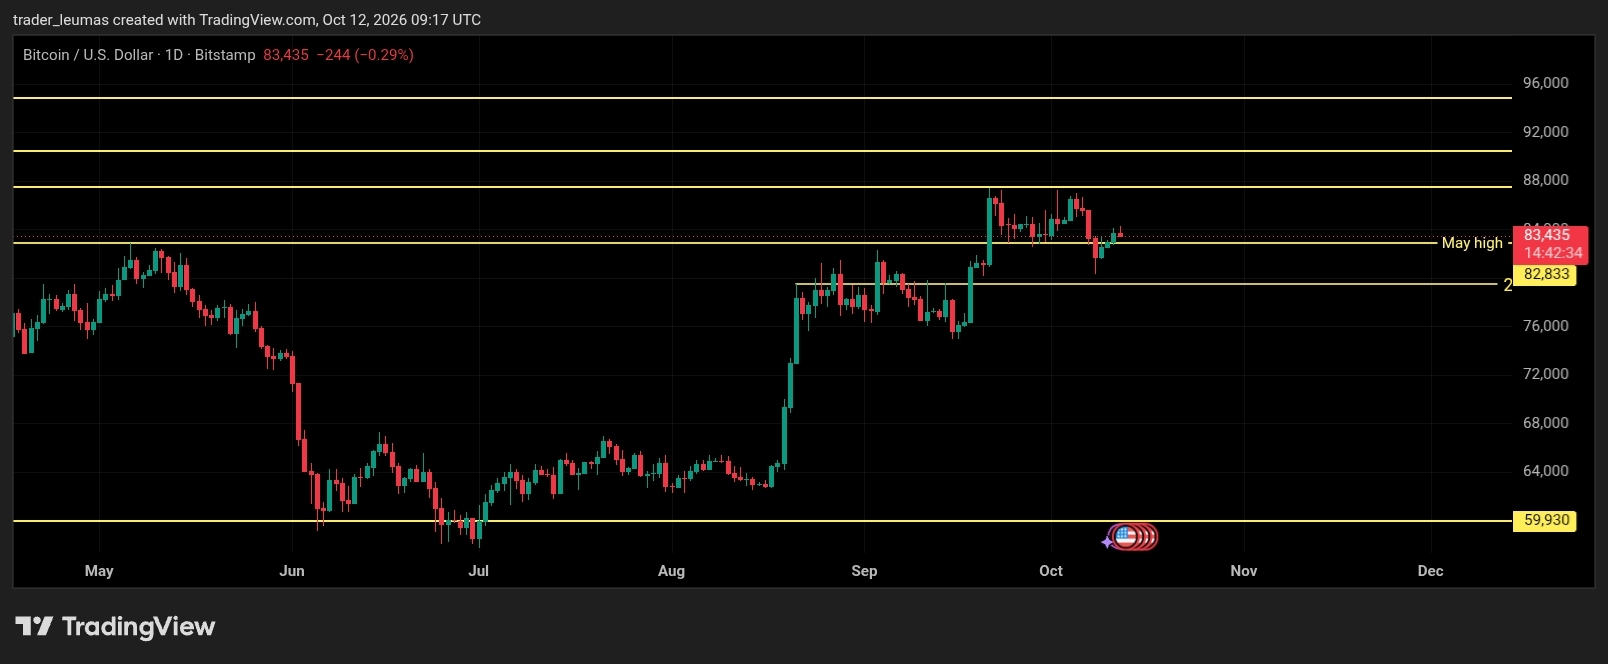
Since the October 8 selloff, the market has been recovering. Price has moved back through the October 8 range and is currently trading within the 7/10 range.
The market has already traded above the previous day’s high, so I’ll be watching whether that extension is accepted or rejected. In line with the balance concept of market profile, failure above the range could lead to a reversal back into value.
TPO Analysis(profile chart)
The week profile view
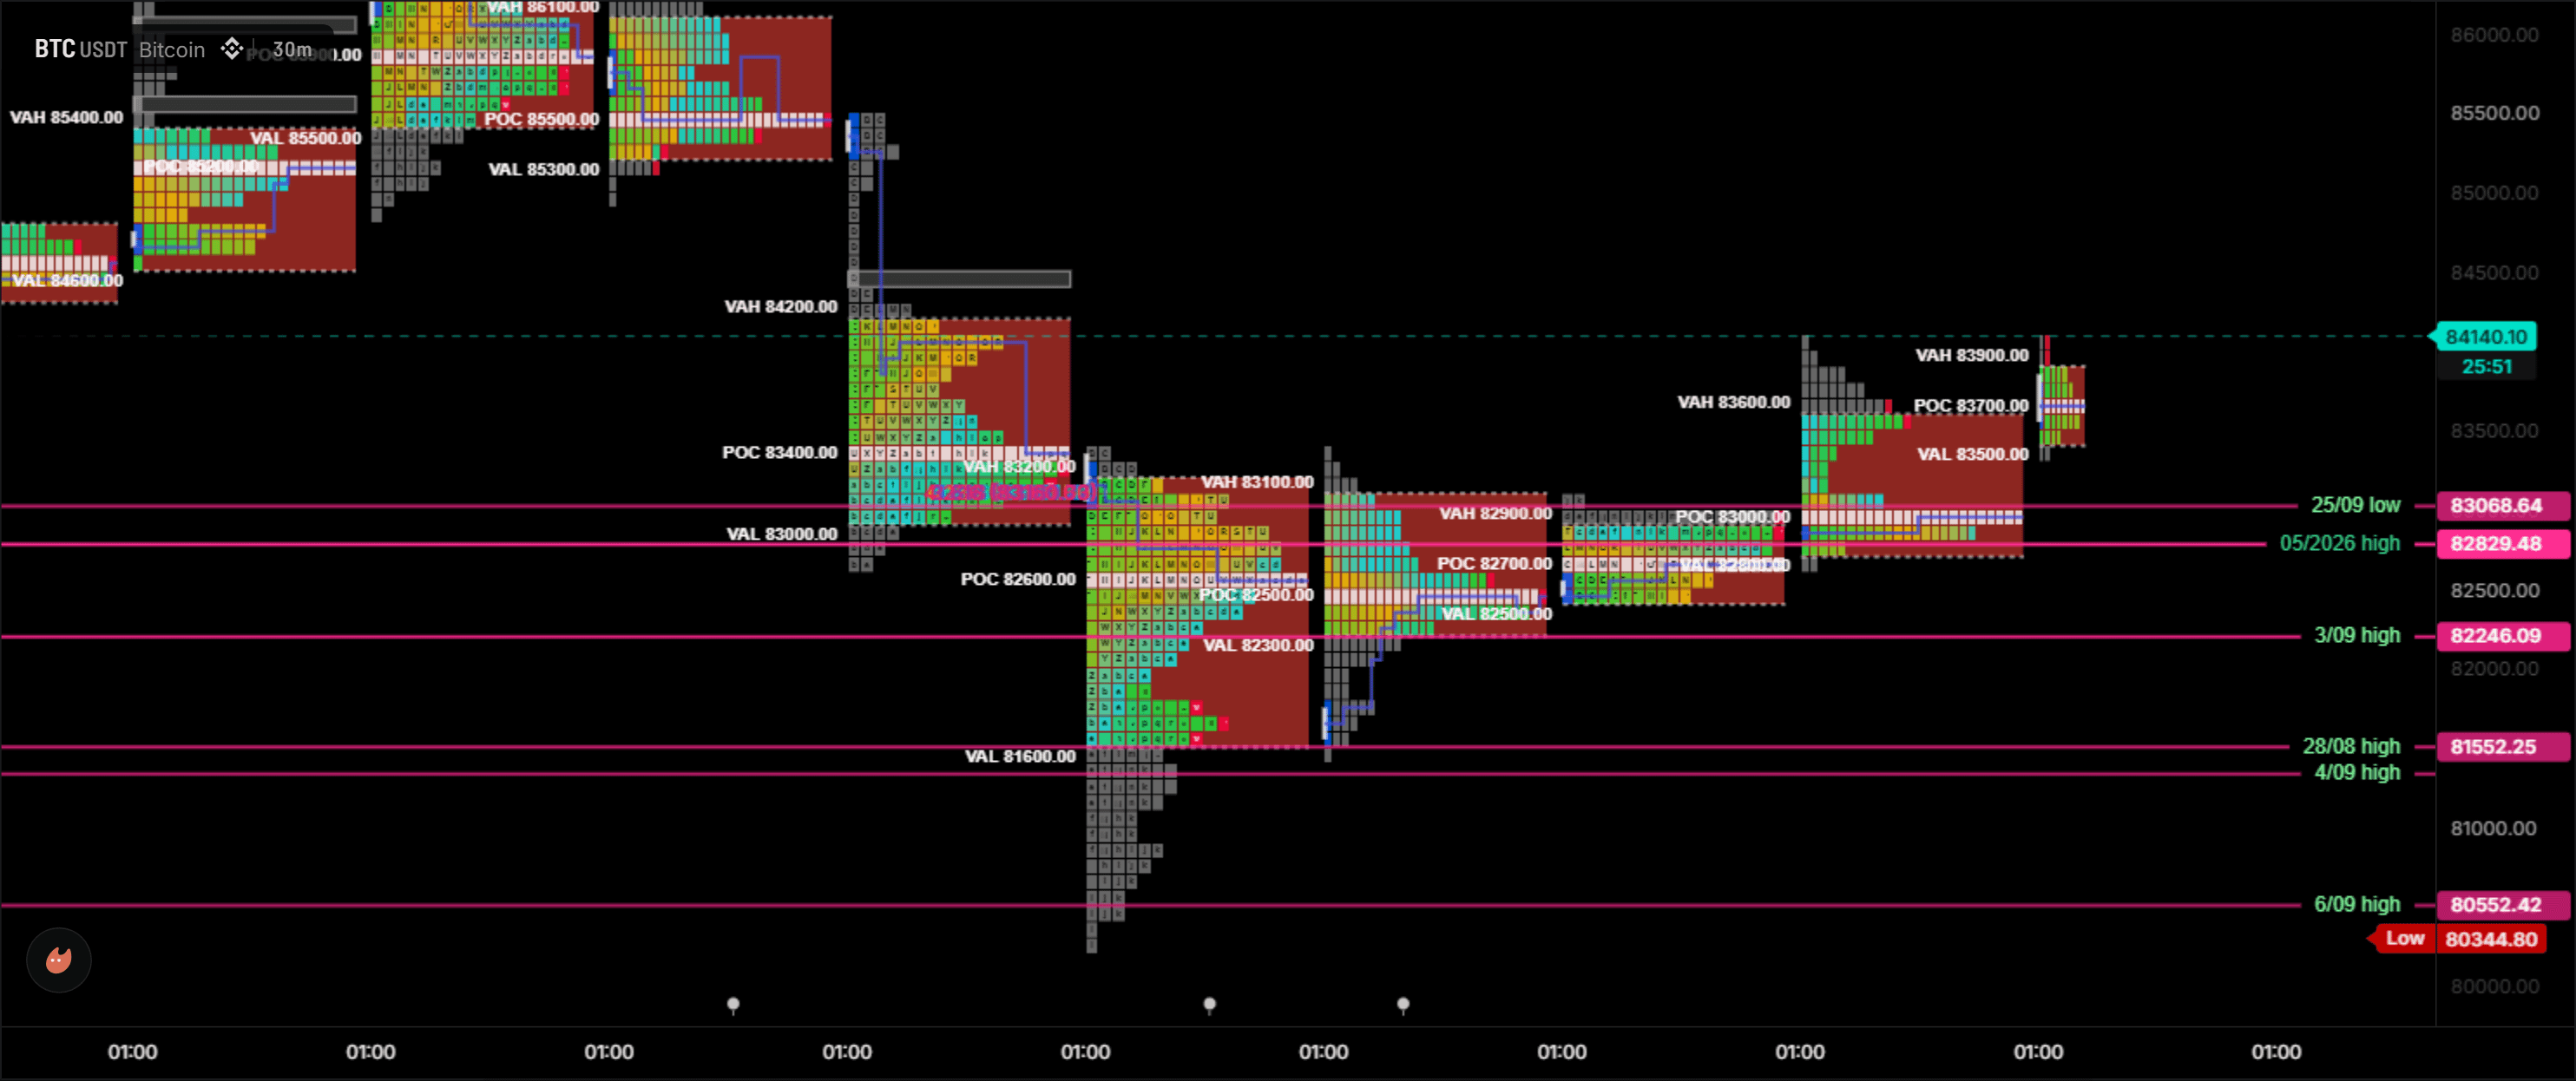
The market has unfinished business above, as it one timeframed lower for most of last week.
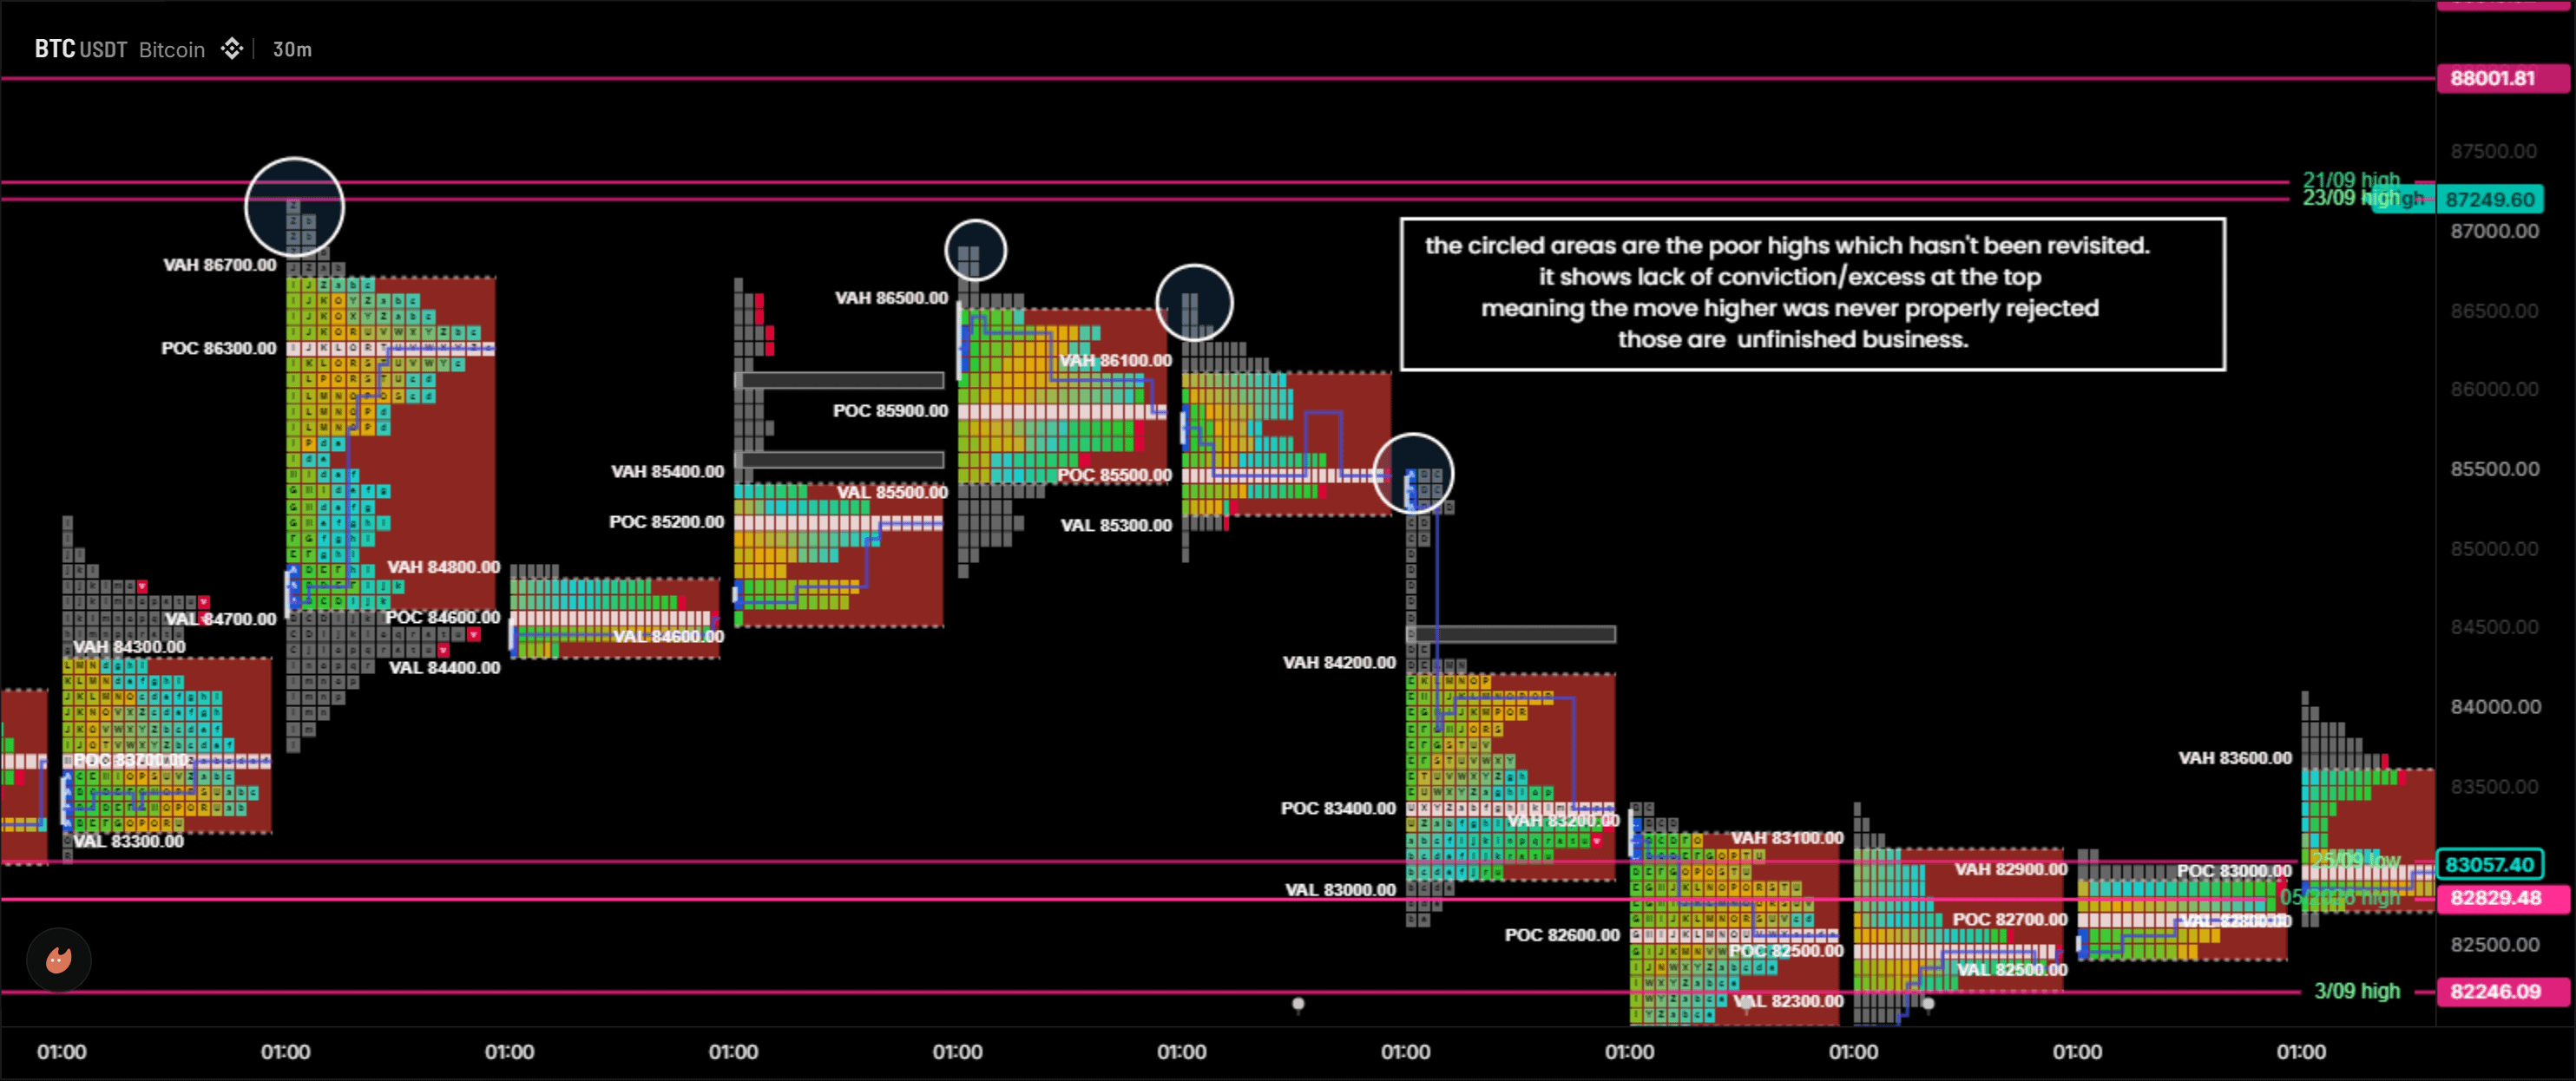
The 7/10 profile will be particularly important because it contains multiple single prints that have not yet been revisited. The POC also migrated lower as price declined, confirming that short term sellers maintained control during the move.
8/10 sellers drove price sharply lower toward $80.3K before buyers stepped in and pushed price back toward $82.5K.
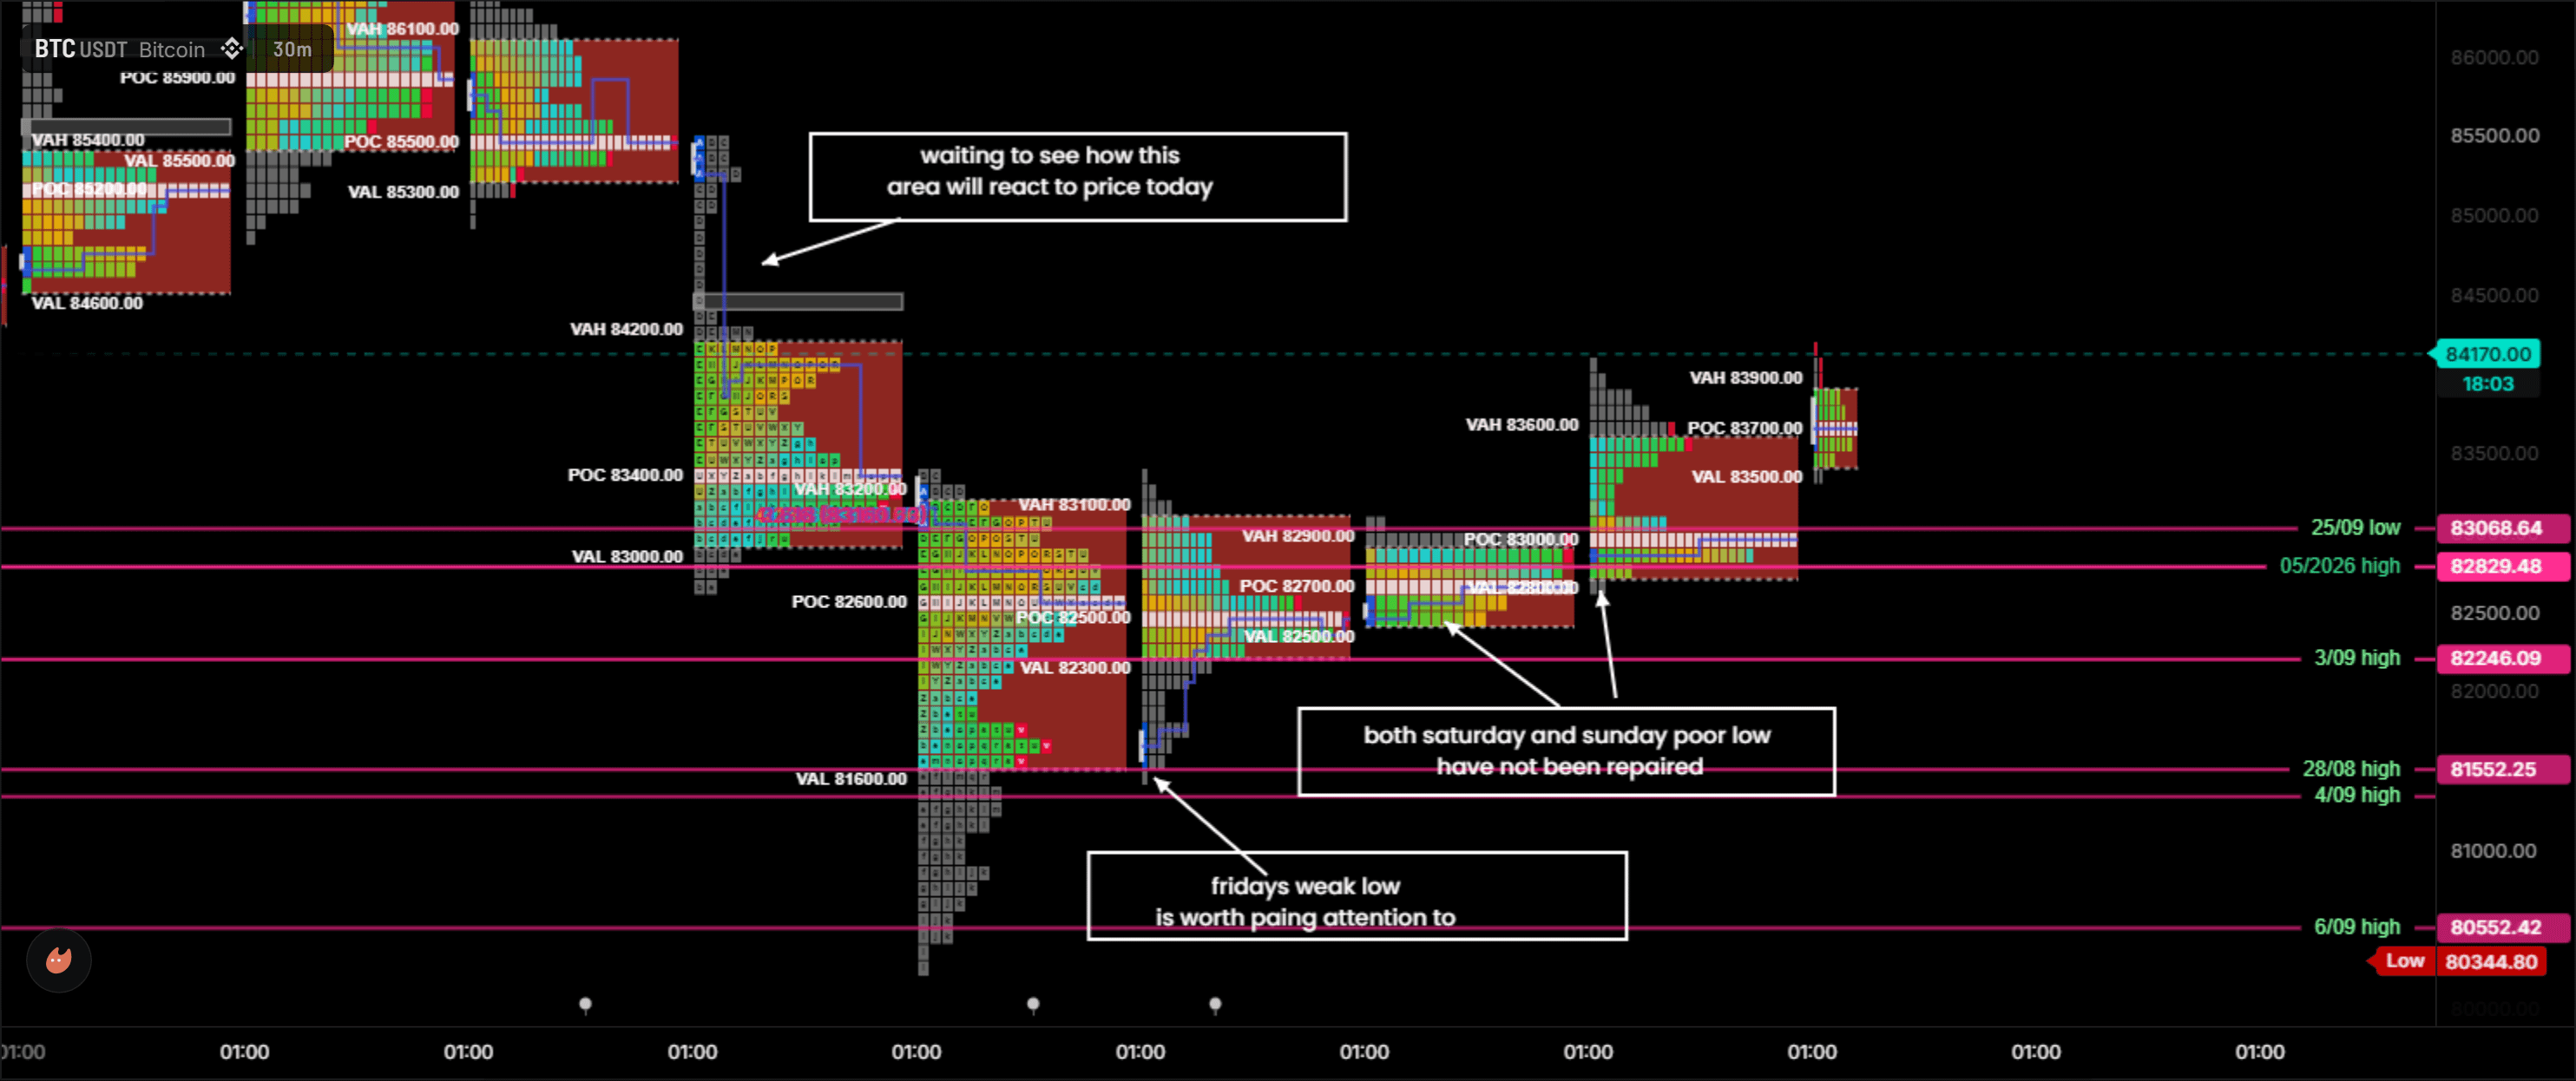
From 9/10 through 11/10, short term buyers continued to extend the recovery, bringing price toward the $83.5K–$84K area.
Trading Plan
The last three sessions developed structurally poor lows, which suggests that the downside auction may not be fully complete. However, I expect buyers to defend the $82K area if they want to establish a stronger uptrend.
The 7/10 profile remains a key reference. Since the market has already found acceptance inside that profile’s value area, I’m now watching to see whether buyers can achieve acceptance above its value area high.
Key Focus
14/10 and 15/10 news
The poor lows from the last three sessions.
Acceptance or rejection above the 7/10 value area high.
If you enjoyed this analysis, follow me for more weekly Bitcoin breakdowns using Market Profile charts.
This article is for educational purposes only and is not financial advice.