

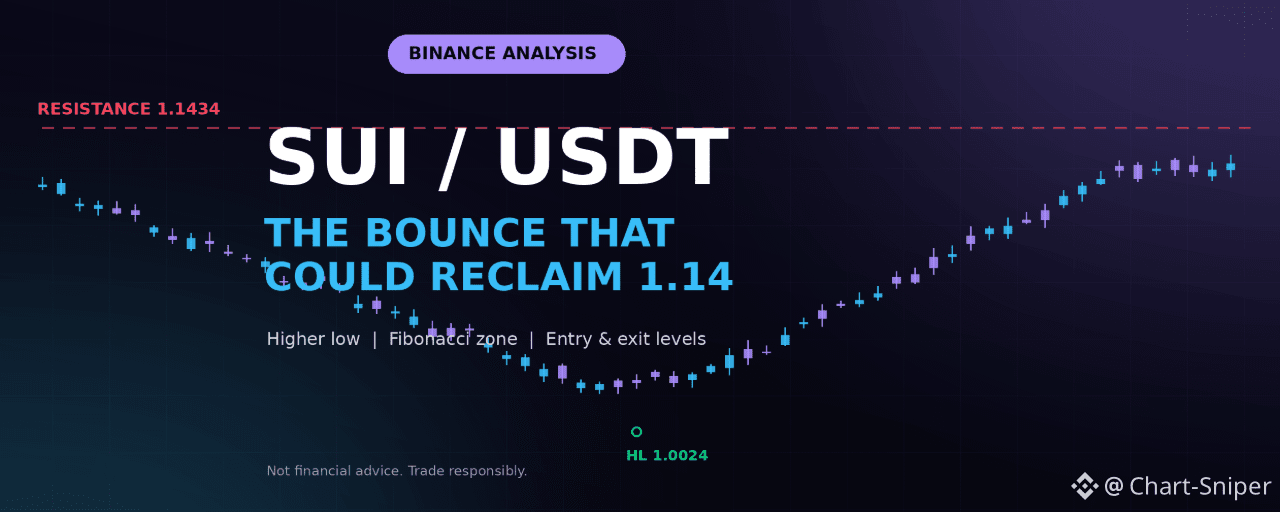


Pair: SUI/USDT Perpetual | Timeframe: 1H | Exchange: Binance | Chart date: Oct 9–10, 2026 (UTC)
Market Overview
SUI/USDT is trading around 1.0644, up modestly on the session after a violent round trip. The pair fell hard from a swing high near 1.1434, through a lower low, and ultimately flushed down to a higher low (HL) at 1.0024 — a key round-number support zone. Since that low, buyers have stepped in aggressively, pushing price back up along a steep recovery trendline and reclaiming the mid-range of the recent sell-off.
The question now is whether this bounce is the start of a real recovery or just a relief rally inside a larger downtrend, since price is still printing lower highs (LH) on the way down.
Key Observations From the Chart
1. Structure still bearish on the higher timeframe. The sequence LL → LH → LH shows sellers have been in control since the 1.1434 high. The bounce from 1.0024 is encouraging, but it hasn't yet produced a higher high to confirm a trend change.
2. Major resistance at 1.1434. This is the swing high and the 0% Fibonacci anchor. It's the level that needs to break for the broader downtrend to be invalidated.
3. Fibonacci retracement zone. Measuring the drop from 1.1434 down to the 1.0024 low:
38.2% sits near 1.0833
50% sits near the mid-1.07s
61.8% sits near 1.0520
Price is currently trading below the 38.2% level, meaning the recovery still has work to do before it challenges the more significant resistance zones above.
4. The 1.0024 higher low is critical support. This round number held firmly during the flush and triggered the current bounce. As long as pullbacks respect this level, the bulls retain the benefit of the doubt on the short-term timeframe.
5. Steep recovery trendline. The sharp rally off the HL is a strong momentum signal, but such fast moves often retest before continuing — a pullback toward the trendline or the 61.8% zone would be a healthier, more tradable setup than chasing strength here.
Trade Scenarios
Scenario A: Buy the Pullback (Preferred)
Wait for price to retrace into the Fibonacci zone and the rising trendline before buying, rather than chasing the current bounce.
Entry zone: 1.0520 to 1.0350
Stop-loss: 1.0150 (below the HL and round-number support)
Take-profit 1: 1.0833
Take-profit 2: 1.1100
Take-profit 3: 1.1434 (major resistance)
Scale in across the zone, and move your stop to breakeven once TP1 is reached.
Scenario B: Breakout Long
If price clears resistance decisively instead of pulling back, confirmation matters more than speed.
Trigger: A 1H candle close above 1.1450
Entry: On the close, or on a retest of 1.1434 as new support
Stop-loss: 1.1050
Take-profit 1: 1.1800
Take-profit 2: 1.2000
Take-profit 3: 1.2200 (prior high)
Scenario C: Bearish Invalidation
If the higher-low structure fails and price breaks the recent support, the downtrend likely resumes.
Trigger: 1H close below 1.0000
Short entry: On a retest of 1.0000–1.0024 from below
Stop-loss: 1.0280
Take-profit 1: 0.9700
Take-profit 2: 0.9460
Take-profit 3: 0.9200
Risk Management Tips
Risk only 1% to 2% of your account per trade.
SUI has shown very wide, fast candles on this chart — keep leverage conservative (3x to 5x at most).
Avoid entering in the middle of the range (1.06 to 1.08), where risk/reward is poor in both directions.
Always set your stop-loss the moment you open a position.
Watch Bitcoin and broader market sentiment — a sharp rebound in one altcoin can stall quickly if the wider market stays weak.
Conclusion
SUI/USDT is attempting to stabilize after a sharp decline, with the 1.0024 higher low acting as the key support that sparked the current bounce. A pullback into the 1.035–1.052 zone followed by renewed strength would support further upside toward 1.14, while a breakdown below 1.00 would reopen the downside. Let the chart confirm direction before committing size.
Disclaimer: This article is for educational and informational purposes only and is not financial advice. Cryptocurrency and derivatives trading carry a high risk of loss, and you can lose more than you expect, especially with leverage. Entry, stop-loss and target levels are based on chart analysis and are not guaranteed. Always do your own research and only trade with money you can afford to lose.
@Binance Square Official #BitcoinReboundsTo$83K #EthereumLiquidationsHit$356M #BitcoinETFsSee$244MNetOutflows #Binance #ChartSniper