


━━━━━━━━━━━━━━━
Hey traders!
ETH just did what ETH does best: it made everyone stop scrolling.
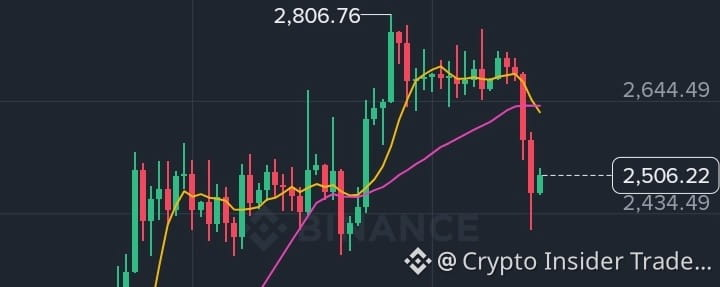
Early October, the price was hovering near the $2,700 zone. Ethereum started October 2026 near $2,690. Fast forward to today, and the ETHUSDT chart shows price around $2,500 (about -1.6% on the day, with a 24h range of roughly $2,405 to $2,542).
So what changed? And more importantly, what should a smart trader be watching right now?
Let's break it down step by step.
━━━━━━━━━━━━━━━
◆ ① THE BIG PICTURE (Daily Chart)
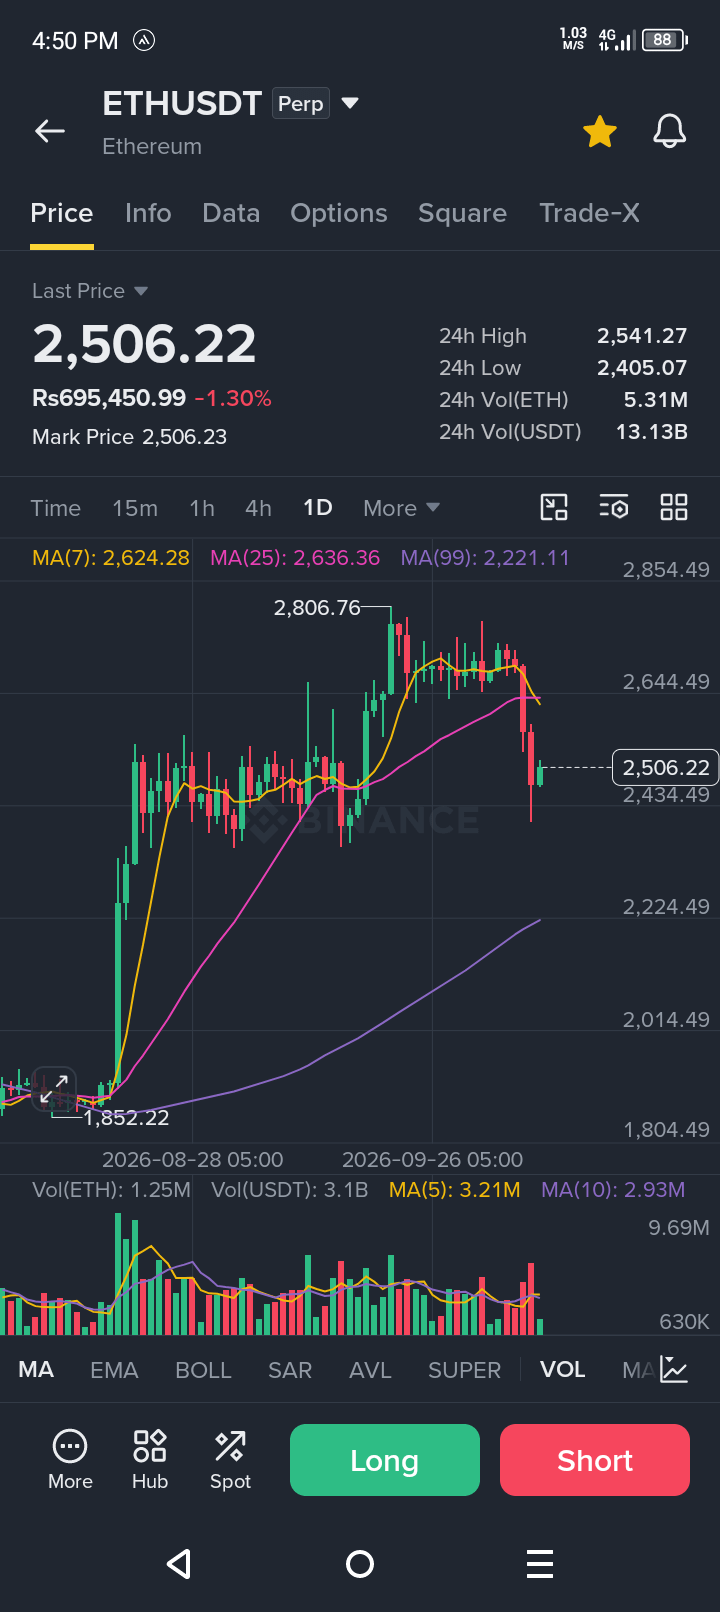
➤ Price climbed hard from the lows near $1,830 in August, one of the strongest recoveries on the chart.
➤ The rally topped out near $2,806.
➤ Since then, ETH has been consolidating, then slipped.
➤ A large red daily candle recently broke below the short-term moving averages.
✔︎ Translation: The market went from "strong momentum" to "let's pause and re-think."
━━━━━━━━━━━━━━━
◆ ② MOVING AVERAGES: THE QUIET STORYTELLERS
On the daily chart:
➜ MA(5): around $2,590
➜ MA(10): around $2,642
➜ MA(20): around $2,670
Price is now trading BELOW all three.
✔︎ What it suggests: short-term momentum has cooled.
✔︎ The averages are starting to curl and tighten, which often shows up when a market is deciding its next direction.
✔︎ Former support areas can act as resistance when price comes back up to test them.
Think of moving averages like a crowd's mood. Right now, the crowd is cautious.
━━━━━━━━━━━━━━━
◆ ③ KEY LEVELS TO WATCH
➤ Support zone: $2,400 to $2,365, where recent daily wicks and the 24h low have shown buyers stepping in.
➤ Deeper reference: The $2,069 area, which appears on the chart as a major structural level.
➤ Resistance zone: $2,590 to $2,670, where the moving averages are stacked.
➤ Major swing high: $2,806, the level that would signal a real change in structure.
✔︎ These are reference points for study, not predictions. Markets can and do move through any level.
━━━━━━━━━━━━━━━
◆ ④ VOLUME AND POSITIONING
➤ The recent sell-off candle came with a visible volume spike, which shows the move had real participation.
➤ Today's volume is still building, so the current candle isn't a finished story yet.
➤ Open interest sits near $986M on the perpetual market, which means plenty of leveraged positions are live.
⚠︎ High open interest plus a sharp move can mean faster, more emotional price swings. This is where leverage turns small mistakes into big ones.
━━━━━━━━━━━━━━━
◆ ⑤ THE MACRO BACKDROP
ETH doesn't trade in a bubble. Recent reports point to spot Ethereum ETF outflows, with price struggling to clear resistance. Ether has been struggling at resistance with ETF outflows signaling weaker demand. Meanwhile, Bitcoin has been strong, which tells us capital is being selective right now.
✔︎ When ETH lags BTC, traders often watch the ETH/BTC relationship closely.
✔︎ Headlines, ETF flows, and broader risk sentiment can all move price in minutes.
━━━━━━━━━━━━━━━
◆ ⑥ THREE SCENARIOS TO STUDY
① Stabilization
Price holds the $2,400 zone and builds a base, which would show buyers defending the area.
② Relief bounce
Price reclaims the $2,590 to $2,670 moving average zone, which would improve the short-term picture.
③ Extended weakness
Price loses the $2,365 area on strong volume, which would put deeper levels back on the radar.
✔︎ Pros don't predict. They prepare for all three.
━━━━━━━━━━━━━━━
◆ ⑦ THE PSYCHOLOGY PART MOST PEOPLE SKIP
After a drop like this, two things happen:
➜ Some traders rush in because "it's cheap now."
➜ Others panic because "it's going lower."
Both are emotional reactions, not strategies.
The calmer approach:
✔︎ Wait for confirmation instead of guessing.
✔︎ Decide your risk BEFORE you think about reward.
✔︎ Size positions so one bad trade doesn't hurt you.
✔︎ Remember that no trade is also a position. 😉
━━━━━━━━━━━━━━━
◆ ⑧ QUICK TAKEAWAYS
✔︎ ETH is trading below its short-term daily moving averages.
✔︎ $2,400 and $2,590 are the zones worth watching.
✔︎ Volume and open interest show the market is active and sensitive.
✔︎ Patience and risk control matter more than any single prediction.
━━━━━━━━━━━━━━━
YOUR TURN!
Where do you see ETH heading next? Are you watching $2,400 or waiting for the moving averages to be reclaimed?
➜ Drop your view in the comments.
➜ Like and share this with a trader friend who needs a clear chart breakdown.
➜ Follow for daily market breakdowns and trading psychology insights.
━━━━━━━━━━━━━━━
#EthereumSurpasses$2500 #SolanaPlansToCutBlockTimesTo200ms #ReusedBitcoinAddressesHold4.33MBTC #Ethereum #ETH
