


As of October 9, 2026, Dogecoin price trades at $0.08534 on Binance, with hourly recovery signals clashing against a bearish daily structure. The daily regime is neutral but sits below all three daily EMAs as momentum deteriorates. This is a recovery attempt inside weak broader structure.
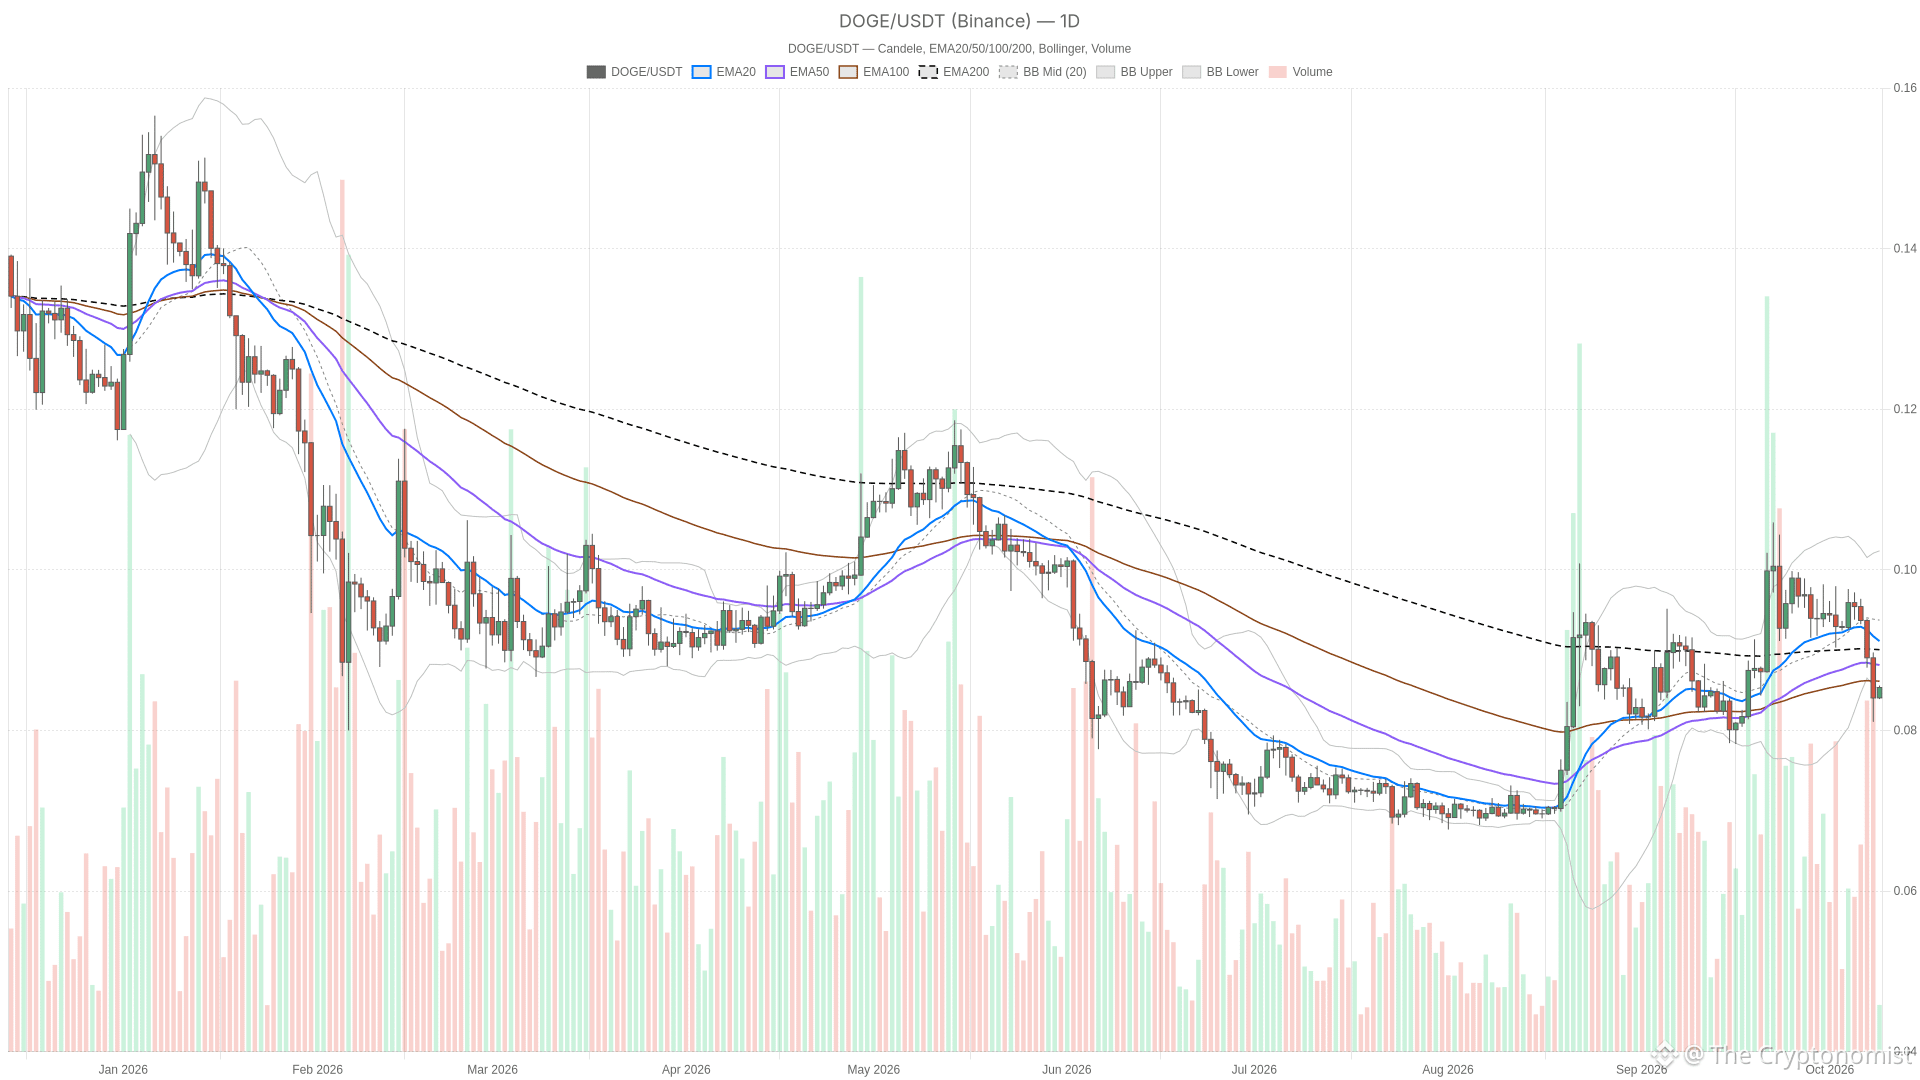 DOGE/USDT — daily chart with candlesticks, EMA20/EMA50 and volume.
Key takeaways
Dogecoin trades at $0.08534, below all three daily EMAs despite short-term recovery signals on the hourly chart.
Daily RSI at 38.8 shows weakness without reaching oversold territory, while the daily MACD histogram is negative and widening.
The nearest resistance is the daily Bollinger lower band at $0.08564; a daily close above it is the first recovery trigger.
Fear & Greed Index at 59 (Greed) contrasts with Dogecoin’s defensive daily structure.
All-time DEX volumes on dogechain provide no evidence of fresh demand behind the current recovery.
Dogecoin price faces $0.08564 before a broader recovery can develop
A daily close above the daily Bollinger lower band at $0.08564 is required before any broader recovery can take shape. Below price, the daily pivot at $0.08494 serves as the first support, with daily S1 at $0.08018 below that. Re-entering the daily band would improve the mean-reversion case; losing the pivot would leave the recovery without its nearest daily foothold.
Bullish scenario: A daily close above the daily Bollinger lower band at $0.08564 would establish the first recovery trigger. The next resistance is the daily EMA50 at $0.08826, followed by daily R1 at $0.08881. This scenario would be invalidated by a subsequent daily close below the daily pivot at $0.08494. Even a successful band reclaim would represent structural repair, not proof of a fully bullish trend.
The hourly snapshot is more finely balanced: price is at $0.08536, just below the hourly pivot at $0.08538, although the last completed hourly candle finished above it at $0.08541. That pivot reclaim has therefore already occurred on a completed candle and should not be presented as a pending breakout. Hourly R1 at $0.08552 is the next resistance above price.
Bearish scenario: An hourly close below hourly S1 at $0.08526 would signal failure of the immediate recovery, exposing the hourly EMA20 at $0.08520 and then the daily pivot at $0.08494. A subsequent hourly close back above the hourly pivot at $0.08538 would invalidate that breakdown setup. The wider daily downside reference remains daily S1 at $0.08018.
The likeliest false signal is a brief push through nearby hourly resistance that fails to reclaim the daily band on a completed daily candle. The tight hourly levels and much larger daily volatility make an intraday breakout less decisive than it appears.
RSI improves intraday while daily MACD pressure deepens
Short-term momentum is improving, yet the daily picture continues to weaken. Daily RSI is falling and stands at 38.8: weak, but not oversold. Hourly RSI is rising across the supplied completed readings and stands at 48.3, still below the midpoint. The 15-minute reading is rising at 60.9. Together, these readings support a short-term recovery in momentum without overturning the daily weakness.
MACD draws a sharper distinction. The daily histogram is negative and widening, showing worsening downside momentum. The hourly histogram is positive but classified as flat, so it supports stabilization rather than accelerating upside strength. On the 15-minute chart, the histogram is negative and widening despite rising RSI. That conflict makes execution-level strength less convincing: the shorter chart does not offer clean momentum confirmation.
Price remains below daily averages despite short-term support
Dogecoin trades below all three daily EMAs, keeping the broader bias bearish even as intraday signals improve. Binance-derived daily EMAs place the EMA20 at $0.09173, the EMA50 at $0.08826 and the EMA200 at $0.09010. Price is below each, but the averages are not aligned in textbook bearish order. The bearish bias comes from price location and weakening momentum, not from a fully stacked daily downtrend.
Hourly price is above the EMA20 at $0.08520 but below the EMA50 at $0.08707 and EMA200 at $0.09149. Those hourly averages are bearishly aligned, which limits the structural significance of the short-term recovery. On the 15-minute chart, price is above the EMA20 at $0.08518 and EMA50 at $0.08498 but below the EMA200 at $0.08713; those averages are not aligned. The execution chart is firmer than the daily chart, but still incomplete.
The daily Bollinger midpoint is $0.09385 and its upper band is $0.1021. With price beneath the lower band, mean reversion is a plausible recovery framework, not a confirmed reversal. Hourly price sits above the hourly Bollinger midpoint at $0.08456 but below the hourly upper band at $0.08747, reinforcing the contrast between local recovery and broader weakness.
Daily ATR is $0.005331, compared with hourly ATR of $0.0008082 and 15-minute ATR of $0.0002549. These volatility readings put the narrow pivot gaps in perspective: crossing a nearby level alone is weaker evidence than closing beyond it and sustaining the relevant scenario.
ETF headlines and testnet development do not resolve the chart
Recent news around a Dogecoin ETF and DeFi testnet provides context but no directional signal for the current price. The Block’s October 8, 2026 report presented the Bitwise CEO’s view that the Dogecoin ETF failure showed a gap between ETF buyers and crypto-app users. Cryptonomist reported on October 2, 2026 that a Dogecoin DeFi testnet launched with Ethereum compatibility. These offer contrasting demand and development context, but neither headline establishes what caused the current price movement.
The supplied DEX data lists all-time DEX trading volume on dogechain of $58,675,096.00 for Yodeswap, $15,868,108.00 for Quickswap V3 and $633,533.00 for Wojak Finance. These are venue volumes on the blockchain, not Dogecoin-specific volume, fees or revenue. Without a comparable recent-period series, they cannot confirm fresh demand behind the recovery.
Greed contrasts with Dogecoin’s defensive daily structure
Broader market sentiment reads as Greed, yet Dogecoin’s own technical structure remains defensive. Alternative.me’s Fear & Greed Index is 59, classified as Greed. CoinGecko places total crypto market capitalization at $2.80 trillion and Bitcoin dominance at 59.07%. These broad readings do not establish a directional change in dominance or confirm strength in Dogecoin. The sentiment label is more constructive than the asset’s daily technical structure, leaving any recovery dependent on its own resistance tests.
FAQ
Is Dogecoin oversold in this snapshot?
No. Daily RSI is 38.8, while hourly RSI is 48.3 and 15-minute RSI is 60.9. None of these readings sits below the oversold threshold.
Does the dogechain DEX data show current Dogecoin demand?
No. The supplied figures are all-time venue trading volumes on dogechain, not Dogecoin-specific activity or a recent-period comparison that could confirm fresh demand.
Disclaimer: This article is for informational purposes only and does not constitute financial advice, an investment recommendation, or a solicitation to buy or sell any financial instrument or cryptocurrency. The analysis provided is not indicative of future results. Investing in crypto assets and financial markets carries a high risk of capital loss. Always do your own research (DYOR) and consult a qualified financial advisor before making any decision.
Article produced with the assistance of artificial intelligence and reviewed by the editorial team.