


If you're new to Bitcoin trading, the biggest mistake you can make is trying to predict every move.
You don't need 20 indicators on your screen.
You need to understand a few important signals and, more importantly, learn how to combine them.
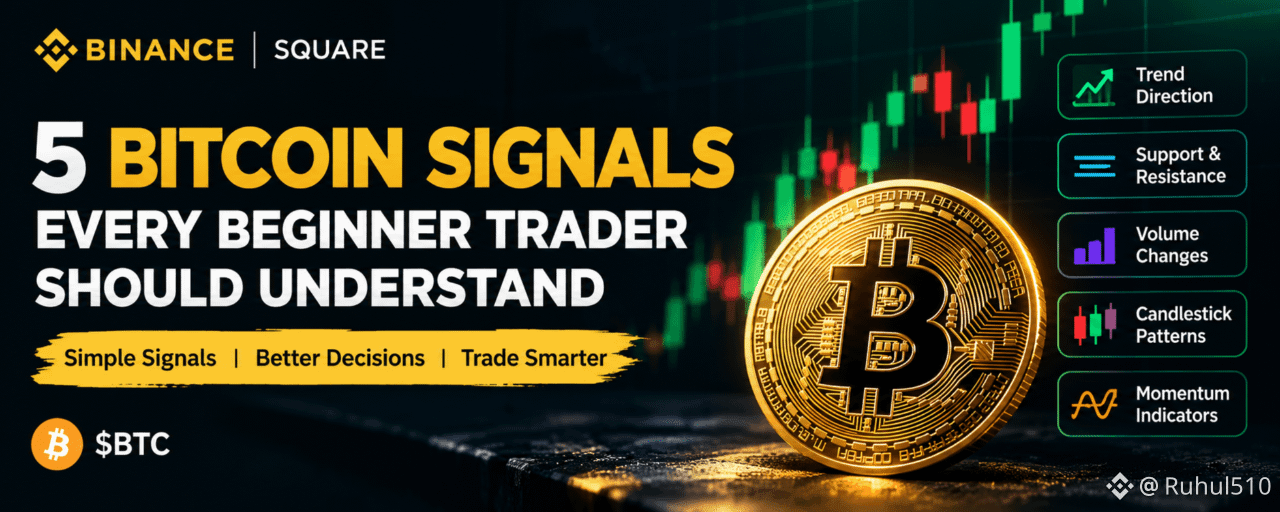
Here are 5 Bitcoin signals I believe every beginner trader should understand before making a trading decision.

1. Trend Direction
Before looking for an entry, ask a simple question:
What is the market actually doing?
Bitcoin generally moves through three conditions:
Uptrend → Higher highs and higher lows
Downtrend → Lower highs and lower lows
Range → Price moves between established support and resistance
This sounds simple, but many beginners ignore it.
They see Bitcoin falling and immediately look for a buy.
Or they see a strong green candle and immediately chase the move.
Instead, start with the market structure.
If Bitcoin is consistently creating higher highs and higher lows, buyers are showing strength.
If the structure changes to lower highs and lower lows, sellers may be gaining control.
The trend gives you the context.
2. Support & Resistance
Support and resistance are two of the most basic concepts in technical analysis.
Think of support as an area where buying interest has previously appeared.
Resistance is an area where selling pressure has previously appeared.
But there's an important detail beginners often miss:
Support and resistance are usually zones, not perfectly precise lines.
Bitcoin can move slightly above or below a level before reversing.
That's why I prefer asking:
“How is price behaving around this zone?”
rather than:
“Did Bitcoin touch my exact line?”
Another useful concept is the support-resistance flip.
If Bitcoin breaks above a resistance zone and later holds that same area as support, the market structure can become more interesting for buyers.
The opposite can happen when support breaks and later acts as resistance.
3. Volume Confirmation
Price tells you what happened.
Volume can help you understand how much participation was behind the move.
Imagine Bitcoin breaks above resistance.
That looks bullish.
But what if the breakout happens with very weak volume?
I would be more cautious.
Now imagine Bitcoin breaks above resistance while trading activity expands significantly.
That provides stronger confirmation that the move is attracting participation.
This doesn't mean:
High volume = price must go up.
Volume can increase during selling as well.
The important question is:
What is price doing while volume is increasing?
A strong move combined with meaningful volume can provide more useful information than price alone.
4. Candlestick Behaviour
You don't need to memorize dozens of candlestick patterns to become a better trader.
Start by understanding what a candle is telling you about the battle between buyers and sellers.
A candlestick gives you four important pieces of information:
Open
High
Low
Close
The body shows the distance between the opening and closing prices, while the wicks show where price moved during that period.
For example:
A large bullish candle can show strong buying pressure during that timeframe.
A long upper wick near resistance may show that buyers pushed price higher but sellers rejected the move.
A strong bearish candle near support can indicate increasing selling pressure.
But here's the key rule:
Never trade a candlestick pattern in isolation.
A bullish candle at important support can mean something very different from the same candle appearing in the middle of a random range.
Context matters.
5. Momentum
The fifth signal is momentum.
Momentum helps traders understand whether the strength behind a price move is increasing or decreasing.
One commonly used momentum indicator is the Relative Strength Index (RSI).
RSI ranges from 0 to 100 and is often used to evaluate the strength and speed of recent price movements.
But beginners often make one mistake:
They see RSI above 70 and immediately think:
“Bitcoin must fall.”
Or RSI below 30 and think:
“Bitcoin must rise.”
That's not how I would use it.
Strong trends can remain overbought or oversold for longer than many traders expect.
Instead, use momentum as context.
For example:
Bitcoin is making a new high, but momentum is failing to make a corresponding new high.
That divergence may be worth investigating.
It doesn't automatically mean a reversal is coming.
It simply tells you:
“Pay closer attention.”
The Real Secret: Combine the Signals
Here's where things become more interesting.
Imagine Bitcoin reaches a major resistance zone.
At the same time:
The overall trend is bullish
Volume increases
A strong bullish candle closes above resistance
Momentum remains strong
Price successfully retests the breakout zone
Now you have several pieces of information pointing in the same direction.
That's called confluence.
And confluence is much more useful than relying on a single indicator.
The same principle works on the bearish side.
If the trend weakens, support breaks, selling volume increases, price rejects a retest, and momentum deteriorates, the bearish case becomes more interesting.
Still, none of these signals guarantees what Bitcoin will do next.
What I Would Check Before Any BTC Trade
Before considering a trade, I would ask myself:
1. What is the current market structure?
2. Where are the major support and resistance zones?
3. Is volume confirming the move?
4. What are the candles telling me?
5. Is momentum supporting or contradicting the price action?
6. Where is my setup invalidated?
That last question is extremely important.
A trading idea is incomplete if you don't know when your idea is wrong.
Final Take
You don't need a chart full of indicators to analyze Bitcoin.
You need to understand what price is telling you.
Trend gives you direction.
Support and resistance give you important zones.
Volume gives you participation.
Candlesticks show price behaviour.
Momentum gives you additional context.
But the strongest approach is not to trust one signal blindly.
Look for confirmation.
The goal isn't to predict every Bitcoin move.
The goal is to build a process that helps you make better decisions when the market gives you an opportunity.
Which of these 5 signals do you find most useful when analyzing Bitcoin?
This content is for educational and informational purposes only and is not financial advice. Crypto markets are highly volatile. Always conduct your own research and manage your risk before trading.