Ever bought a coin just because an indicator claimed it was "oversold," only to watch the price plunge even further? ⚡
That usually happens when you misread momentum. Enter the Relative Strength Index (RSI), a popular metric that measures market momentum on a scale from 0 to 100.
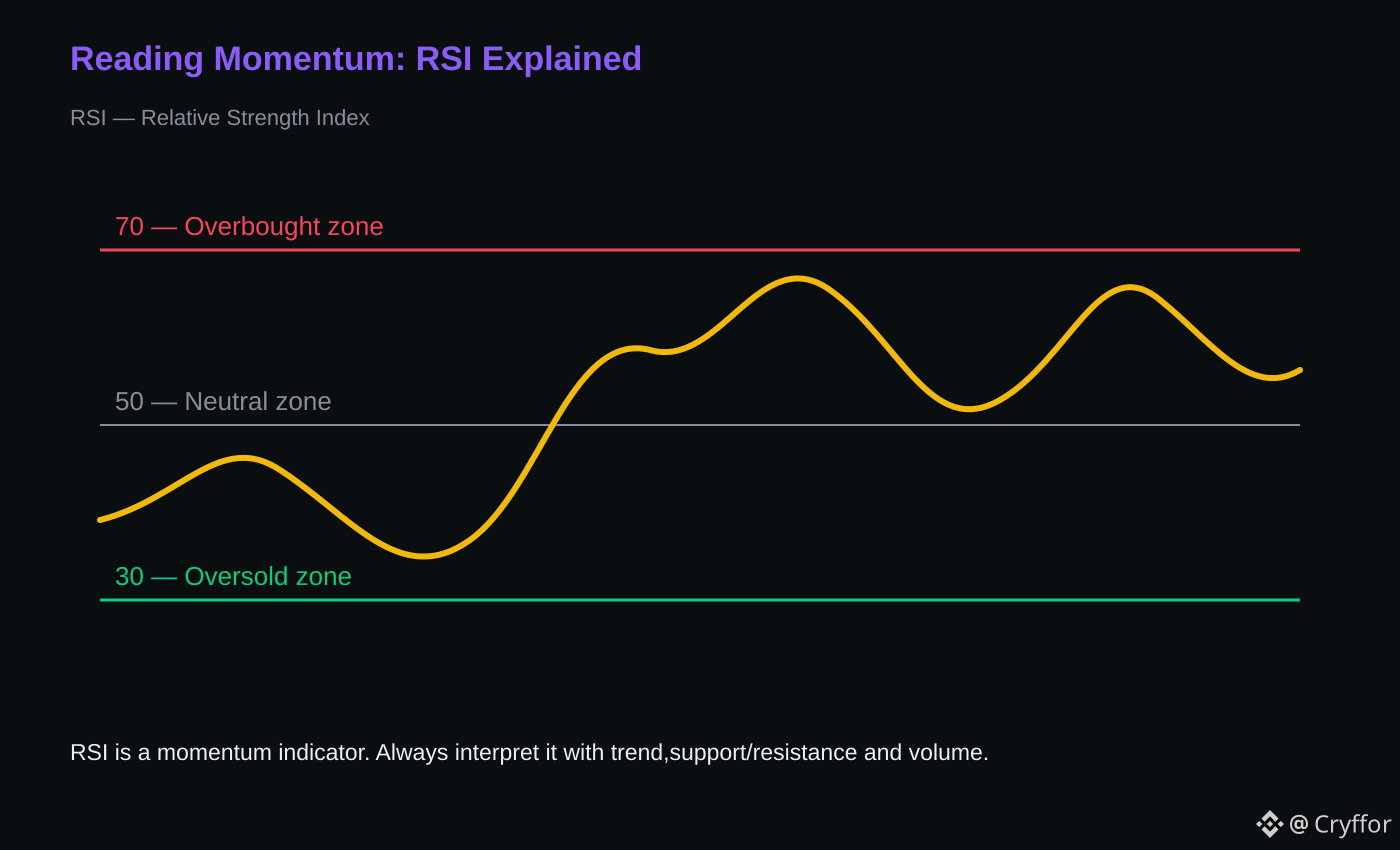
Here is how the scale breaks down:
• Above 70: Signals strong momentum, though the move may be getting overextended.
• Around 50: Represents balanced momentum.
• Below 30: Signals weak or potentially oversold momentum.
The biggest trap traders fall into is relying on RSI by itself. An extreme reading is never a guaranteed reversal trigger. For reliable confirmation, you must always pair RSI with price structure, market trend, and volume. 🧭
Treat RSI as a single piece of evidence rather than a standalone decision-maker. 🎯
How often do you combine indicators with overall market structure before entering a trade?
#CryptoTrading #RSI #TechnicalAnalysis #BinanceSquare
That usually happens when you misread momentum. Enter the Relative Strength Index (RSI), a popular metric that measures market momentum on a scale from 0 to 100.
Here is how the scale breaks down:
• Above 70: Signals strong momentum, though the move may be getting overextended.
• Around 50: Represents balanced momentum.
• Below 30: Signals weak or potentially oversold momentum.
The biggest trap traders fall into is relying on RSI by itself. An extreme reading is never a guaranteed reversal trigger. For reliable confirmation, you must always pair RSI with price structure, market trend, and volume. 🧭
Treat RSI as a single piece of evidence rather than a standalone decision-maker. 🎯
How often do you combine indicators with overall market structure before entering a trade?
#CryptoTrading #RSI #TechnicalAnalysis #BinanceSquare