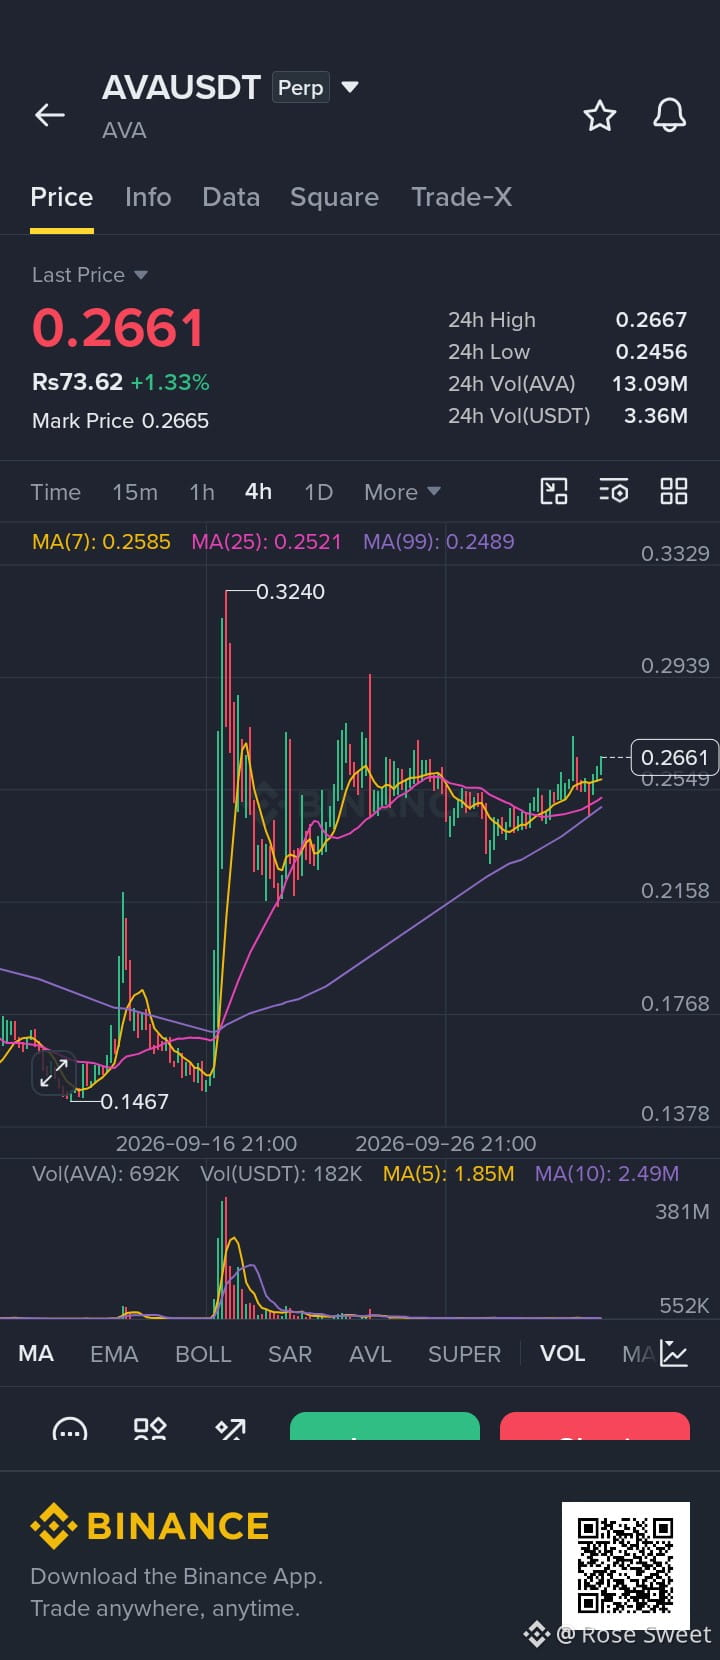
The AVA/USDT 4-hour chart displays a bullish continuation pattern. After a sharp vertical rally to 0.3240 and subsequent retracement, the price successfully found a floor and built a strong upward trendline resting on long-term support (\text{MA}(99)). With the current price (0.2661) sitting above all key short- and long-term moving averages, the chart suggests steady buyer control, aiming to test higher overhead resistance levels near 0.2939 and 0.3240.
$AVA
$AVAX
$ZEC
#CerebrasSinksNearly20%OnReportNvidiaToPowerOpenAI #SECApproves3xLongCryptoCommodityETPs
$AVA
$AVAX
$ZEC
#CerebrasSinksNearly20%OnReportNvidiaToPowerOpenAI #SECApproves3xLongCryptoCommodityETPs