#ACTUSDT 1D
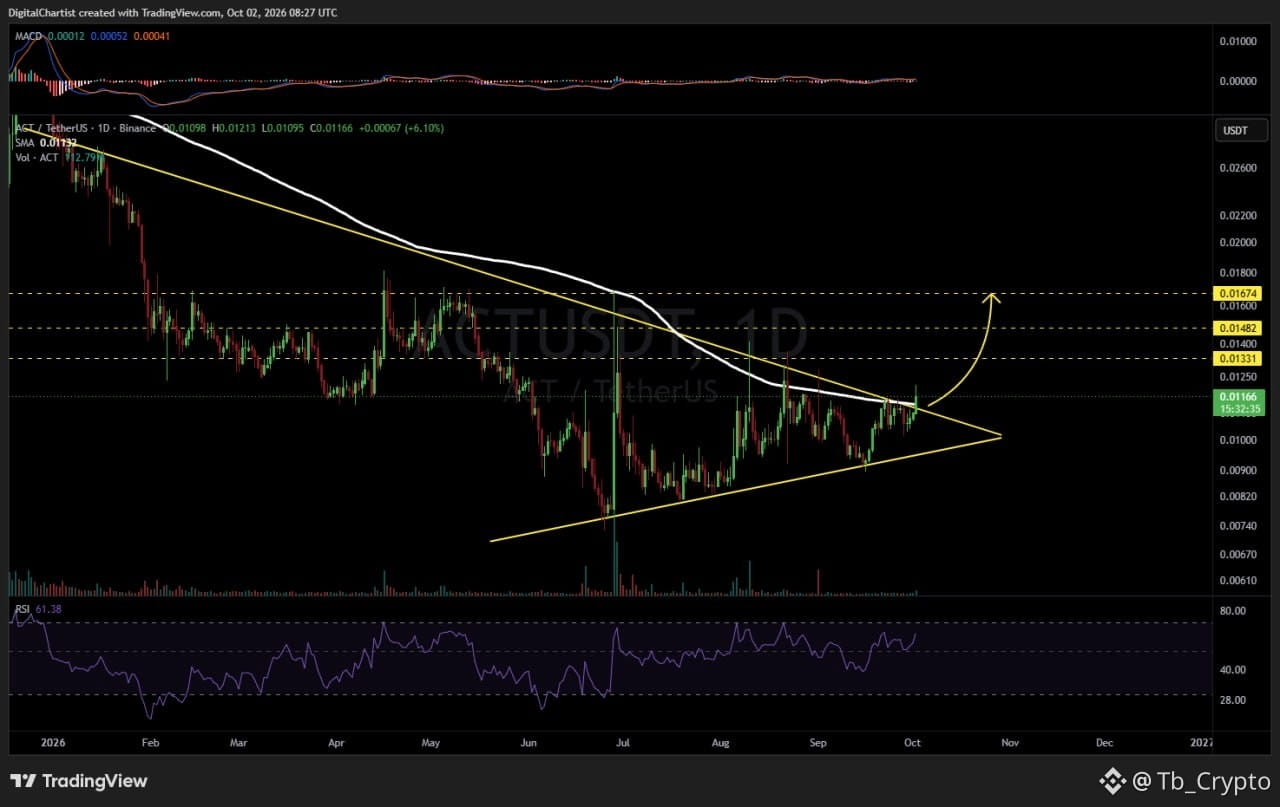
#ACT has broken above the descending resistance and the SMA200 on the daily chart. The potential upside targets are:
🎯 $0.01331
🎯 $0.01482
🎯 $0.01674
$ACT
#ACT has broken above the descending resistance and the SMA200 on the daily chart. The potential upside targets are:
🎯 $0.01331
🎯 $0.01482
🎯 $0.01674
$ACT