
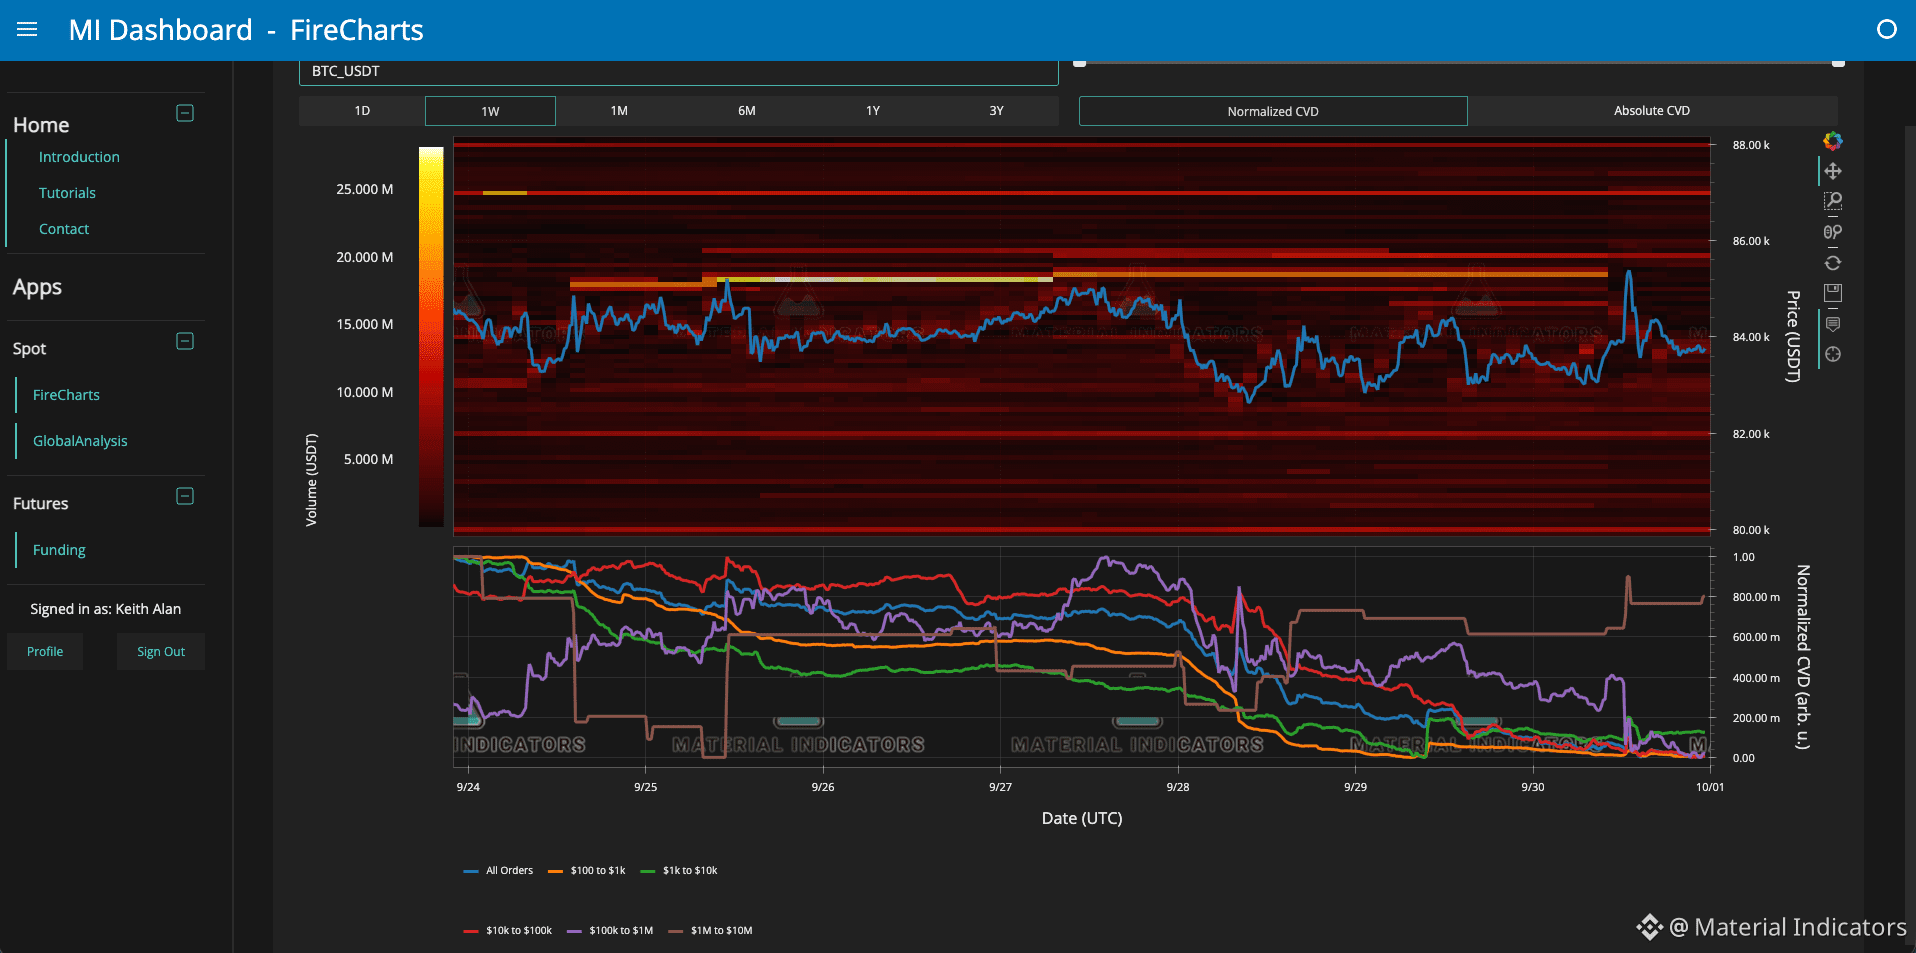
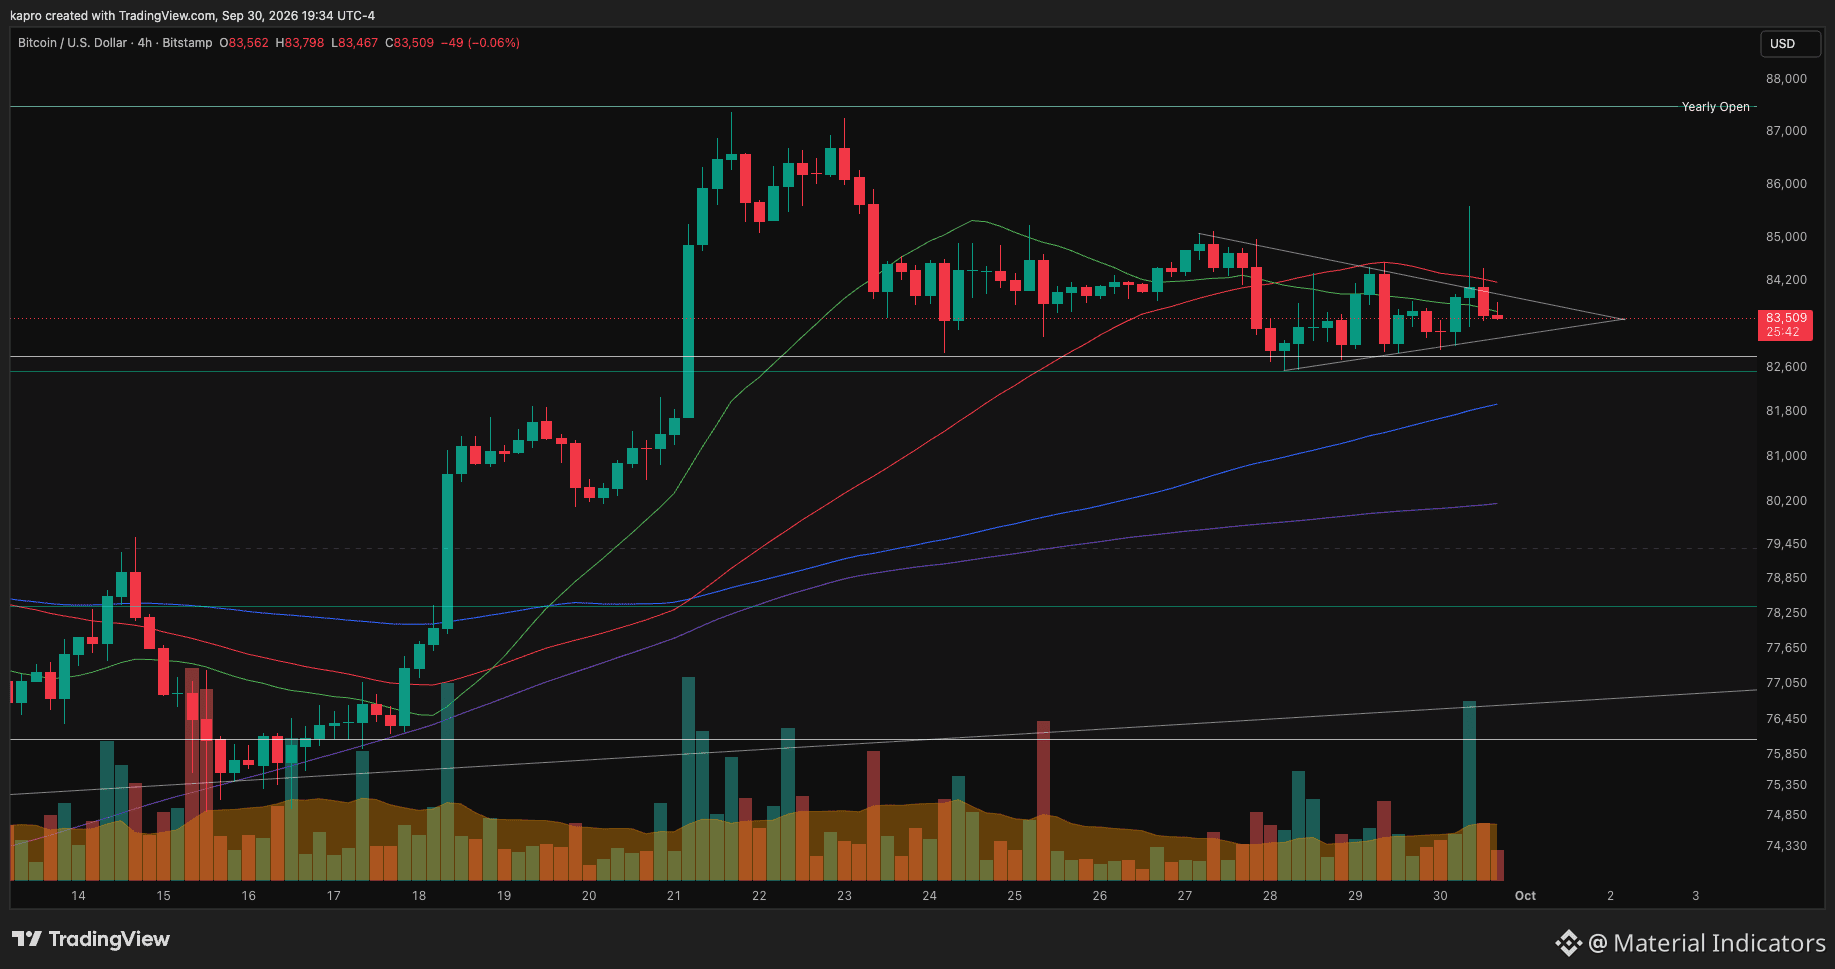
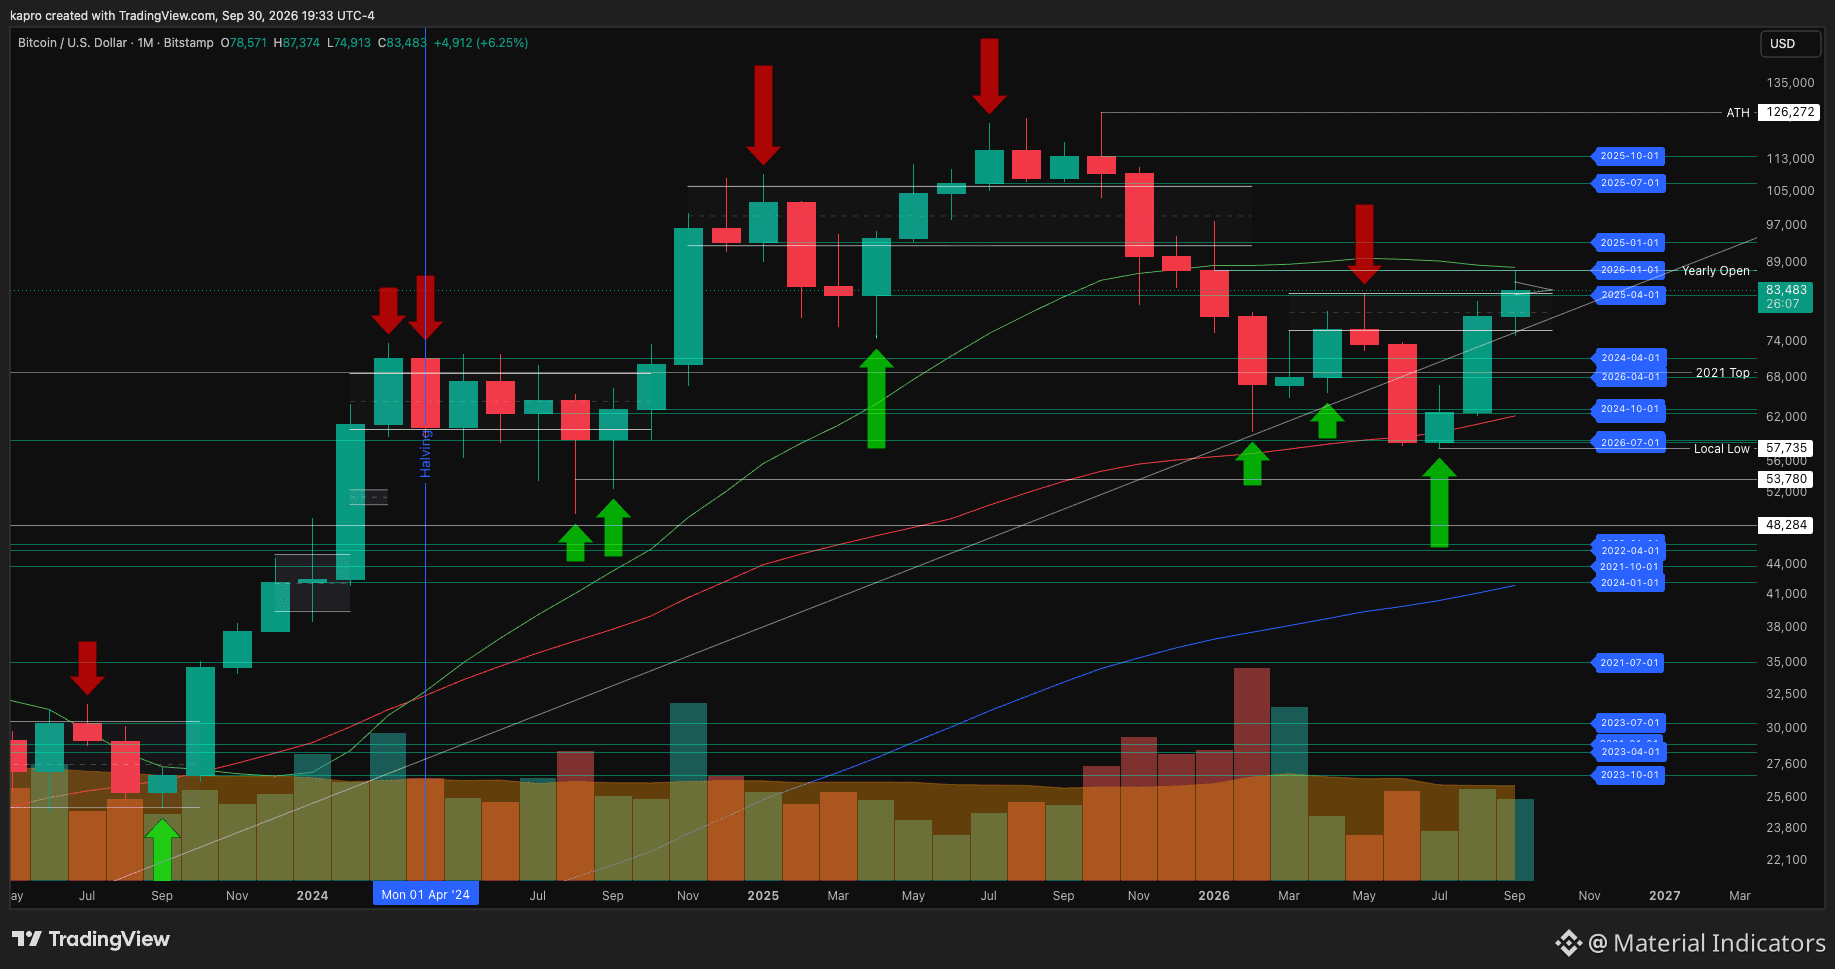
We’ve got less than an hour before the Daily, Monthly, Quarterly close and $BTC is hovering almost exactly in the middle of a LTF decision zone. Weekly, Monthly and Quarterly charts look extremely bullish. In fact the higher the TF, the more bullish, however LTF charts raise the probability of another support test. A close above the 21 SMA on the 4-hour TF ($83,635) increases the probability of breakout out of the LTF structure to challenge the Yearly Open again. A close below it increases the odds of breaking down to test support at $82.5k again. If it happens, watch to see if price makes a HL or LL on the support test. Of course we’re also watching Trend Precognition for signals and insights across the higher timeframes, as well as how price develops relative to the pending new Timescape Levels coming tonight, and Monday. In the order book, ask liquidity was thinned out significantly during the morning pump so it won’t take much to break above $85.2k if the sentiment is there, but purple whales sold aggressively this morning and that trend hasn’t reversed yet. Buckle up - the rest of the week is going to be exciting. #BTCCharts# #BTC Price Analysis#


Đăng
Tuyên bố miễn trừ trách nhiệm: Nội dung bao gồm cả quan điểm của bên thứ ba, không phải lời khuyên. Có thể sử dụng nội dung do Binance Ai đưa ra nhưng không được đảm bảo. Xem Điều khoản & Điều kiện.