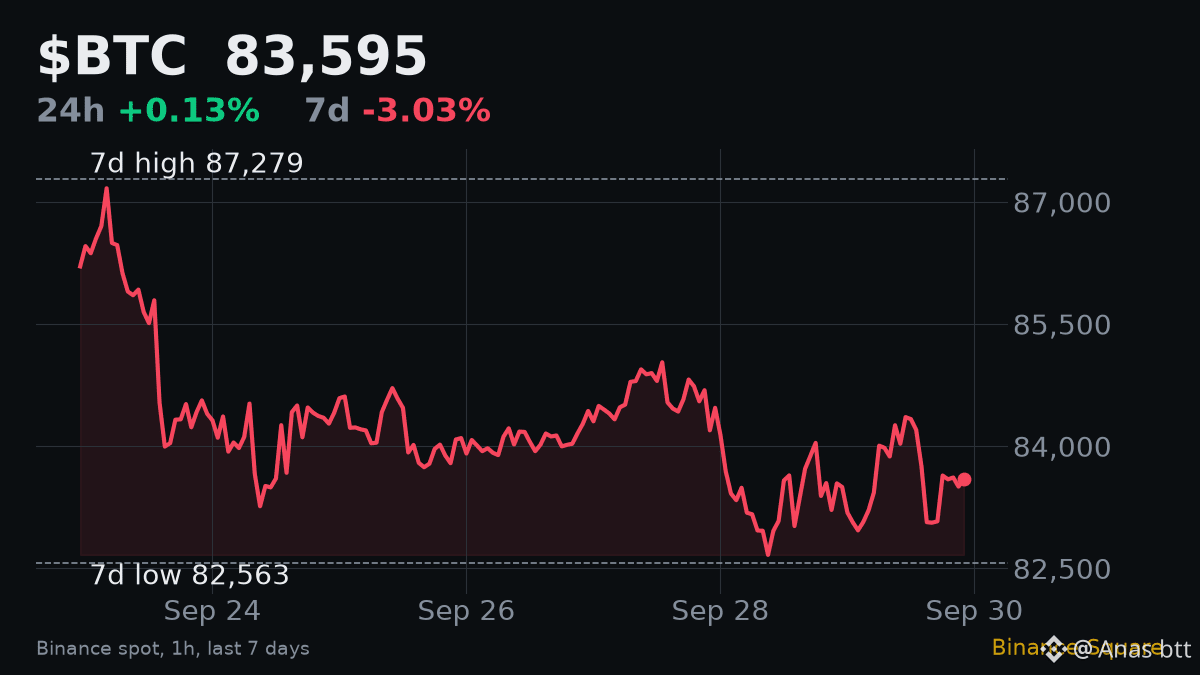
Hourly RSI on $BTC reads 49.7 right now. Most people would call that "nothing". It is actually a useful reading, if you know what RSI can and cannot tell you.
What it is: RSI compares the size of recent up moves with recent down moves and puts the result on a 0 to 100 scale. Above 70 is called overbought, below 30 oversold. Around 50, buyers and sellers are roughly balanced.
Trap 1: treating 70 as a sell signal. In a strong trend RSI can stay above 70 for a long time while price keeps climbing. High RSI means strong momentum, not a top.
Trap 2: ignoring the timeframe. The 49.7 here is on 1-hour candles. It describes roughly the last 14 hours, not the bigger picture.
Trap 3: reading RSI alone. Look at the context. BTC is at 83,595, down 3.0% on the week and 4.2% under its 7-day high of 87,279. After that drop, an hourly RSI near 50 tells me the selling pressure has faded. It does not tell me buyers have taken over. Volume at 0.81 times its weekly average agrees: nobody is pushing hard either way.
Practical takeaway: use RSI to measure how strong a move is, then confirm with price levels and volume before acting. Here, a break of the 87,279 high or the 82,563 low on rising volume would matter far more than any RSI number.
#RSI #TechnicalAnalysis
What it is: RSI compares the size of recent up moves with recent down moves and puts the result on a 0 to 100 scale. Above 70 is called overbought, below 30 oversold. Around 50, buyers and sellers are roughly balanced.
Trap 1: treating 70 as a sell signal. In a strong trend RSI can stay above 70 for a long time while price keeps climbing. High RSI means strong momentum, not a top.
Trap 2: ignoring the timeframe. The 49.7 here is on 1-hour candles. It describes roughly the last 14 hours, not the bigger picture.
Trap 3: reading RSI alone. Look at the context. BTC is at 83,595, down 3.0% on the week and 4.2% under its 7-day high of 87,279. After that drop, an hourly RSI near 50 tells me the selling pressure has faded. It does not tell me buyers have taken over. Volume at 0.81 times its weekly average agrees: nobody is pushing hard either way.
Practical takeaway: use RSI to measure how strong a move is, then confirm with price levels and volume before acting. Here, a break of the 87,279 high or the 82,563 low on rising volume would matter far more than any RSI number.
#RSI #TechnicalAnalysis