



Pump.fun stock closed Monday at $9.30, down roughly 3.0% from the prior close of $9.59. The 4.9% open-to-close decline confirms sellers controlled the session from the start, pushing the stock deeper into a textbook downtrend structure.
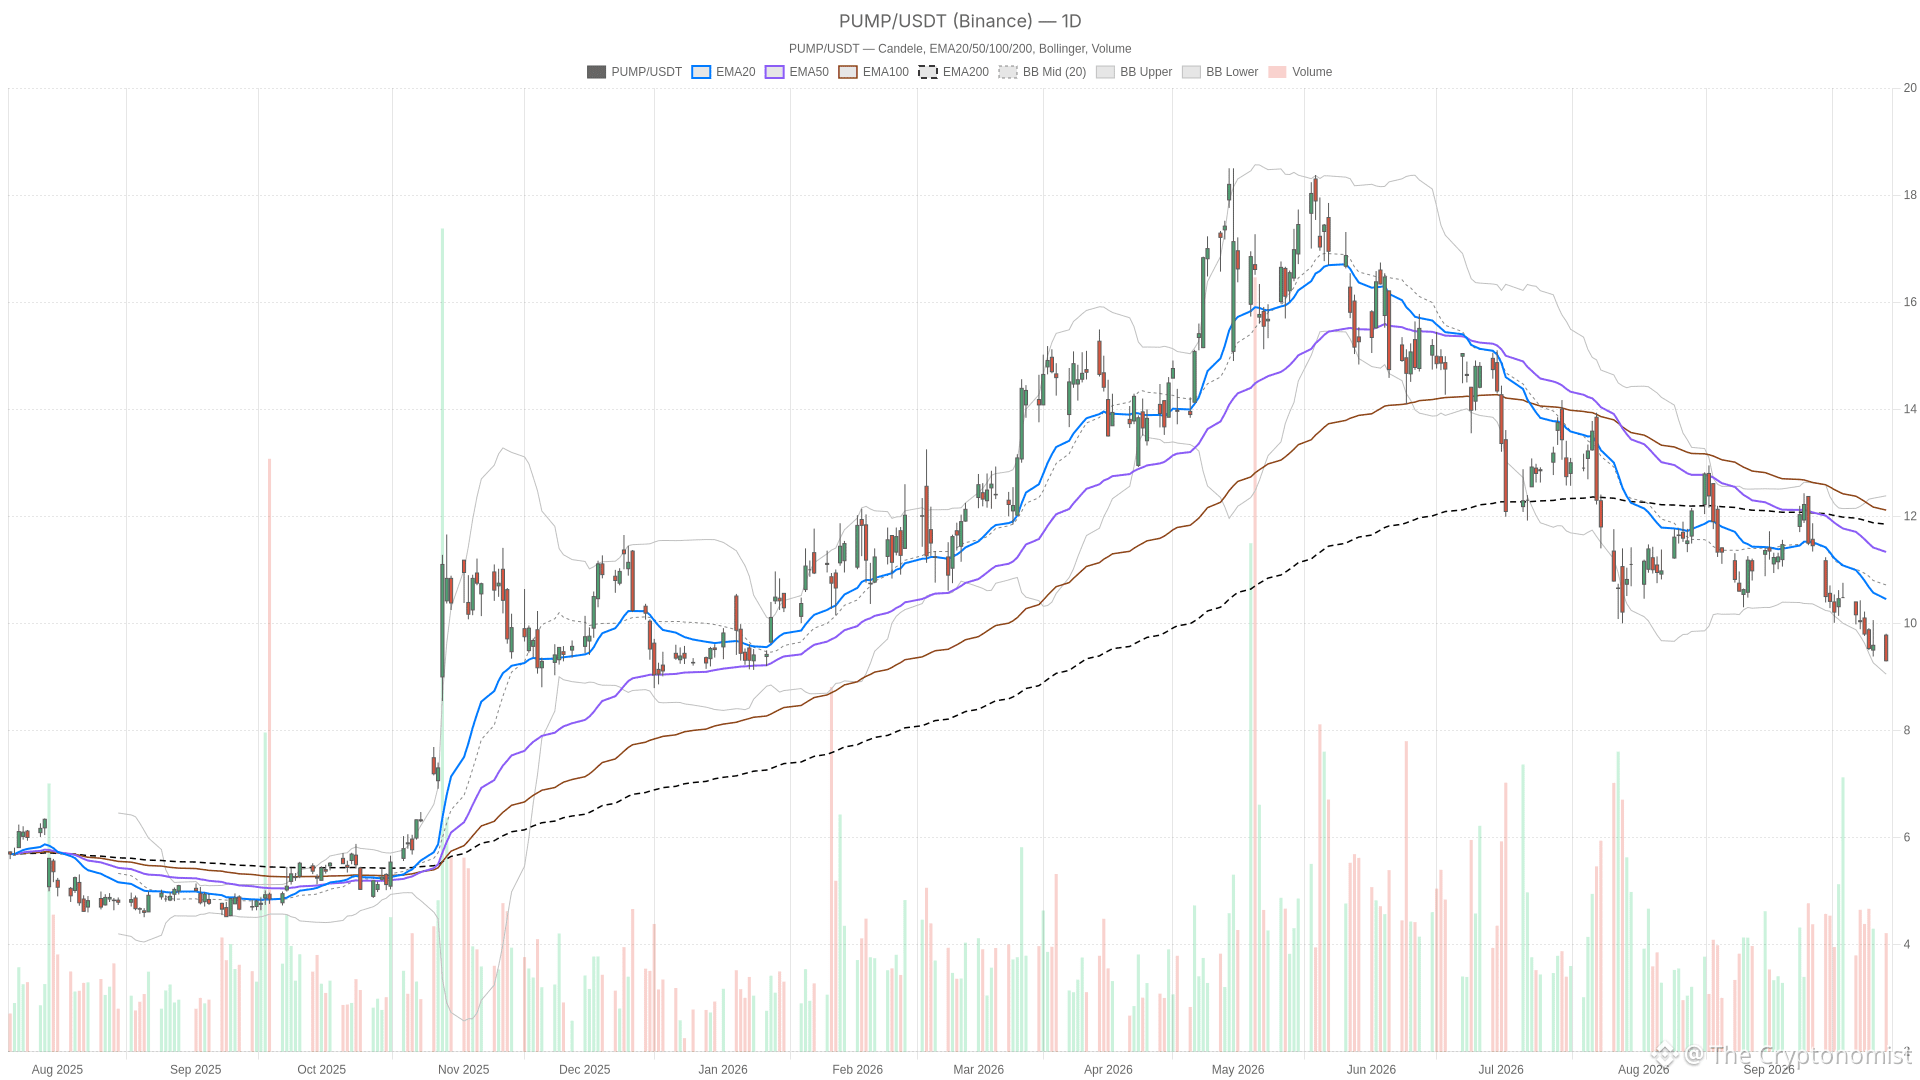 PUMP — daily chart with candlesticks, EMA20/EMA50 and volume.
Key takeaways
Pump.fun stock fell 3.0% to $9.30 on Monday, with an open-to-close loss of 4.9%.
Price trades below all three major daily moving averages — EMA20 at $10.45, EMA50 at $11.33, and EMA200 at $11.85.
Daily RSI14 sits at 30.04, right at the oversold boundary, while MACD remains firmly negative at -0.54.
The hourly chart mirrors the daily downtrend, with RSI14 deeper into oversold at 28.38.
Daily support sits at $9.12; a breakdown below this level would likely accelerate selling toward $9.05.
Daily Structure Confirms a Deepening Downtrend
Pump.fun stock remains locked in a well-defined downtrend on the daily chart, with every major moving average bearishly stacked above price. Price now trades well below the EMA20 at $10.45, the EMA50 at $11.33, and the EMA200 at $11.85. Shorter averages sitting beneath longer ones form a textbook bearish alignment. There is no ambiguity in the moving average setup.
RSI14 on the daily timeframe reads 30.04, sitting right at the edge of oversold territory. That level often precedes a bounce. However, given the strength of the prevailing trend, this reading should be treated as a symptom of the sell-off rather than a standalone reversal signal.
MACD reinforces that reading. The line sits at -0.54 against a signal of -0.41, producing a histogram of -0.13. Momentum remains negative and the spread between line and signal has not meaningfully narrowed. In other words, sellers still have the upper hand on this timeframe.
Bollinger Bands add another layer of context. The mid-band sits at $10.72, the upper band at $12.38, and the lower band at $9.05. Monday’s close at $9.30 places price very close to the lower band. This signals that volatility has expanded to the downside. ATR14 stands at $0.56, confirming the stock is moving with real conviction rather than drifting.
Pivot Levels Frame the Immediate Battlefield
The daily pivot point sits at $9.47, with resistance at $9.64 and support at $9.12. Price closing below the pivot at $9.30 keeps the daily bias tilted toward sellers. A break of $9.12 would open the door to further downside continuation.
Hourly Chart Aligns With the Bearish Picture
The hourly timeframe fully confirms the bearish bias seen on the daily chart, with price pinned below identical moving average resistance. EMA20 at $9.59, EMA50 at $9.90, and EMA200 at $10.62 are all stacked above the current price of $9.30. Therefore, the intraday trend is aligned with the higher timeframe, which strengthens conviction in the bearish read.
RSI14 on the 1H sits at 28.38, deeper into oversold than the daily reading. MACD on this timeframe shows the line at -0.16 against a signal of -0.15, with a histogram of just -0.01. That near-flat histogram suggests momentum is decelerating, even if it has not yet turned positive.
Meanwhile, the 1H Bollinger Bands show price closing at $9.30, just under the lower band of $9.33. The mid-band sits at $9.57. This tells a story of a market stretched to the downside on an intraday basis. ATR14 at $0.18 confirms compressed but persistent volatility.
Hourly pivots are tight: pivot point at $9.32, resistance at $9.35, and support at $9.28. Pump.fun stock is essentially pinned between pivot and support. This reflects indecision at this exact moment even as the broader trend remains down.
15-Minute Chart Offers Tactical Nuance
On the 15m timeframe, the EMA structure again shows EMA20 at $9.43, EMA50 at $9.53, and EMA200 at $9.95. All three sit above the last close of $9.30. RSI14 reads 32.84, marginally higher than the 1H figure, hinting at very short-term stabilization attempts.
MACD histogram sits at -0.01, essentially flat. The 15m Bollinger lower band at $9.29 sits almost exactly at the current price. This is a market coiling near support on the smallest timeframe. Pivot support at $9.28 acts as the immediate line in the sand for intraday traders watching Pump.fun stock closely.
What the Bullish Scenario Requires
For a bullish reversal to gain traction, Pump.fun stock would first need to reclaim the daily pivot at $9.47. It must then hold above that level convincingly. A push through $9.64 resistance would be the next confirmation step. Ideally, this would be accompanied by RSI14 climbing back above 40 on the daily chart and MACD histogram narrowing further toward zero.
On the hourly chart, a sustained close above the EMA20 at $9.59 would be an early signal that intraday sellers are losing control. Until those conditions are met, however, any upside move should be treated as a potential relief bounce within a larger downtrend rather than a trend reversal.
Bearish Case: Pump.fun Stock Faces the Path of Least Resistance
The bearish scenario simply requires continuation — not a reversal — to remain intact, making it the path of least resistance for Pump.fun stock. A break below the daily support at $9.12 would invalidate any near-term stabilization attempt. This would likely accelerate selling toward the lower Bollinger band region near $9.05.
On the hourly chart, a decisive close below $9.28 support would confirm that intraday buyers are unable to defend even the tightest levels. Given that EMA20, EMA50, and EMA200 are bearishly aligned across all three timeframes, the bearish scenario needs only persistence to stay valid.
Notably, there is no meaningful conflict between the daily and hourly timeframes. Both confirm the same downtrend. The 1H simply shows a more compressed and oversold market in the short term. The 15m chart adds only tactical nuance, suggesting a pause near support rather than a change in direction.
Overall, oversold RSI readings on both the daily and hourly charts leave room for a technical bounce. Still, the broader structure argues against a durable reversal without a break above key pivot resistance. Positioning around current levels should account for the asymmetry between short-term relief potential and the dominant bearish trend.
FAQ
Is Pump.fun stock oversold enough for a bounce?
The daily RSI14 stands at 30.04, right at the oversold threshold, while the hourly RSI14 reads 28.38. These oversold conditions can precede a technical bounce. However, in strong downtrends, RSI can remain near oversold levels for extended periods without triggering a meaningful reversal.
What is the key support level for Pump.fun stock?
Daily pivot support sits at $9.12, with the daily Bollinger lower band at $9.05. A break below $9.12 would likely accelerate selling. On the hourly chart, immediate support is at $9.28, with price currently pinned just above that level.
What would signal a trend reversal for Pump.fun stock?
A sustained reclaim of the daily pivot at $9.47, followed by a push through $9.64 resistance, would be the first confirmation steps. RSI14 would need to climb back above 40 on the daily, and price would need to close above the hourly EMA20 at $9.59 to show intraday sellers are losing control.
Disclaimer: This article is for informational purposes only and does not constitute financial advice, an investment recommendation, or a solicitation to buy or sell any financial instrument or cryptocurrency. The analysis provided is not indicative of future results. Investing in crypto assets and financial markets carries a high risk of capital loss. Always do your own research (DYOR) and consult a qualified financial advisor before making any decision.
Article produced with the assistance of artificial intelligence and reviewed by the editorial team.