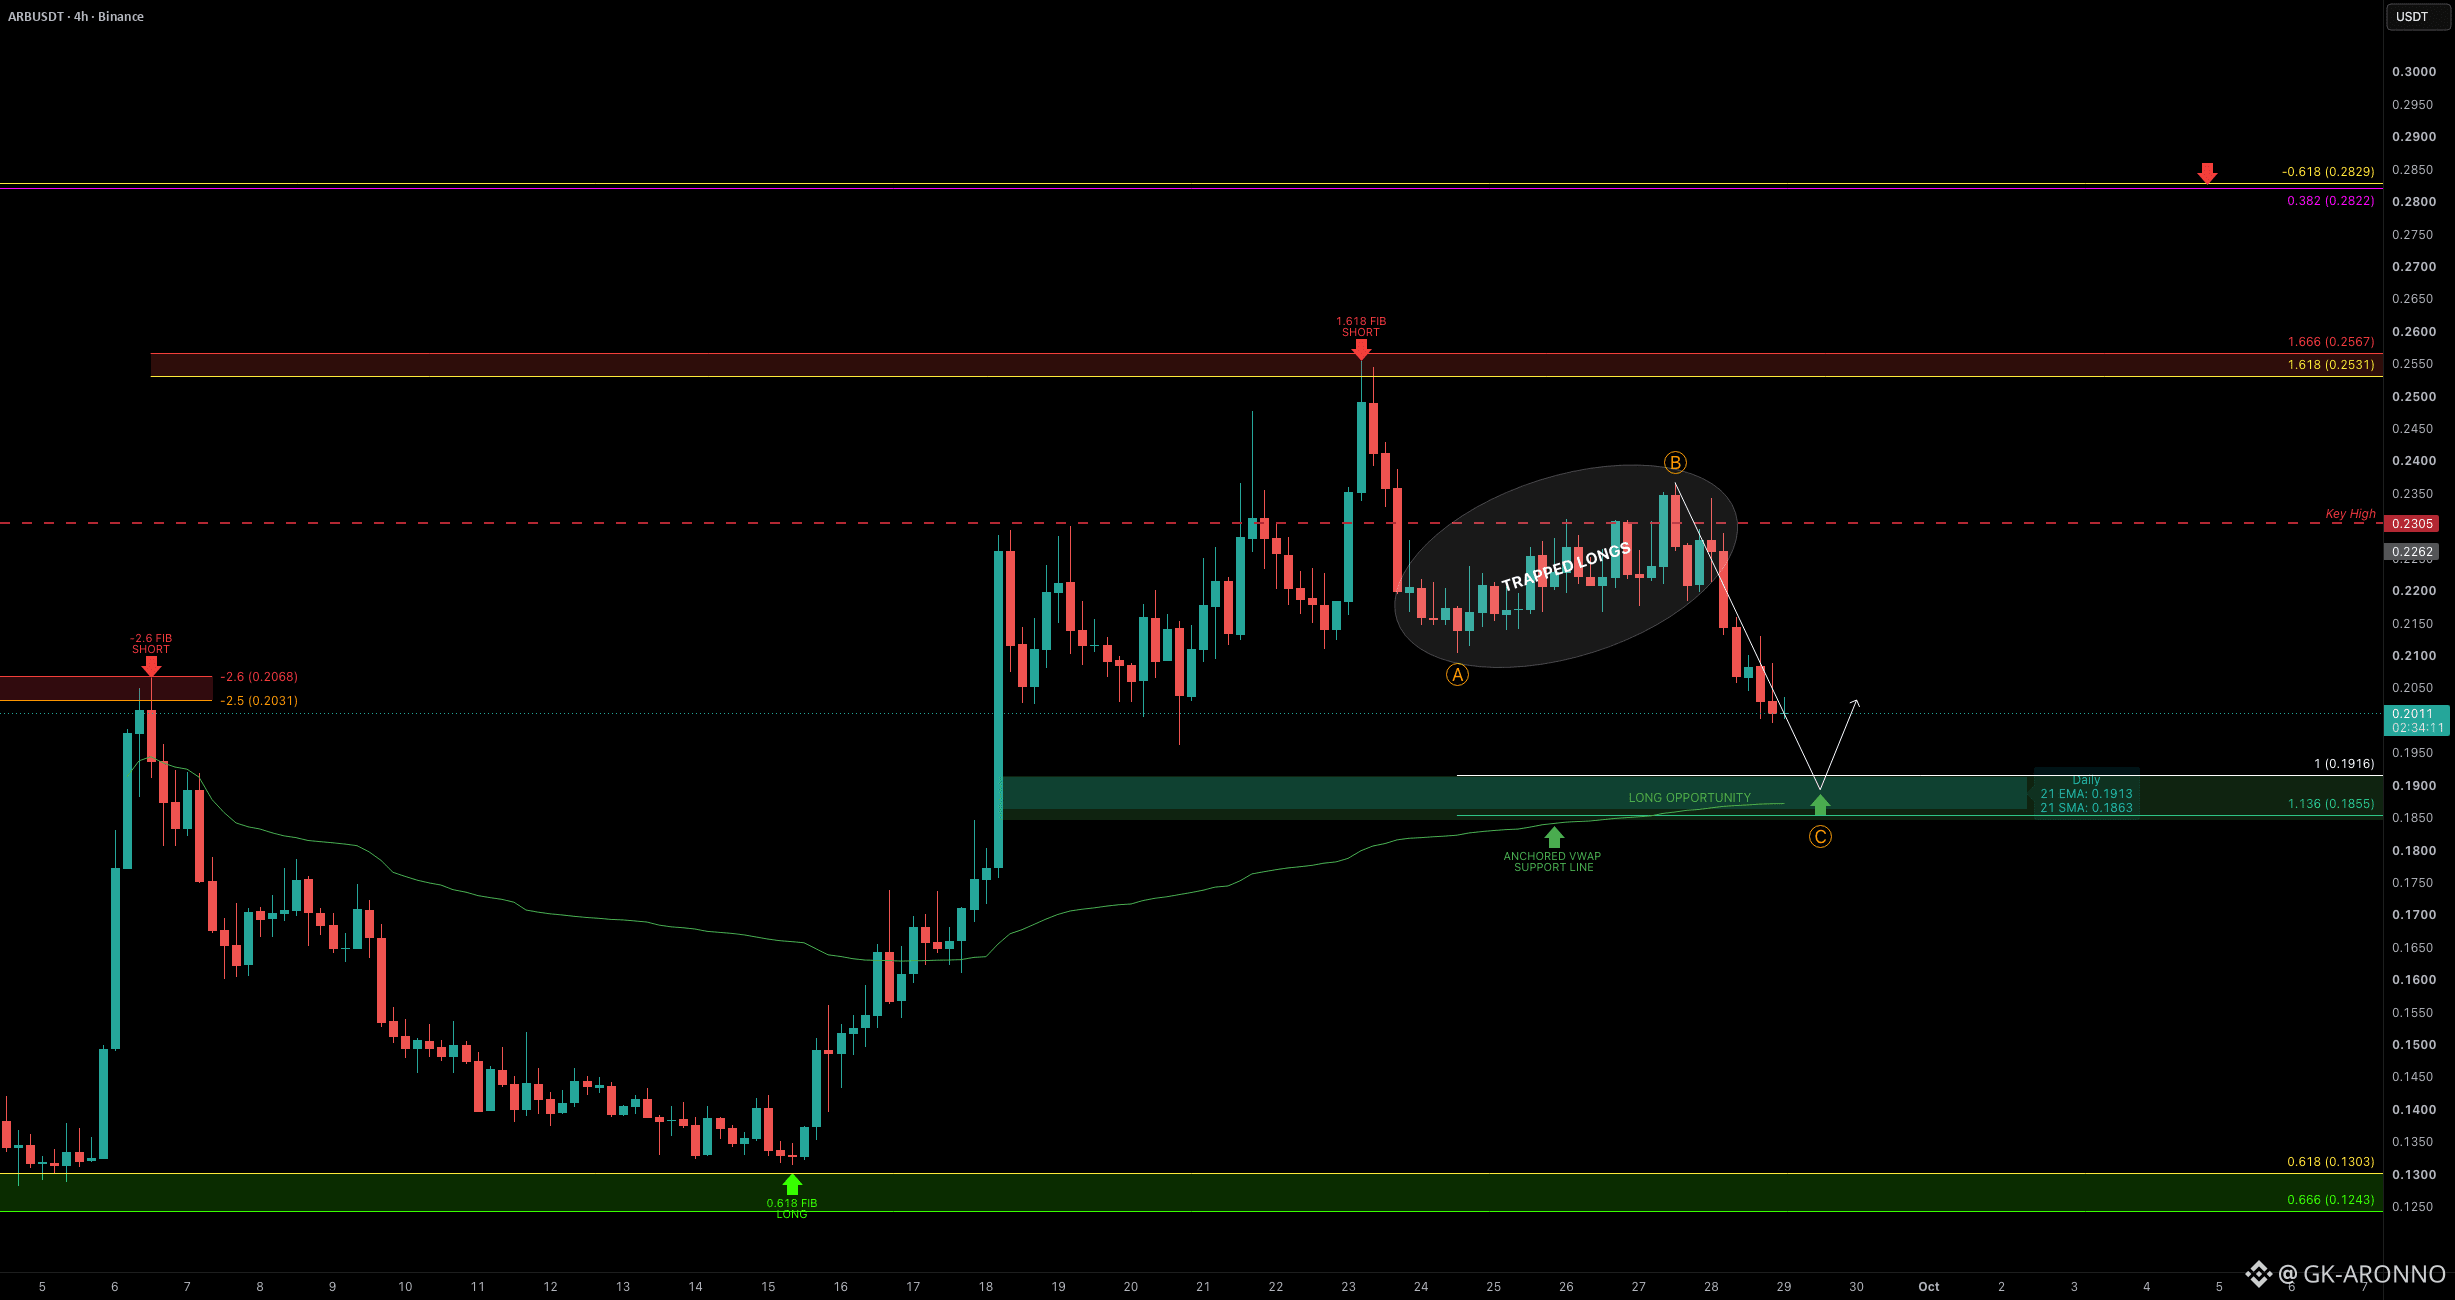

ARB has been trading very precise technically.
After hitting the 1.618 Fib extension at $0.25, we got a solid TP on the long and at the same time a nice short.
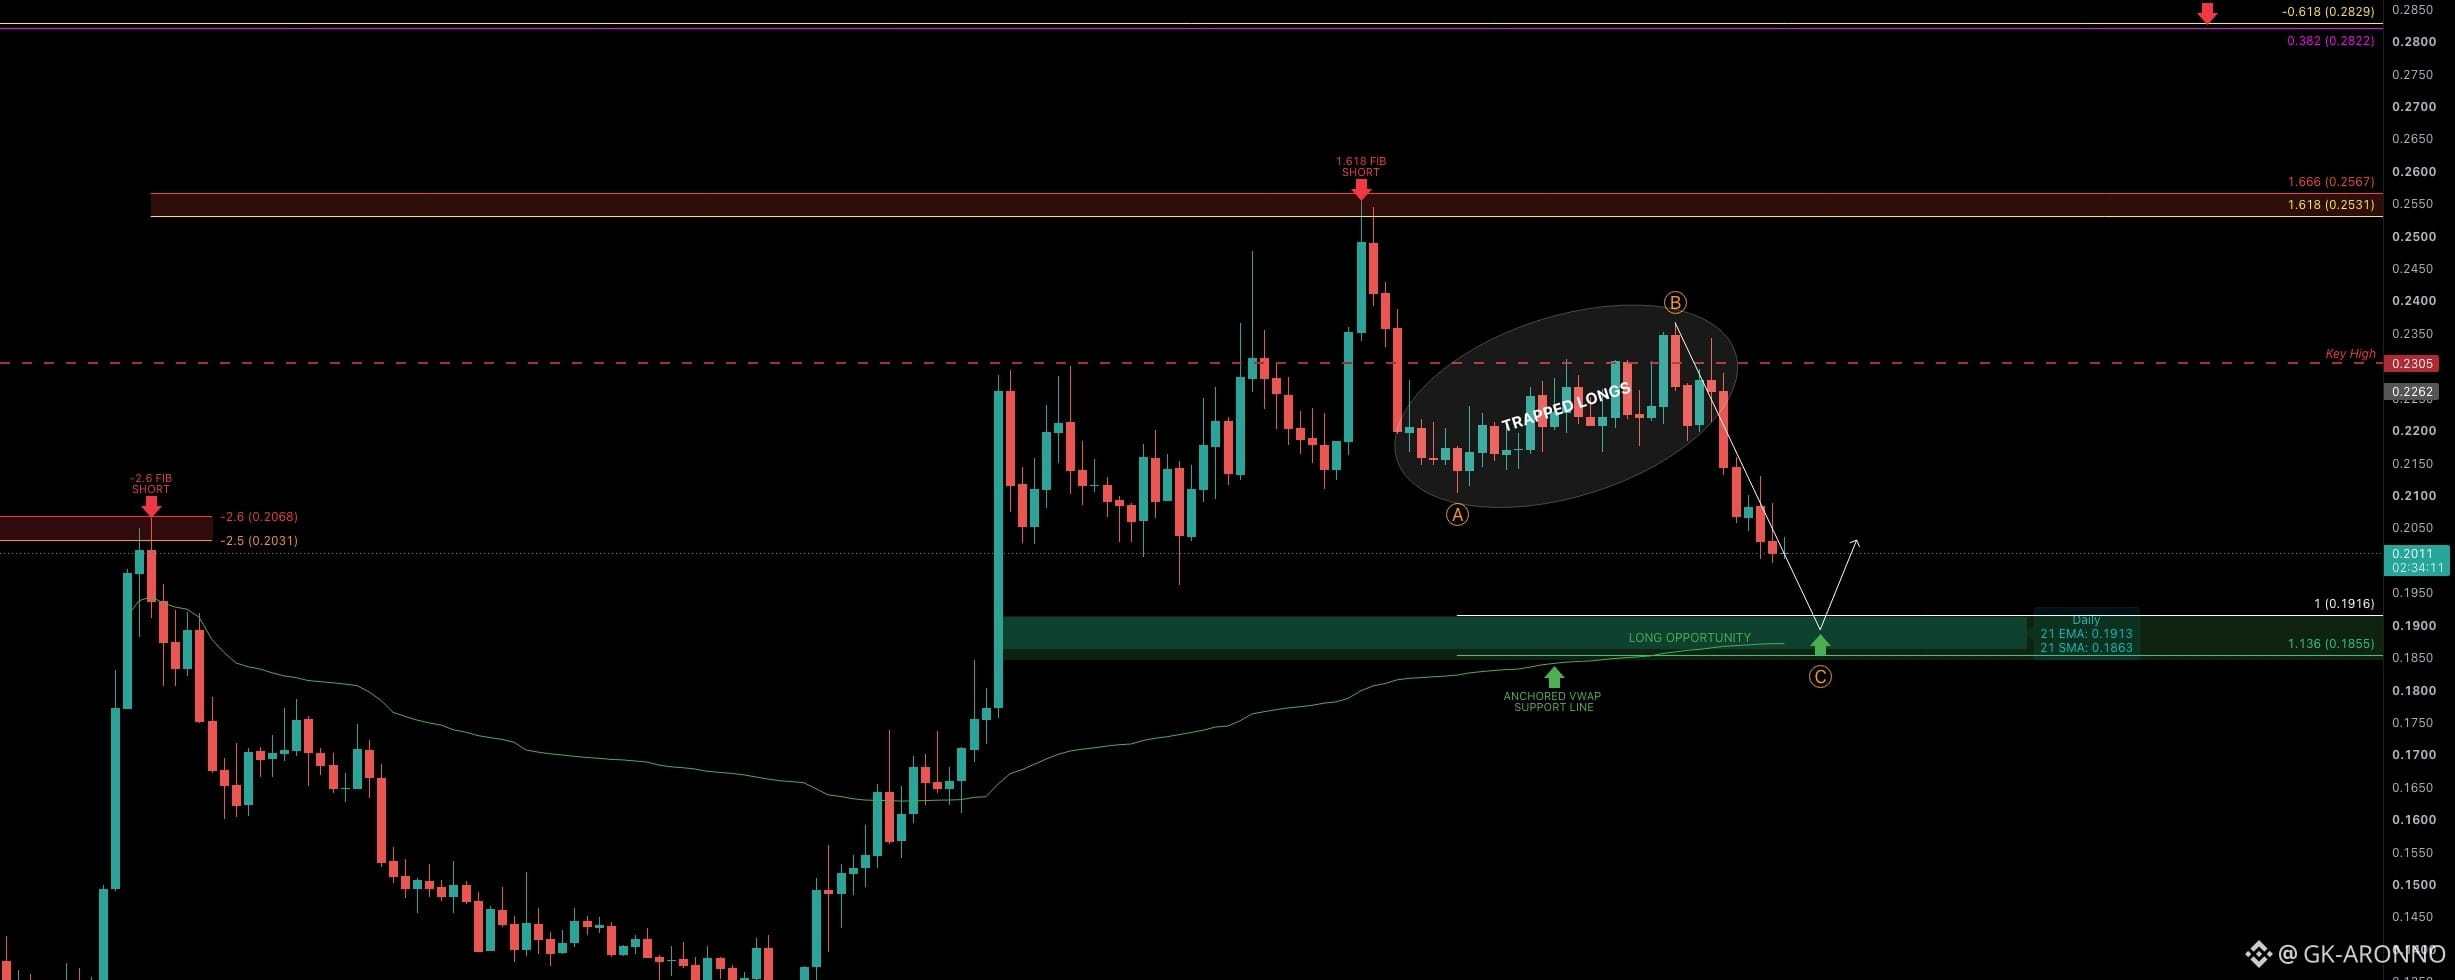
From there we saw the sharp drop forming our Wave A, followed by around 4 days of sideways price action over the weekend, marking our Wave B.
That weekend consolidation trapped a lot of longs, and we are now working on Wave C, taking those trapped longs out.
I’d like to see the $0.1962 swing low taken out first.
Below that, the $0.1916–$0.1855 area is the sweet spot I’m watching for the next long and the completion of Wave C.
This zone also lines up nicely with the 21 Daily EMA/SMA and anchored VWAP, adding another layer of confluence to the setup.
If we get the reaction I’m looking for from that zone, this could turn into a nice swing long, with $0.28 as the next major target.
🔍 Indicators used
Multi Timeframe 8x MA Support Resistance Zones [SiDec] → to identify support and resistance zones such as the Daily 21 EMA/SMA.
➡️ Available for free. You can find it on my profile under “Scripts” and apply it directly to your charts for extra confluence when planning your trades.
_________________________________
💬 If you found this helpful, drop a like and comment!