🚀$BTC BULL RUN IS NEAR? — MY 1H ANALYSIS
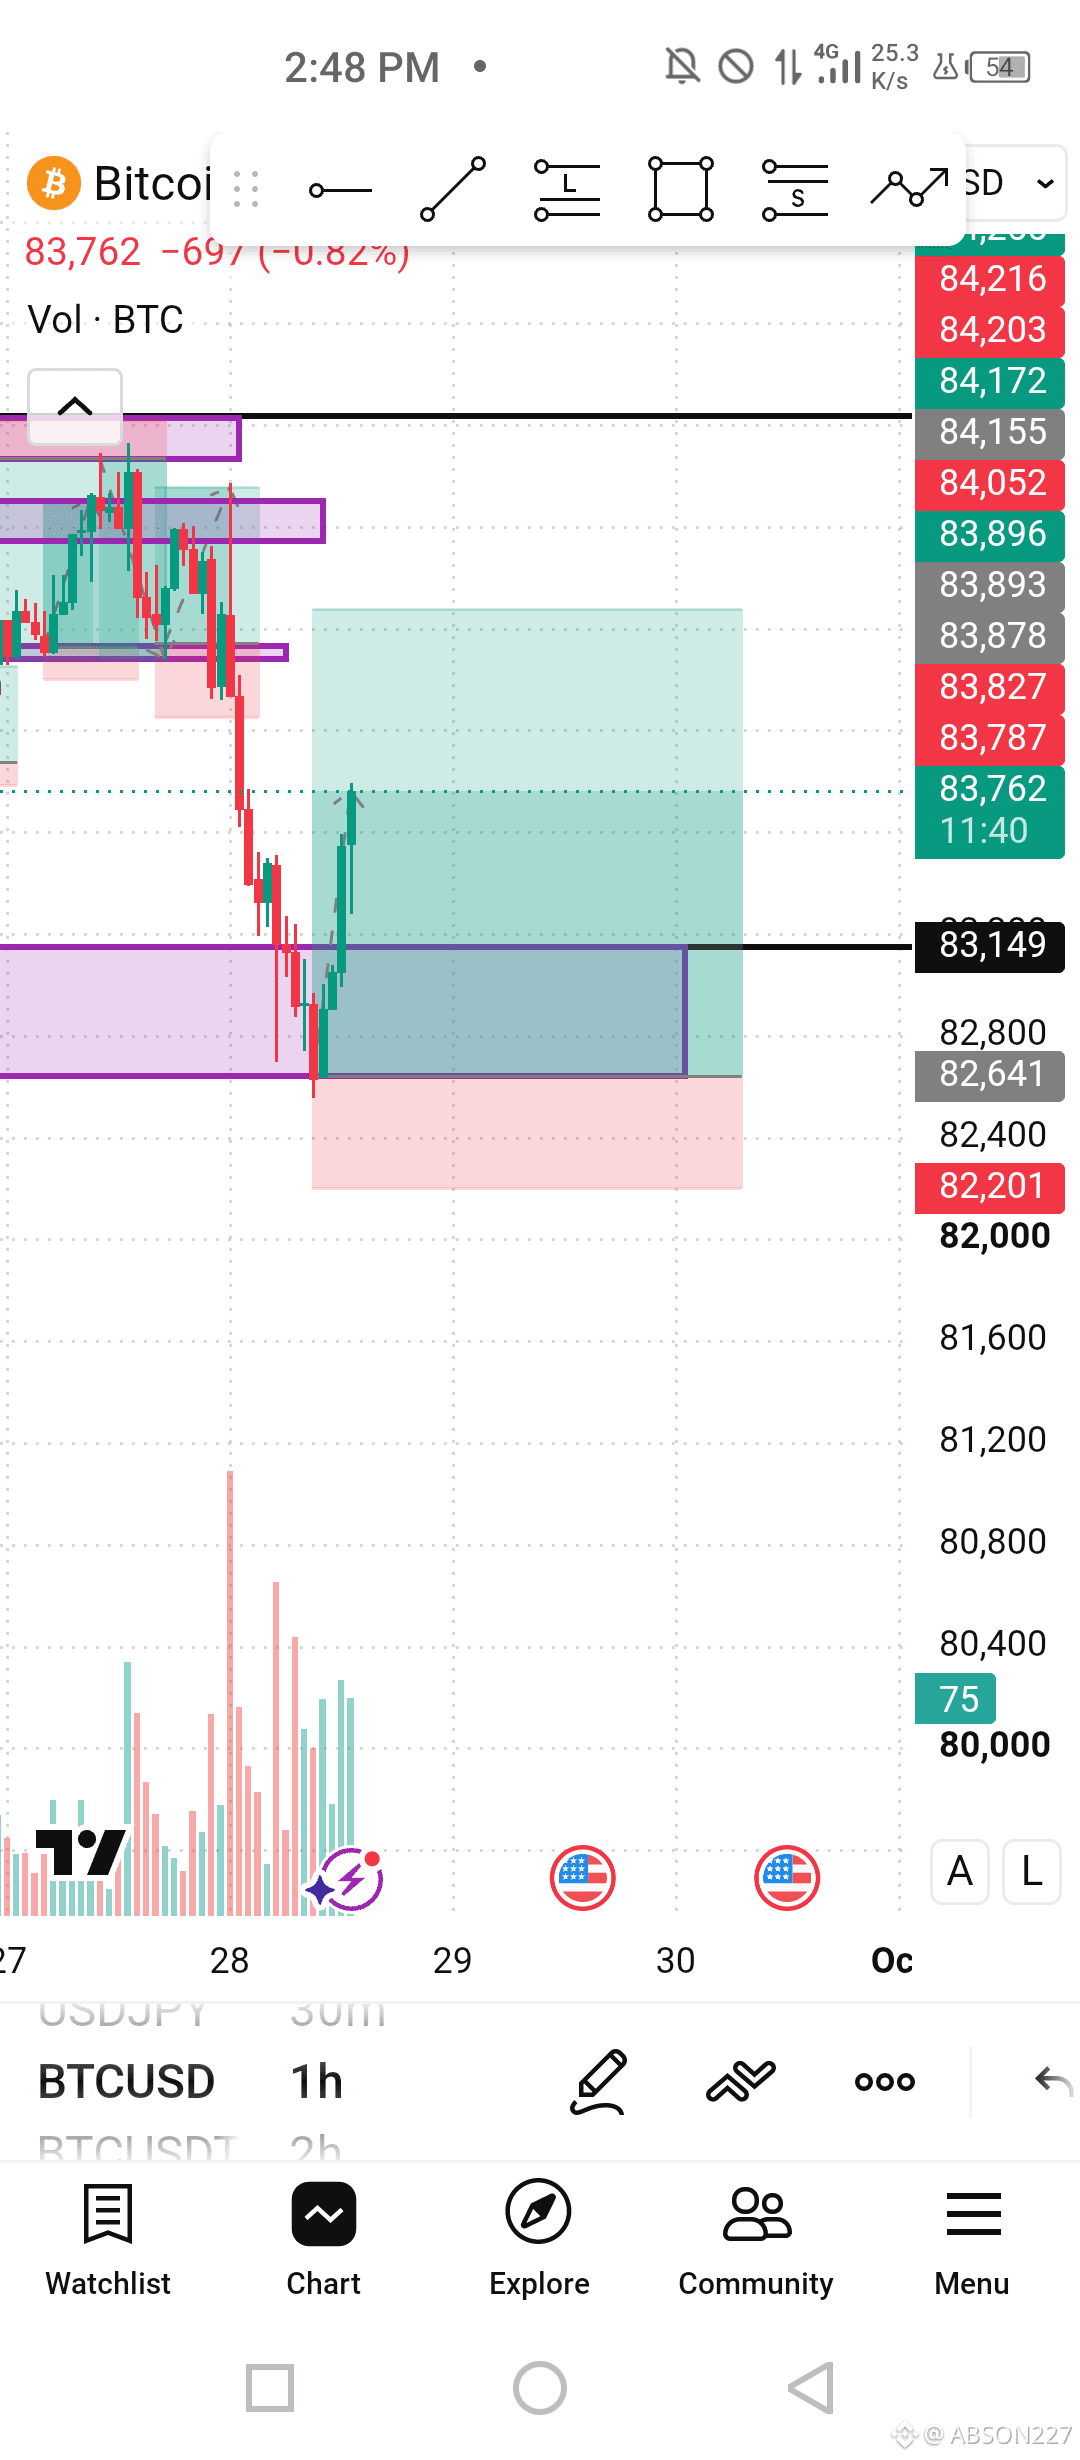
$BTC is currently around $83.76K on the 1-hour chart, and this setup is interesting because BTC has just reacted strongly from the $82.64K–$82.80K support zone.
📊 What I'm watching
🟢 Support: $82.64K–$82.80K
This is the zone where buyers stepped in and price bounced strongly.
🟡 First resistance: around $83.15K
BTC has already moved back above this level.
🔴 Major resistance: $83.88K–$84.05K
This is the next important area. A strong move through this zone could show that buyers are gaining more control.
🔴 Higher resistance: $84.15K and above
🐂 Why this matters for the $100K story
This chart alone doesn't confirm a bull run, but the bigger picture has some interesting bullish factors. U.S. spot Bitcoin ETFs attracted about $2.4 billion in net inflows during the week ending September 25, their strongest weekly inflow since October 2025. �
The Block
So I'm watching whether BTC can continue making higher highs and higher lows while reclaiming the resistance zones above.
My idea: If buyers continue defending the $82.6K–$82.8K area and BTC successfully breaks through the nearby resistance levels, the path toward higher prices becomes more interesting. But rejection and a loss of support would weaken that bullish structure.
🎯 $100K remains the big psychological target everyone is watching — but price still has several levels to clear first.
What do you think? 🐂 $100K coming, or another rejection first?
$BTC #Bitcoin #BullRun #100K #Crypto #BinanceSquare #BTCAnalysis #BitcoinAnalysis
$BTC is currently around $83.76K on the 1-hour chart, and this setup is interesting because BTC has just reacted strongly from the $82.64K–$82.80K support zone.
📊 What I'm watching
🟢 Support: $82.64K–$82.80K
This is the zone where buyers stepped in and price bounced strongly.
🟡 First resistance: around $83.15K
BTC has already moved back above this level.
🔴 Major resistance: $83.88K–$84.05K
This is the next important area. A strong move through this zone could show that buyers are gaining more control.
🔴 Higher resistance: $84.15K and above
🐂 Why this matters for the $100K story
This chart alone doesn't confirm a bull run, but the bigger picture has some interesting bullish factors. U.S. spot Bitcoin ETFs attracted about $2.4 billion in net inflows during the week ending September 25, their strongest weekly inflow since October 2025. �
The Block
So I'm watching whether BTC can continue making higher highs and higher lows while reclaiming the resistance zones above.
My idea: If buyers continue defending the $82.6K–$82.8K area and BTC successfully breaks through the nearby resistance levels, the path toward higher prices becomes more interesting. But rejection and a loss of support would weaken that bullish structure.
🎯 $100K remains the big psychological target everyone is watching — but price still has several levels to clear first.
What do you think? 🐂 $100K coming, or another rejection first?
$BTC #Bitcoin #BullRun #100K #Crypto #BinanceSquare #BTCAnalysis #BitcoinAnalysis