📍 STONK SITS ON A MAJOR STRUCTURAL TEST
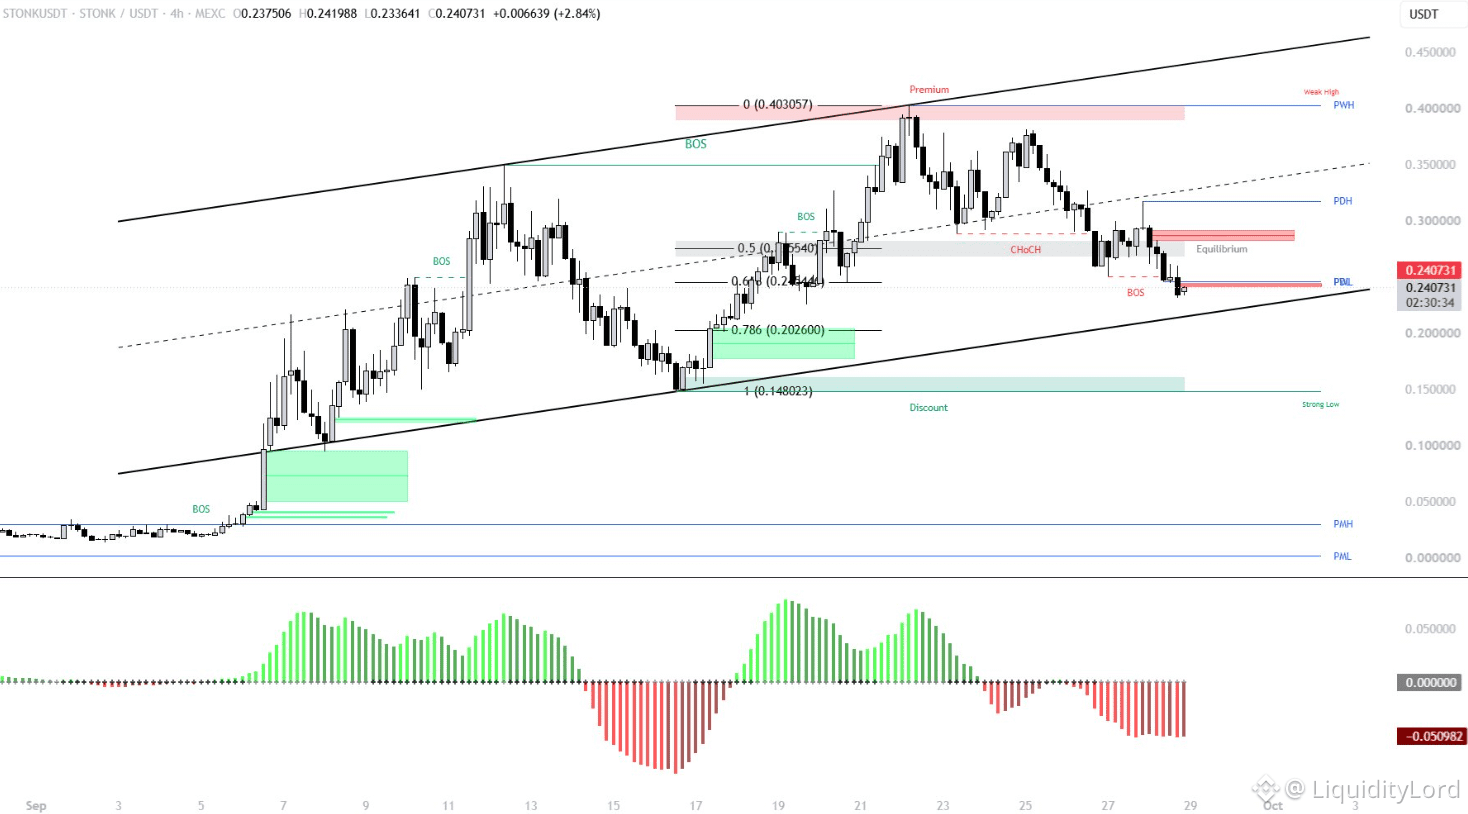
STONK is trading near 0.241 on the 4h chart after a sequence of lower highs from the 0.40 area. The latest decline has pushed price toward the lower boundary of the rising channel and the previous-day low region.
🧭 THE MARKET IS AT THE EDGE
The broader chart remains inside a rising channel, but momentum has weakened. BOS markers appeared during the decline, while the histogram moved deeper into negative territory. That makes the reaction around 0.24 important.
A hold near channel support could produce a relief rotation. A decisive break below it would expose the 0.20 area.
🎯 THE LEVEL LADDER
Reaction zone: 0.235–0.245
Risk boundary: 0.220
TR1: 0.270
TR2: 0.300
TR3: 0.318
If buyers reclaim 0.27, the next resistance comes around 0.30, followed by the marked 0.318 PDH level. A stronger expansion could later challenge 0.35.
📊 STRUCTURE CHECK
The 0.40 premium area marked the recent major high, but price has since produced lower highs. The 0.235–0.245 area combines the current price region with the lower channel boundary and nearby horizontal structure.
If buyers defend it, the market can attempt to rebuild above 0.27. If sellers close below the zone, the 0.2026 Fibonacci level becomes the next reference.
⚙ EXECUTION FIT
Fast rotations around structural levels can create differences between displayed price and available liquidity. ST0Nfi can fit into that execution layer by comparing liquidity routes before an order is sent, while the chart remains the directional thesis.
For STONK, the sequence is simple: defend 0.235–0.245, reclaim 0.27, then test 0.30 and 0.318. Failure at the base shifts attention toward 0.20.
NFA - DYOR
🔎 WHAT COMES NEXT
The key signal is the reaction at channel support. Reclaiming 0.27 would repair the short-term structure, while closes below 0.235 would keep sellers in control from here.
STONK is trading near 0.241 on the 4h chart after a sequence of lower highs from the 0.40 area. The latest decline has pushed price toward the lower boundary of the rising channel and the previous-day low region.
🧭 THE MARKET IS AT THE EDGE
The broader chart remains inside a rising channel, but momentum has weakened. BOS markers appeared during the decline, while the histogram moved deeper into negative territory. That makes the reaction around 0.24 important.
A hold near channel support could produce a relief rotation. A decisive break below it would expose the 0.20 area.
🎯 THE LEVEL LADDER
Reaction zone: 0.235–0.245
Risk boundary: 0.220
TR1: 0.270
TR2: 0.300
TR3: 0.318
If buyers reclaim 0.27, the next resistance comes around 0.30, followed by the marked 0.318 PDH level. A stronger expansion could later challenge 0.35.
📊 STRUCTURE CHECK
The 0.40 premium area marked the recent major high, but price has since produced lower highs. The 0.235–0.245 area combines the current price region with the lower channel boundary and nearby horizontal structure.
If buyers defend it, the market can attempt to rebuild above 0.27. If sellers close below the zone, the 0.2026 Fibonacci level becomes the next reference.
⚙ EXECUTION FIT
Fast rotations around structural levels can create differences between displayed price and available liquidity. ST0Nfi can fit into that execution layer by comparing liquidity routes before an order is sent, while the chart remains the directional thesis.
For STONK, the sequence is simple: defend 0.235–0.245, reclaim 0.27, then test 0.30 and 0.318. Failure at the base shifts attention toward 0.20.
NFA - DYOR
🔎 WHAT COMES NEXT
The key signal is the reaction at channel support. Reclaiming 0.27 would repair the short-term structure, while closes below 0.235 would keep sellers in control from here.