Bitcoin Is Sitting at a Critical Decision Zone
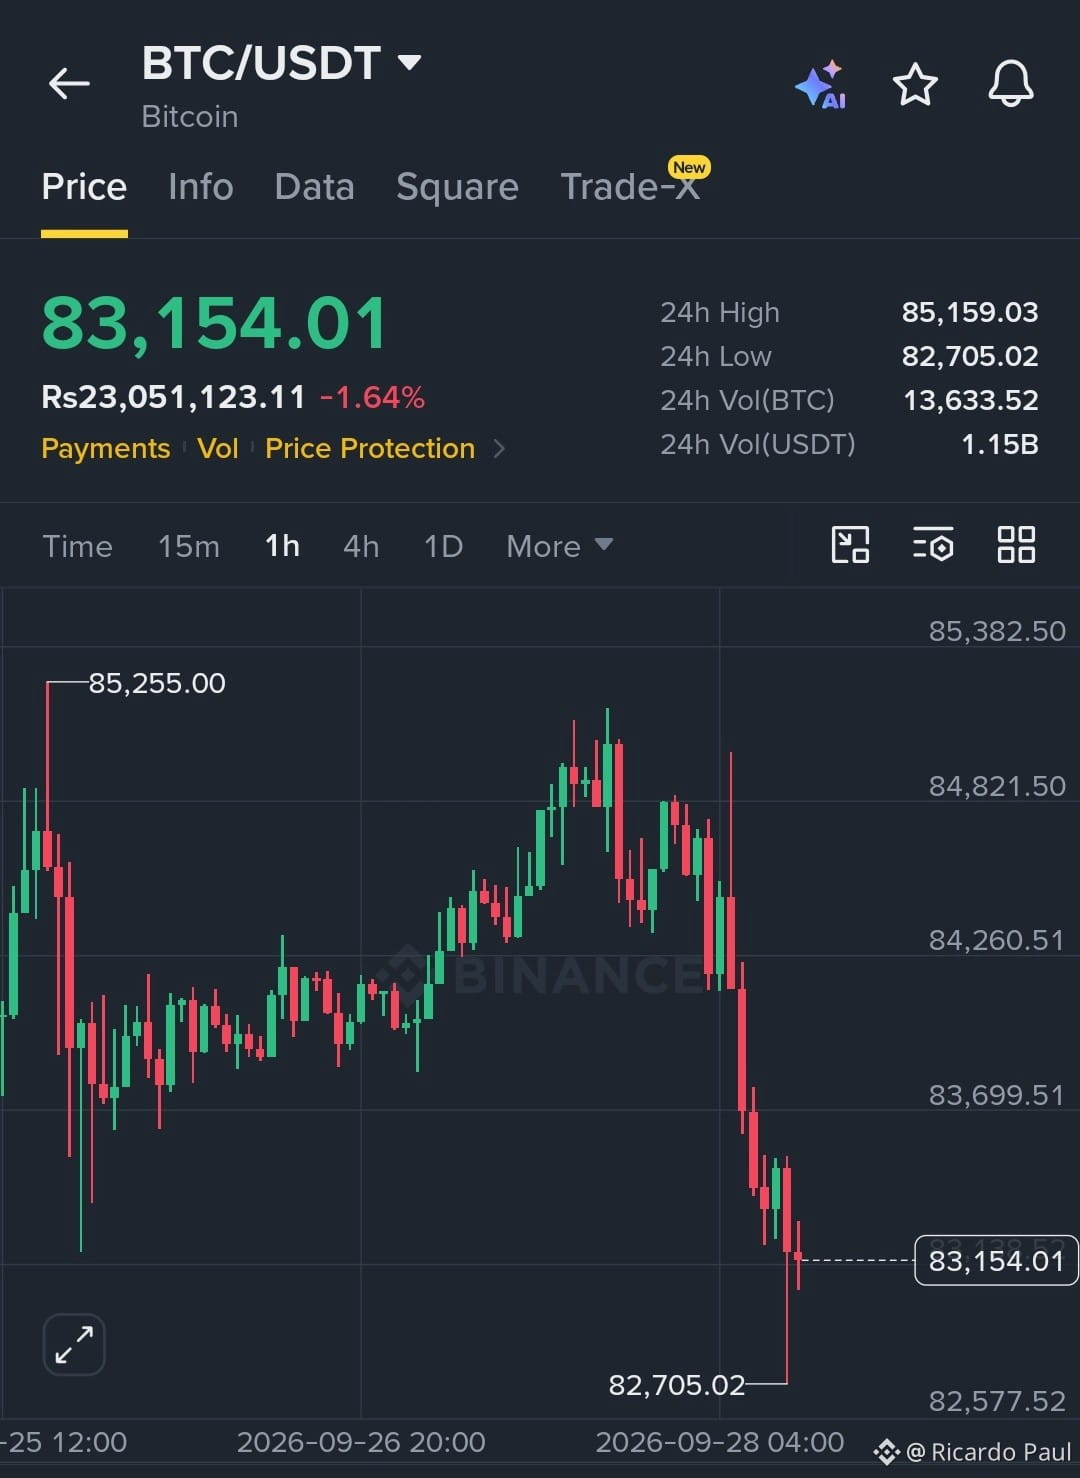
Bitcoin is trading around $83.1K, down roughly 1.6% on the session, after getting rejected from the $85K area. The 1H chart shows the shift clearly: BTC moved from higher highs into a series of lower highs, then lost the $84.26K support and accelerated lower.
The key move was the flush to $82,705.
That wick tells us buyers are still defending the low-$82K region, but the rebound so far isn't strong enough to confirm that sellers are finished.
For me, $82.7K is the immediate line in the sand.
If BTC holds that level and reclaims $83.7K, the sell-off could turn into a liquidity sweep rather than a full trend breakdown. A reclaim of $84.26K would strengthen that case, while $84.8K–$85.2K remains the bigger resistance zone where sellers have already shown up.
But if $82.7K breaks and price starts accepting below it, the picture changes quickly. The next areas I'd watch are roughly $82K and then $81K–$80K.
The interesting part is that price weakness isn't happening in isolation.
Recent U.S. spot Bitcoin ETF flows have shown strong institutional demand, while macro conditions — including elevated yields, a stronger dollar and higher oil prices — are creating pressure on risk assets. That leaves BTC caught between underlying demand and short-term momentum deterioration.
Volume is another thing I'd watch closely.
A bounce without meaningful volume can easily become another lower high. What I want to see is buyers reclaiming lost levels with follow-through, not just a quick green candle after a liquidation flush.
So the map is fairly simple:
$82.7K → immediate support
$83.7K → first recovery level
$84.26K → structure reclaim
$84.8K–$85.2K → major resistance
BTC doesn't need to explode higher from here to improve the chart.
It simply needs to stop making lower highs and start reclaiming the levels it just lost.
Until that happens, I’d treat this as a high-volatility decision zone, not assume that either the breakdown or the next rally is already confirmed.
$BTC
#btc
Bitcoin is trading around $83.1K, down roughly 1.6% on the session, after getting rejected from the $85K area. The 1H chart shows the shift clearly: BTC moved from higher highs into a series of lower highs, then lost the $84.26K support and accelerated lower.
The key move was the flush to $82,705.
That wick tells us buyers are still defending the low-$82K region, but the rebound so far isn't strong enough to confirm that sellers are finished.
For me, $82.7K is the immediate line in the sand.
If BTC holds that level and reclaims $83.7K, the sell-off could turn into a liquidity sweep rather than a full trend breakdown. A reclaim of $84.26K would strengthen that case, while $84.8K–$85.2K remains the bigger resistance zone where sellers have already shown up.
But if $82.7K breaks and price starts accepting below it, the picture changes quickly. The next areas I'd watch are roughly $82K and then $81K–$80K.
The interesting part is that price weakness isn't happening in isolation.
Recent U.S. spot Bitcoin ETF flows have shown strong institutional demand, while macro conditions — including elevated yields, a stronger dollar and higher oil prices — are creating pressure on risk assets. That leaves BTC caught between underlying demand and short-term momentum deterioration.
Volume is another thing I'd watch closely.
A bounce without meaningful volume can easily become another lower high. What I want to see is buyers reclaiming lost levels with follow-through, not just a quick green candle after a liquidation flush.
So the map is fairly simple:
$82.7K → immediate support
$83.7K → first recovery level
$84.26K → structure reclaim
$84.8K–$85.2K → major resistance
BTC doesn't need to explode higher from here to improve the chart.
It simply needs to stop making lower highs and start reclaiming the levels it just lost.
Until that happens, I’d treat this as a high-volatility decision zone, not assume that either the breakdown or the next rally is already confirmed.
$BTC
#btc