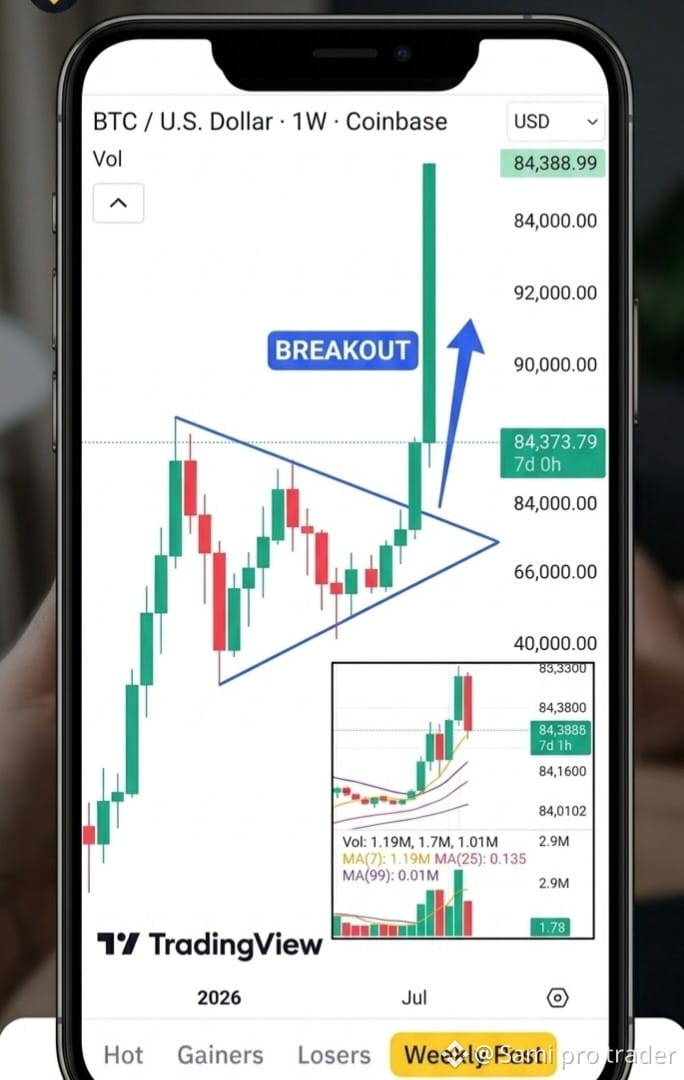
📊 $BTC Weekly Chart Analysis: Bullish Breakout in Play! 🚀
Bitcoin ($BTC ) is showing exceptional strength on the Weekly (1W) timeframe, currently trading around $84,370!
Key Technical Levels from the Chart:
Current Level: ~$84,373
Key Support Zone: $80,000 - $82,800
Major Resistance Ahead: $90,000 - $98,000
The weekly candle has cleanly broken out above the local swing resistance (~$82.8k). As long as $BTC closes and holds above the $80k mark on the weekly timeframe, the macro structure remains firmly bullish with eyes set on $90,000+ next!
What is your price target for $BTC by the end of this month? Drop it below! 👇
#Bitcoin #BTC #CryptoAnalysis #BinanceSquare #TechnicalAnalysis
Bitcoin ($BTC ) is showing exceptional strength on the Weekly (1W) timeframe, currently trading around $84,370!
Key Technical Levels from the Chart:
Current Level: ~$84,373
Key Support Zone: $80,000 - $82,800
Major Resistance Ahead: $90,000 - $98,000
The weekly candle has cleanly broken out above the local swing resistance (~$82.8k). As long as $BTC closes and holds above the $80k mark on the weekly timeframe, the macro structure remains firmly bullish with eyes set on $90,000+ next!
What is your price target for $BTC by the end of this month? Drop it below! 👇
#Bitcoin #BTC #CryptoAnalysis #BinanceSquare #TechnicalAnalysis