$BTC /USDT — 1H CHART ANALYSIS
📅 27 September 2026
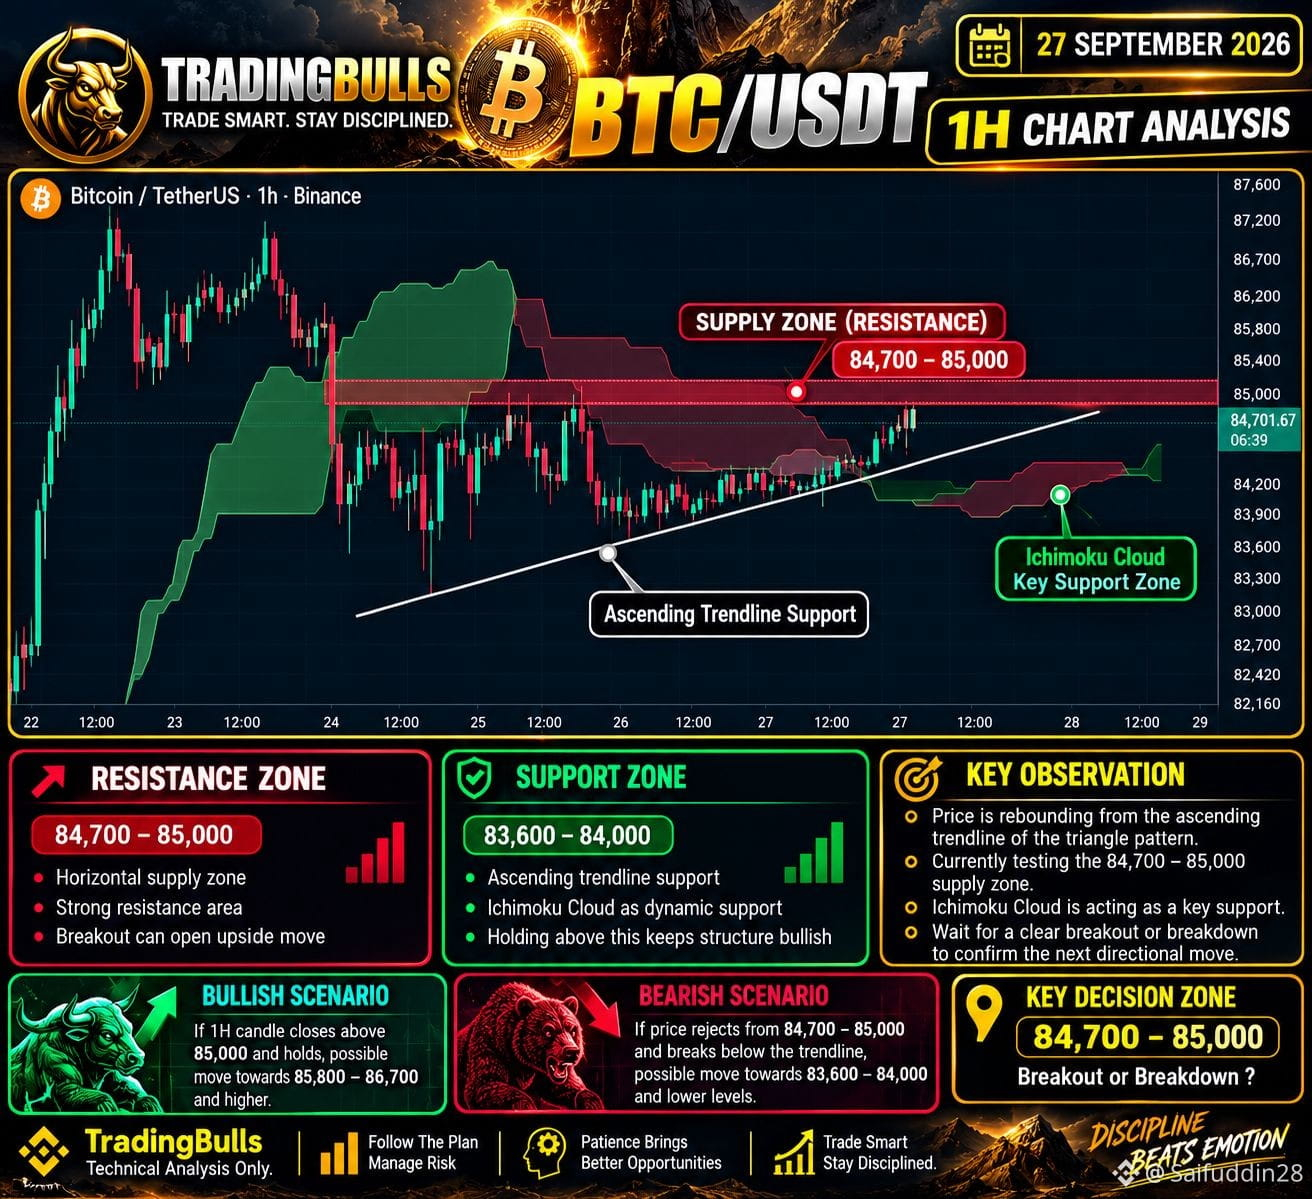
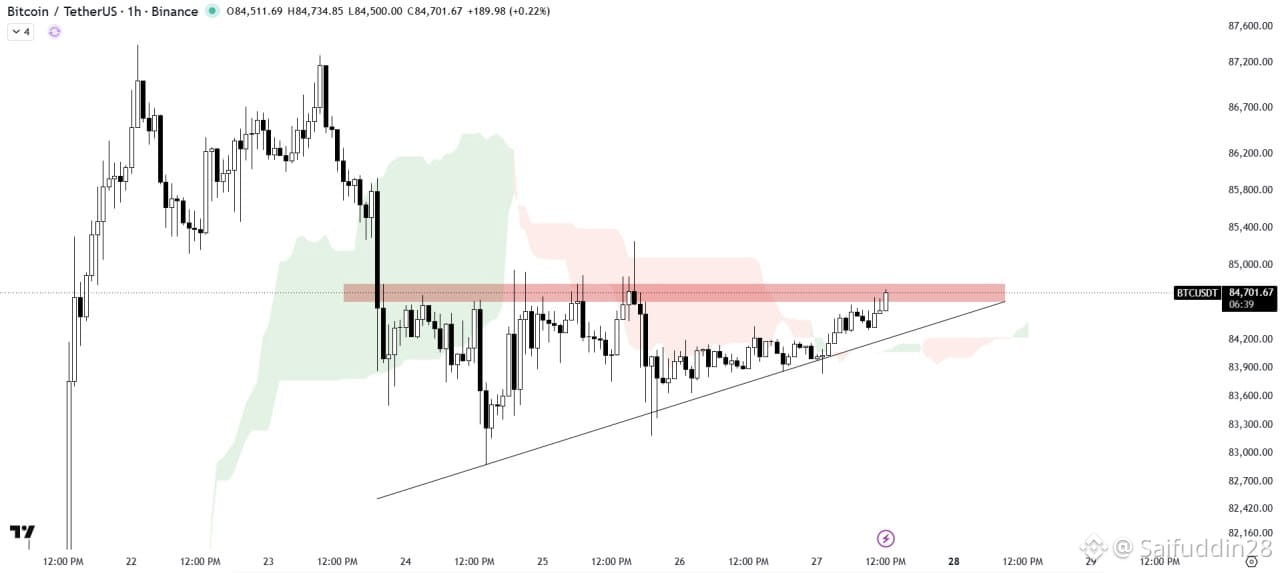
Bitcoin is rebounding from the ascending trendline support of an ascending-triangle structure and is now testing the $84,700–$85,000 supply/resistance zone.
The Ichimoku Cloud is currently acting as an important support area, while price continues to form higher lows along the rising trendline.
🔴 KEY RESISTANCE • $84,700–$85,000 — horizontal supply zone
• A confirmed breakout could open the way for a larger upside move.
🟢 KEY SUPPORT • Rising trendline support
• $83,600–$84,000 area
• Ichimoku Cloud as dynamic support
📈 BULLISH SCENARIO A strong 1H candle close above the supply zone, followed by a successful retest, could confirm an upside continuation.
📉 BEARISH SCENARIO Rejection from the supply zone + breakdown below the ascending trendline could invalidate the current triangle structure and increase downside pressure.
🎯 KEY DECISION: Breakout or Breakdown
Current BTC is around the mid-$84K area, broadly consistent with the chart's ~$84.7K reading.
⚠️ Wait for confirmation. Don't chase the breakout. Manage risk carefully.
🐂 TradingBulls | Technical Analysis Only
#BTCUSDT! #TradingBulls
$BTC
📅 27 September 2026
Bitcoin is rebounding from the ascending trendline support of an ascending-triangle structure and is now testing the $84,700–$85,000 supply/resistance zone.
The Ichimoku Cloud is currently acting as an important support area, while price continues to form higher lows along the rising trendline.
🔴 KEY RESISTANCE • $84,700–$85,000 — horizontal supply zone
• A confirmed breakout could open the way for a larger upside move.
🟢 KEY SUPPORT • Rising trendline support
• $83,600–$84,000 area
• Ichimoku Cloud as dynamic support
📈 BULLISH SCENARIO A strong 1H candle close above the supply zone, followed by a successful retest, could confirm an upside continuation.
📉 BEARISH SCENARIO Rejection from the supply zone + breakdown below the ascending trendline could invalidate the current triangle structure and increase downside pressure.
🎯 KEY DECISION: Breakout or Breakdown
Current BTC is around the mid-$84K area, broadly consistent with the chart's ~$84.7K reading.
⚠️ Wait for confirmation. Don't chase the breakout. Manage risk carefully.
🐂 TradingBulls | Technical Analysis Only
#BTCUSDT! #TradingBulls
$BTC