🚀 $ADX /USDT Testing Crucial Resistance! Is a Breakout Imminent? 📈
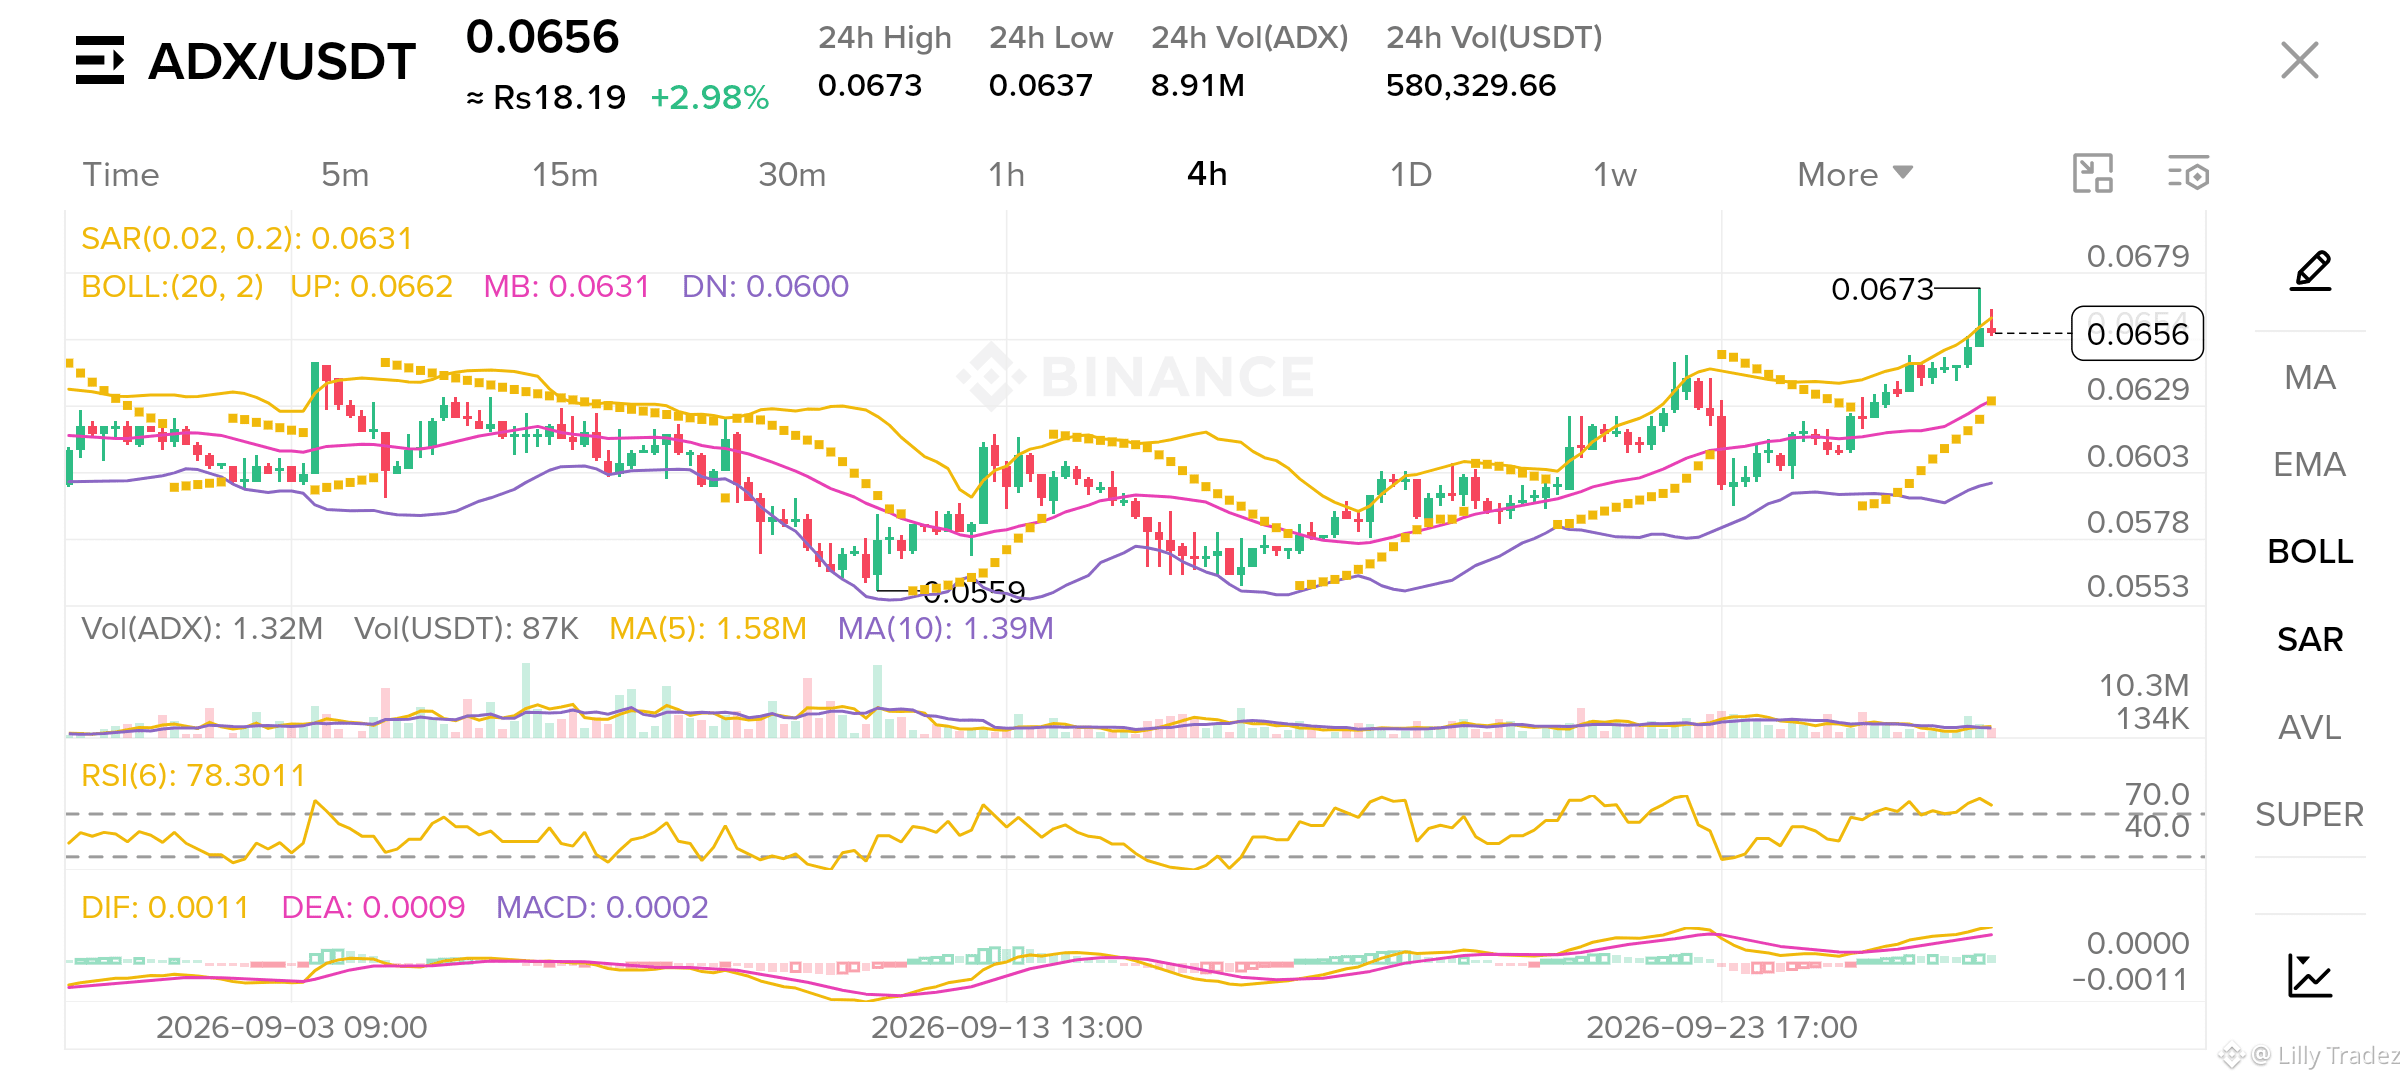
$ADX has shown strong bullish momentum recently, pushing up toward the 0.0673 local high! Here is a breakdown of the 4H chart:
Current Price: $0.0656 (+2.98%)
Key Resistance: $0.0673 - $0.0679
Immediate Support: $0.0631 (SAR & Middle Bollinger Band)
Strong Support: $0.0600 (Lower Bollinger Band)
📊 Technical Indicators:
RSI (6): Currently sitting at 78.3, indicating conditions are in the overbought zone. Watch out for a potential short-term cooling off or consolidation before the next leg up.
MACD: Bullish crossover intact with positive histogram bars (DIF: 0.0011 / DEA: 0.0009).
Bollinger Bands & SAR: Price is hugging the upper band with Parabolic SAR showing strong upward trend continuation.
💡 Trading Strategy:
If price holds above $0.0630 on a pull-back, it can present a solid risk-to-reward re-entry. A clean breakout above $0.0673 could target $0.0700+. Always use tight stop-losses!
What’s your plan on $ADX? Are you buying the dip or taking profits? Drop your thoughts below! 👇
#StrategyStriveAdd2305BitcoinThisWeek ADX #CryptoTrading #StrategyStriveAdd2305BitcoinThisWeek TechnicalAnalysis #StrategyStriveAdd2305BitcoinThisWeek BinanceSquare #StrategyStriveAdd2305BitcoinThisWeek CryptoSignals
$ADX has shown strong bullish momentum recently, pushing up toward the 0.0673 local high! Here is a breakdown of the 4H chart:
Current Price: $0.0656 (+2.98%)
Key Resistance: $0.0673 - $0.0679
Immediate Support: $0.0631 (SAR & Middle Bollinger Band)
Strong Support: $0.0600 (Lower Bollinger Band)
📊 Technical Indicators:
RSI (6): Currently sitting at 78.3, indicating conditions are in the overbought zone. Watch out for a potential short-term cooling off or consolidation before the next leg up.
MACD: Bullish crossover intact with positive histogram bars (DIF: 0.0011 / DEA: 0.0009).
Bollinger Bands & SAR: Price is hugging the upper band with Parabolic SAR showing strong upward trend continuation.
💡 Trading Strategy:
If price holds above $0.0630 on a pull-back, it can present a solid risk-to-reward re-entry. A clean breakout above $0.0673 could target $0.0700+. Always use tight stop-losses!
What’s your plan on $ADX? Are you buying the dip or taking profits? Drop your thoughts below! 👇
#StrategyStriveAdd2305BitcoinThisWeek ADX #CryptoTrading #StrategyStriveAdd2305BitcoinThisWeek TechnicalAnalysis #StrategyStriveAdd2305BitcoinThisWeek BinanceSquare #StrategyStriveAdd2305BitcoinThisWeek CryptoSignals