ZEC/USDT 15m Chart Analysis: Strong Pump and Correction Path Setup! 🚀
if they break $1626 then next move to 1520
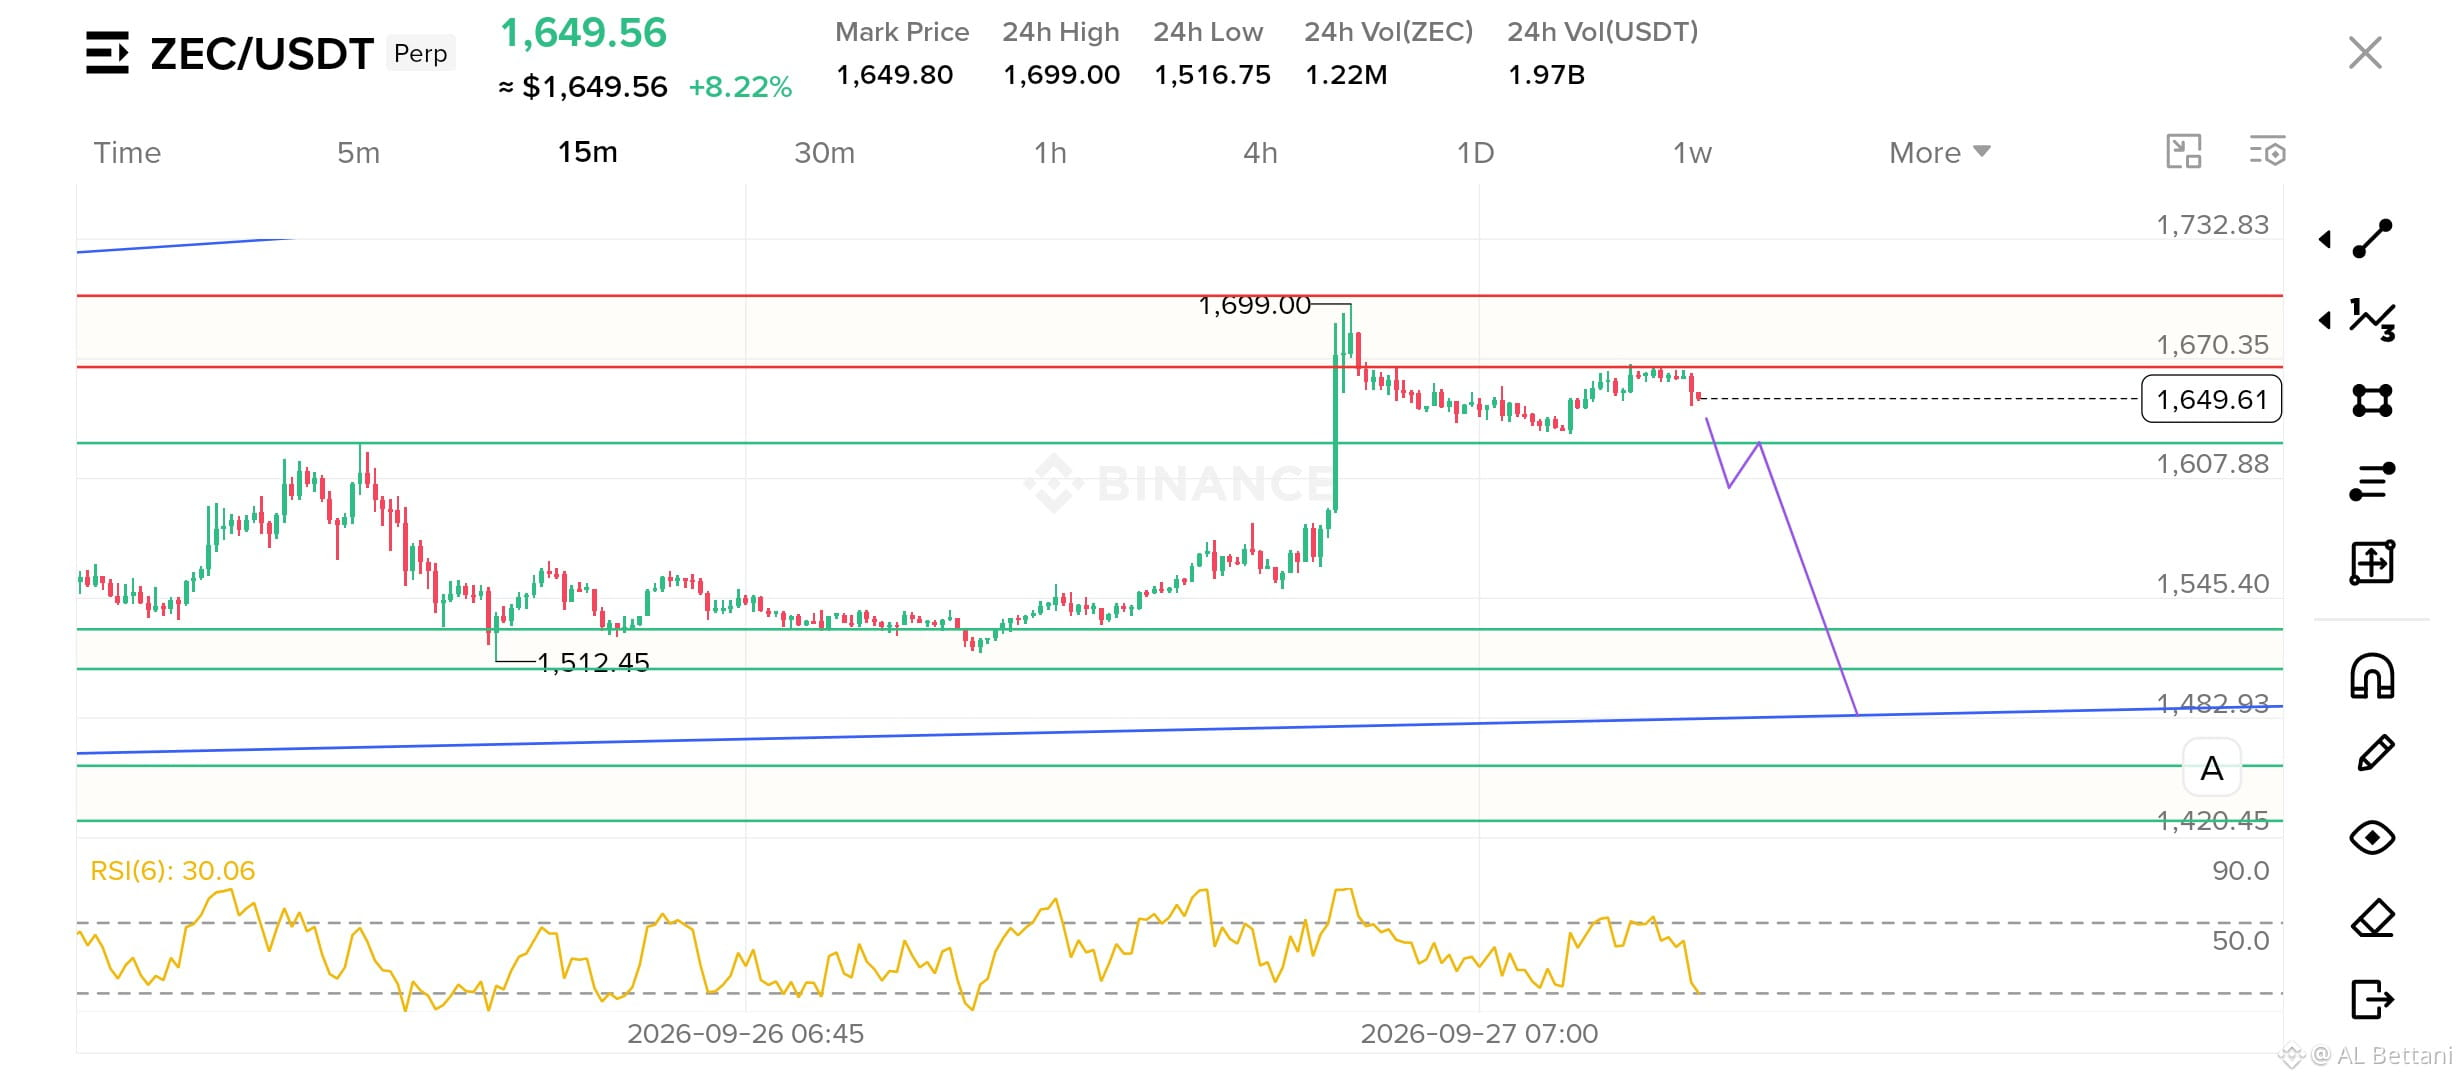
Taking a look at the $ZEC 15-minute timeframe, the price is currently trading at $1,649.56 with an impressive +8.22% gain over the last 24 hours. The chart shows a sharp upward surge reaching a 24h high of $1,699.00, followed by a projected correction path mapped out above.
Current Price: $1,649.56
24h High / Low: $1,699.00 / $1,516.75
Key Support Level: Around $1,607.88 / $1,545.40
Immediate Resistance: Near $1,670.35 - $1,699.00
RSI(6) is currently sitting at 30.06, showing short-term cooling down after a massive rally. Keep these critical zones on your watch list for intraday trading opportunities.
What is your next target for $ZEC? Share your analysis below! 👇
#ZEC #CryptoTrading #BinanceSquare #TechnicalAnalysis $ZEC
if they break $1626 then next move to 1520
Taking a look at the $ZEC 15-minute timeframe, the price is currently trading at $1,649.56 with an impressive +8.22% gain over the last 24 hours. The chart shows a sharp upward surge reaching a 24h high of $1,699.00, followed by a projected correction path mapped out above.
Current Price: $1,649.56
24h High / Low: $1,699.00 / $1,516.75
Key Support Level: Around $1,607.88 / $1,545.40
Immediate Resistance: Near $1,670.35 - $1,699.00
RSI(6) is currently sitting at 30.06, showing short-term cooling down after a massive rally. Keep these critical zones on your watch list for intraday trading opportunities.
What is your next target for $ZEC? Share your analysis below! 👇
#ZEC #CryptoTrading #BinanceSquare #TechnicalAnalysis $ZEC