

Jack_TheAnalyst
6 Bài đăng

Jack_TheAnalyst
Báo cáo
Chặn người dùng
4 Đang theo dõi
4 Người theo dõi
8 Đã thích
Bài đăng
PINNED
·
--
Tăng giá
Xin chào Binance Square!
Jack_TheAnalyst đã có mặt
Là một nhà sáng tạo nội dung chuyên nghiệp, tập trung vào việc cung cấp thông tin thị trường rõ ràng và không thiên vị.
Tôi ở đây để xây dựng một cộng đồng gồm những nhà giao dịch và nhà đầu tư thông minh, có tư duy phân tích.
Nhấn nút Theo dõi để luôn cập nhật bình luận thị trường hằng ngày, các biểu đồ được sắp xếp rõ ràng và các phần phân tích theo thời gian thực.
$NVDAB $AAPLB $LSK
{future}(LSKUSDT)
#BinanceWillListHyperliquid(HYPE) #FedOctoberRateHikeOddsRiseTo69.7%
Xin chào Binance Square!
Jack_TheAnalyst đã có mặt
Là một nhà sáng tạo nội dung chuyên nghiệp, tập trung vào việc cung cấp thông tin thị trường rõ ràng và không thiên vị.
Tôi ở đây để xây dựng một cộng đồng gồm những nhà giao dịch và nhà đầu tư thông minh, có tư duy phân tích.
Nhấn nút Theo dõi để luôn cập nhật bình luận thị trường hằng ngày, các biểu đồ được sắp xếp rõ ràng và các phần phân tích theo thời gian thực.
$NVDAB $AAPLB $LSK
#BinanceWillListHyperliquid(HYPE) #FedOctoberRateHikeOddsRiseTo69.7%
Jack_TheAnalyst đã có mặt
Là một nhà sáng tạo nội dung chuyên nghiệp, tập trung vào việc cung cấp thông tin thị trường rõ ràng và không thiên vị.
Tôi ở đây để xây dựng một cộng đồng gồm những nhà giao dịch và nhà đầu tư thông minh, có tư duy phân tích.
Nhấn nút Theo dõi để luôn cập nhật bình luận thị trường hằng ngày, các biểu đồ được sắp xếp rõ ràng và các phần phân tích theo thời gian thực.
$NVDAB $AAPLB $LSK
#BinanceWillListHyperliquid(HYPE) #FedOctoberRateHikeOddsRiseTo69.7%
2
151
Bài viết
Xem bản dịch
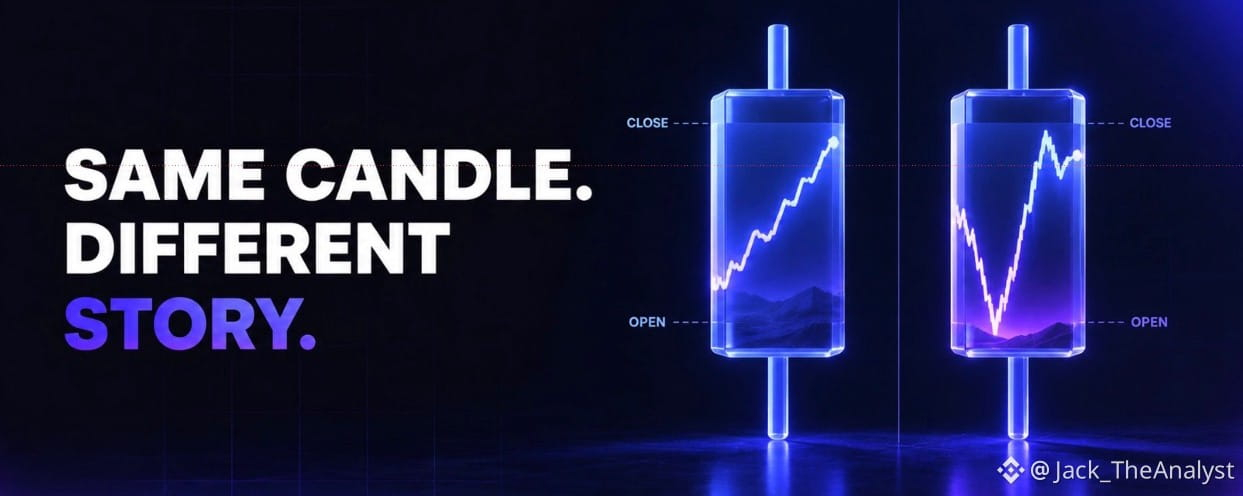
What a Candle Can Hide?Higher-timeframe candles are useful because they compress a large amount of price action into something easy to read. The problem is that two candles with almost identical opens, highs, lows and closes can be created through very different sequences of events.
That sequence can matter when evaluating what actually happened during the session.
Suppose BTC opens at $80,000 and closesat $82,000. In the first scenario, price gradually moves higher throughout the day, pullbacks remain shallow, and most of the final hours are spent near $82,000. Buyers gained ground and were able to maintain it.
Now imagine the same open and close, but BTC first drops to $77,500, aggressively recovers to $83,000 and then falls back to $82,000 before the daily close.
Both sessions finish bullish, but they tell different stories. The second contained a failed move lower, a strong recovery and then selling above the eventual closing price. None of that is fully explained by simply calling the daily candle bullish.
This becomes especially useful around important levels.
Imagine a daily candle closes slightly above resistance. Looking only at the daily chart, it may appear to be a successful breakout. But a lower timeframe might show that price broke resistance early, spent most of the session back below it and only recovered during the final hour.
Compare that with a session that breaks resistance early, retests it from above and spends the remainder of the day building higher. The daily candles could eventually look similar, but the second shows much clearer acceptance above the level.
Lower timeframes can therefore be used as a diagnostic tool rather than simply as another place to search for entries.
When a higher-timeframe candle forms at an important area, look inside it and ask a few basic questions. Which side moved first? Was that move sustained or rejected? Where did price spend most of the session? Did the close confirm the dominant behavior of the day, or did a late move dramatically change the final candle?
You do not need to dissect every daily candle.
Most of the time, the higher timeframe provides enough information on its own.
But around major breakouts, failed moves and turning points, understanding how the candle was built can reveal information that its final shape compresses away.
The candle shows the result.
Sometimes the sequence explains how meaningful that result actually was.
#BTC走势分析 $BTC #PolymarketBankFailureBetsDrawFDICConcern #BlackRockBuildsTokenizedPortfoliosForOndo
{future}(BTCUSDT)
What a Candle Can Hide?
Higher-timeframe candles are useful because they compress a large amount of price action into something easy to read. The problem is that two candles with almost identical opens, highs, lows and closes can be created through very different sequences of events.
That sequence can matter when evaluating what actually happened during the session.
Suppose BTC opens at $80,000 and closesat $82,000. In the first scenario, price gradually moves higher throughout the day, pullbacks remain shallow, and most of the final hours are spent near $82,000. Buyers gained ground and were able to maintain it.
Now imagine the same open and close, but BTC first drops to $77,500, aggressively recovers to $83,000 and then falls back to $82,000 before the daily close.
Both sessions finish bullish, but they tell different stories. The second contained a failed move lower, a strong recovery and then selling above the eventual closing price. None of that is fully explained by simply calling the daily candle bullish.
This becomes especially useful around important levels.
Imagine a daily candle closes slightly above resistance. Looking only at the daily chart, it may appear to be a successful breakout. But a lower timeframe might show that price broke resistance early, spent most of the session back below it and only recovered during the final hour.
Compare that with a session that breaks resistance early, retests it from above and spends the remainder of the day building higher. The daily candles could eventually look similar, but the second shows much clearer acceptance above the level.
Lower timeframes can therefore be used as a diagnostic tool rather than simply as another place to search for entries.
When a higher-timeframe candle forms at an important area, look inside it and ask a few basic questions. Which side moved first? Was that move sustained or rejected? Where did price spend most of the session? Did the close confirm the dominant behavior of the day, or did a late move dramatically change the final candle?
You do not need to dissect every daily candle.
Most of the time, the higher timeframe provides enough information on its own.
But around major breakouts, failed moves and turning points, understanding how the candle was built can reveal information that its final shape compresses away.
The candle shows the result.
Sometimes the sequence explains how meaningful that result actually was.
#BTC走势分析 $BTC #PolymarketBankFailureBetsDrawFDICConcern #BlackRockBuildsTokenizedPortfoliosForOndo
That sequence can matter when evaluating what actually happened during the session.
Suppose BTC opens at $80,000 and closesat $82,000. In the first scenario, price gradually moves higher throughout the day, pullbacks remain shallow, and most of the final hours are spent near $82,000. Buyers gained ground and were able to maintain it.
Now imagine the same open and close, but BTC first drops to $77,500, aggressively recovers to $83,000 and then falls back to $82,000 before the daily close.
Both sessions finish bullish, but they tell different stories. The second contained a failed move lower, a strong recovery and then selling above the eventual closing price. None of that is fully explained by simply calling the daily candle bullish.
This becomes especially useful around important levels.
Imagine a daily candle closes slightly above resistance. Looking only at the daily chart, it may appear to be a successful breakout. But a lower timeframe might show that price broke resistance early, spent most of the session back below it and only recovered during the final hour.
Compare that with a session that breaks resistance early, retests it from above and spends the remainder of the day building higher. The daily candles could eventually look similar, but the second shows much clearer acceptance above the level.
Lower timeframes can therefore be used as a diagnostic tool rather than simply as another place to search for entries.
When a higher-timeframe candle forms at an important area, look inside it and ask a few basic questions. Which side moved first? Was that move sustained or rejected? Where did price spend most of the session? Did the close confirm the dominant behavior of the day, or did a late move dramatically change the final candle?
You do not need to dissect every daily candle.
Most of the time, the higher timeframe provides enough information on its own.
But around major breakouts, failed moves and turning points, understanding how the candle was built can reveal information that its final shape compresses away.
The candle shows the result.
Sometimes the sequence explains how meaningful that result actually was.
#BTC走势分析 $BTC #PolymarketBankFailureBetsDrawFDICConcern #BlackRockBuildsTokenizedPortfoliosForOndo
71
·
--
Tăng giá
Giao dịch Dài hạn SOL Swing
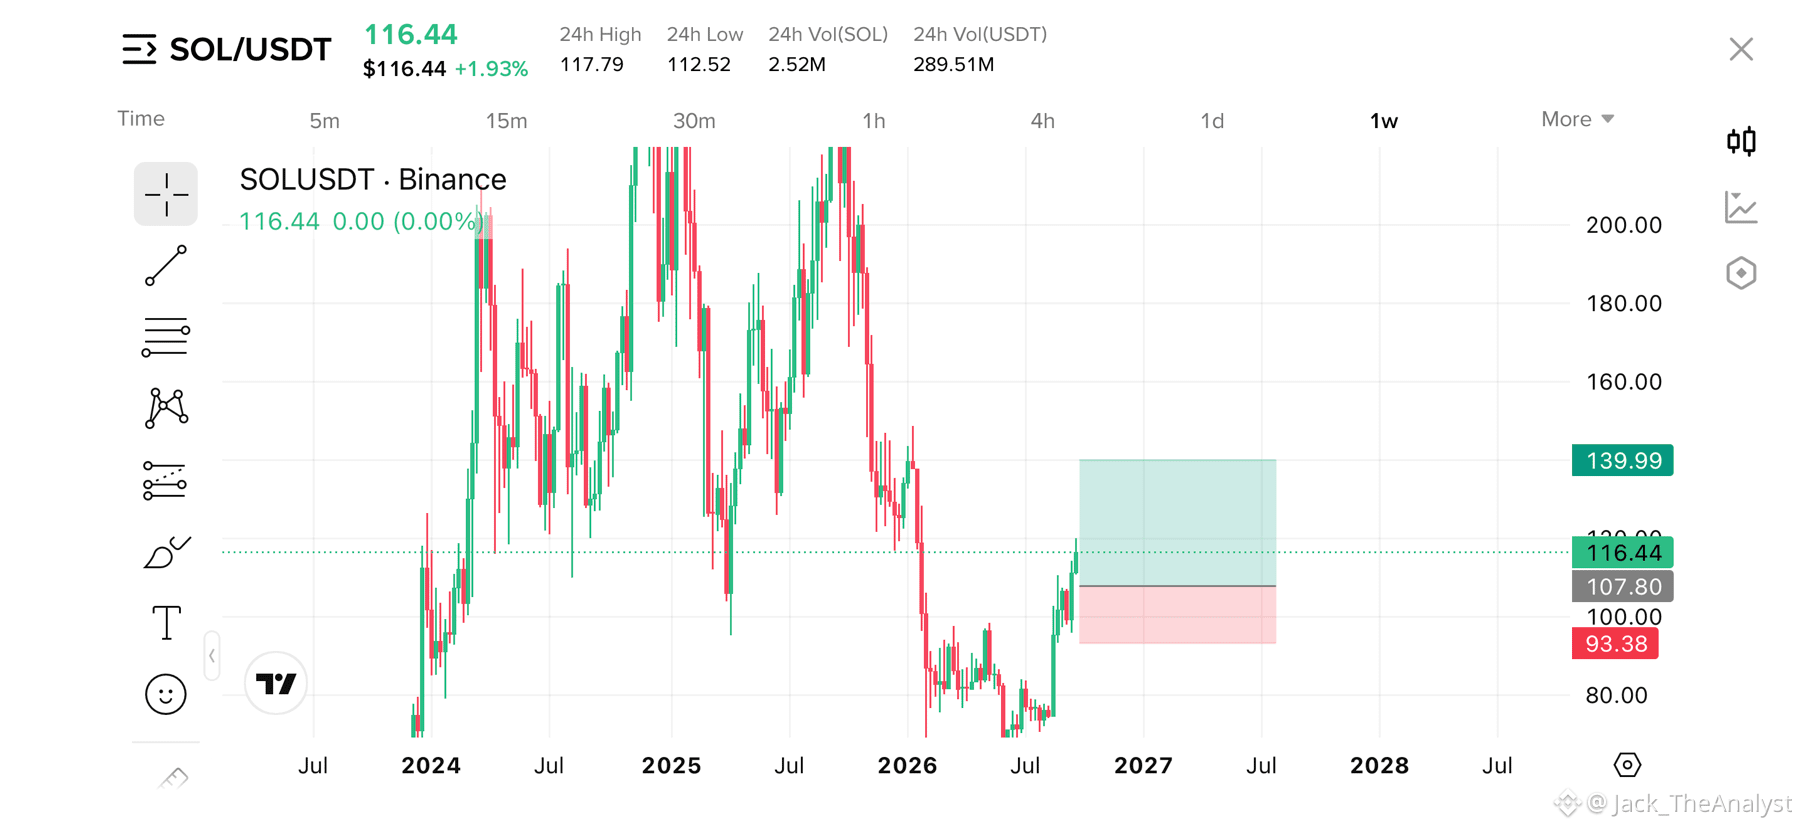
Solana ($SOL) đang hình thành một cấu trúc vững chắc trên biểu đồ khung tuần, bảo vệ các vùng giá trị quan trọng sau một giai đoạn điều chỉnh kéo dài.
Kháng cự đã bị phá vỡ và nến tuần đã đóng cửa trên mức đó, sau đó đã được kiểm tra lại.
(RR): ~1 : 2.24
Mức vào lệnh: $107.80
Chốt lời (TP): $140.00
Cắt lỗ (SL): $93.38
Có thể chốt một phần tại $140.00, sau đó chúng ta có thể giữ lệnh đến mức tiếp theo là $200.00 để chốt lời cuối cùng.
#solonapumping #sol板块 #SolanaUSTD
$NVDAB $AAPLB $AAPL.US
Giao dịch Dài hạn SOL Swing
Solana ($SOL) đang hình thành một cấu trúc vững chắc trên biểu đồ khung tuần, bảo vệ các vùng giá trị quan trọng sau một giai đoạn điều chỉnh kéo dài.
Kháng cự đã bị phá vỡ và nến tuần đã đóng cửa trên mức đó, sau đó đã được kiểm tra lại.
(RR): ~1 : 2.24
Mức vào lệnh: $107.80
Chốt lời (TP): $140.00
Cắt lỗ (SL): $93.38
Có thể chốt một phần tại $140.00, sau đó chúng ta có thể giữ lệnh đến mức tiếp theo là $200.00 để chốt lời cuối cùng.
#solonapumping #sol板块 #SolanaUSTD
$NVDAB $AAPLB $AAPL.US
Solana ($SOL) đang hình thành một cấu trúc vững chắc trên biểu đồ khung tuần, bảo vệ các vùng giá trị quan trọng sau một giai đoạn điều chỉnh kéo dài.
Kháng cự đã bị phá vỡ và nến tuần đã đóng cửa trên mức đó, sau đó đã được kiểm tra lại.
(RR): ~1 : 2.24
Mức vào lệnh: $107.80
Chốt lời (TP): $140.00
Cắt lỗ (SL): $93.38
Có thể chốt một phần tại $140.00, sau đó chúng ta có thể giữ lệnh đến mức tiếp theo là $200.00 để chốt lời cuối cùng.
#solonapumping #sol板块 #SolanaUSTD
$NVDAB $AAPLB $AAPL.US
1
78
·
--
Tăng giá
#dodgecoin DOGE/USDT
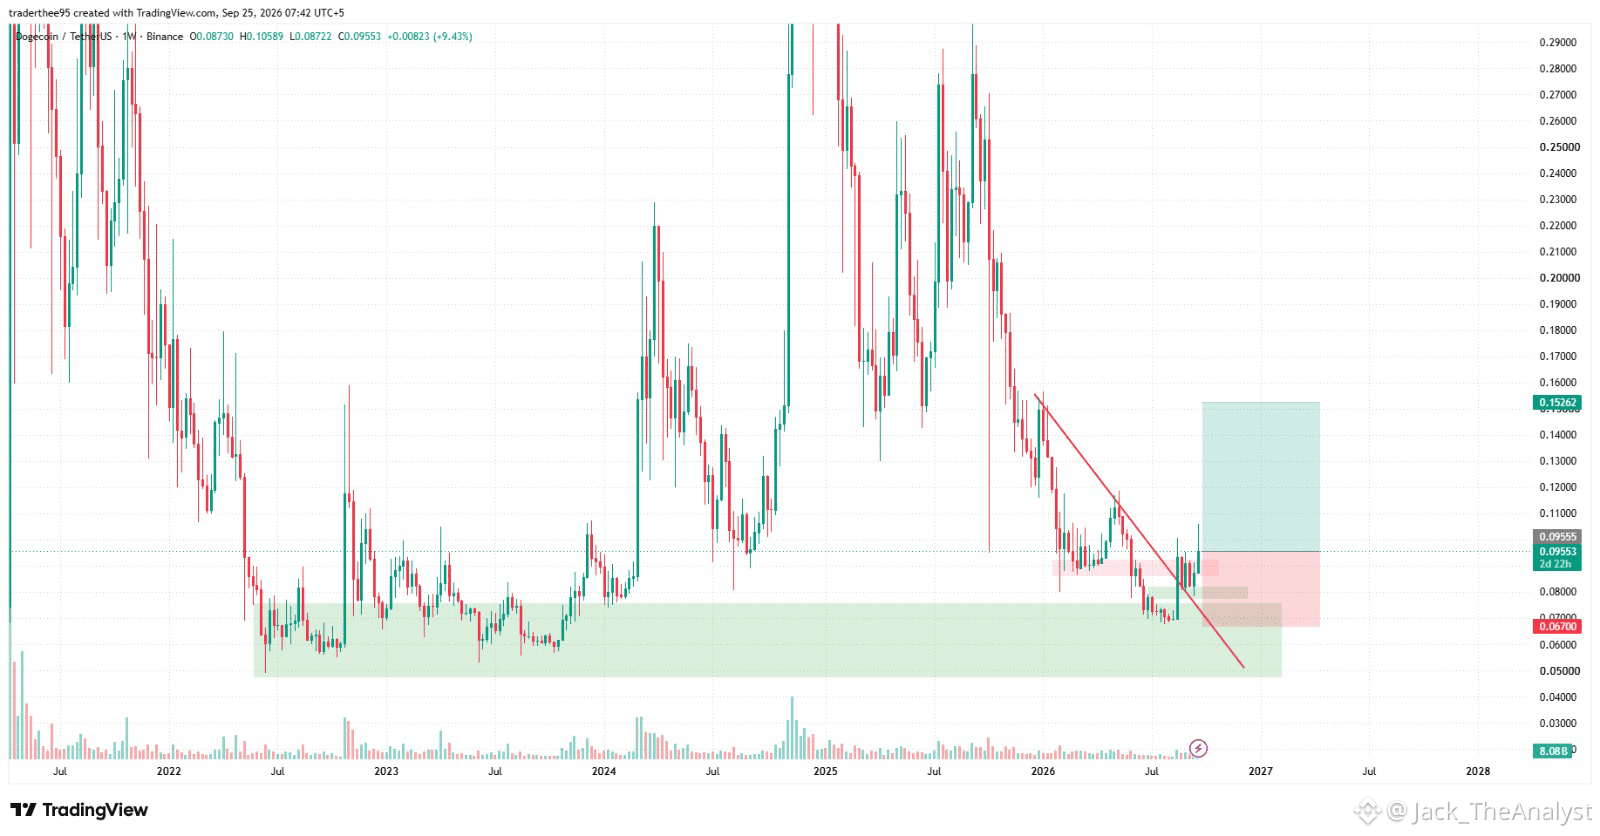
DOGE đã kiểm tra lại một vùng hỗ trợ macro quan trọng (dao động từ $0.0500 - $0.0700) có nguồn gốc từ đầu năm 2021.
Sau cú bật lên từ khu vực hỗ trợ lớn này, giá đã phá vỡ mức Kháng cự ban đầu chuyển thành Hỗ trợ (RBS) quanh $0.08892, đồng thời trùng khớp với một đợt breakout sạch lên trên đường xu hướng giảm chính.
Sau khi giành lại đường xu hướng breakout, DOGE tiếp tục vượt qua vùng kháng cự gần đây của mình, qua đó xác nhận sự thay đổi cấu trúc hướng tới kịch bản tiếp diễn tăng mạnh.
Điểm vào lệnh: ~$0.09508 (Giá thị trường hiện tại hoặc điều chỉnh nhẹ).
Cắt lỗ (SL): $0.06700 (Đặt an toàn dưới vùng hỗ trợ cấu trúc quan trọng).
Chốt lời (TP): $0.15262 (Mục tiêu chính tại vùng kháng cự đỉnh swing quan trọng).
#Dogecoin #doge⚡ #DOGEUSDT
$AAPL.US $AAPLB $GOOGL.US
#dodgecoin DOGE/USDT
DOGE đã kiểm tra lại một vùng hỗ trợ macro quan trọng (dao động từ $0.0500 - $0.0700) có nguồn gốc từ đầu năm 2021.
Sau cú bật lên từ khu vực hỗ trợ lớn này, giá đã phá vỡ mức Kháng cự ban đầu chuyển thành Hỗ trợ (RBS) quanh $0.08892, đồng thời trùng khớp với một đợt breakout sạch lên trên đường xu hướng giảm chính.
Sau khi giành lại đường xu hướng breakout, DOGE tiếp tục vượt qua vùng kháng cự gần đây của mình, qua đó xác nhận sự thay đổi cấu trúc hướng tới kịch bản tiếp diễn tăng mạnh.
Điểm vào lệnh: ~$0.09508 (Giá thị trường hiện tại hoặc điều chỉnh nhẹ).
Cắt lỗ (SL): $0.06700 (Đặt an toàn dưới vùng hỗ trợ cấu trúc quan trọng).
Chốt lời (TP): $0.15262 (Mục tiêu chính tại vùng kháng cự đỉnh swing quan trọng).
#Dogecoin #doge⚡ #DOGEUSDT
$AAPL.US $AAPLB $GOOGL.US
DOGE đã kiểm tra lại một vùng hỗ trợ macro quan trọng (dao động từ $0.0500 - $0.0700) có nguồn gốc từ đầu năm 2021.
Sau cú bật lên từ khu vực hỗ trợ lớn này, giá đã phá vỡ mức Kháng cự ban đầu chuyển thành Hỗ trợ (RBS) quanh $0.08892, đồng thời trùng khớp với một đợt breakout sạch lên trên đường xu hướng giảm chính.
Sau khi giành lại đường xu hướng breakout, DOGE tiếp tục vượt qua vùng kháng cự gần đây của mình, qua đó xác nhận sự thay đổi cấu trúc hướng tới kịch bản tiếp diễn tăng mạnh.
Điểm vào lệnh: ~$0.09508 (Giá thị trường hiện tại hoặc điều chỉnh nhẹ).
Cắt lỗ (SL): $0.06700 (Đặt an toàn dưới vùng hỗ trợ cấu trúc quan trọng).
Chốt lời (TP): $0.15262 (Mục tiêu chính tại vùng kháng cự đỉnh swing quan trọng).
#Dogecoin #doge⚡ #DOGEUSDT
$AAPL.US $AAPLB $GOOGL.US
1
195
·
--
Tăng giá
#Litecoin Phân Rã Tích Lũy Nhiều Năm & Phục Hồi — Thiết Lập Dài
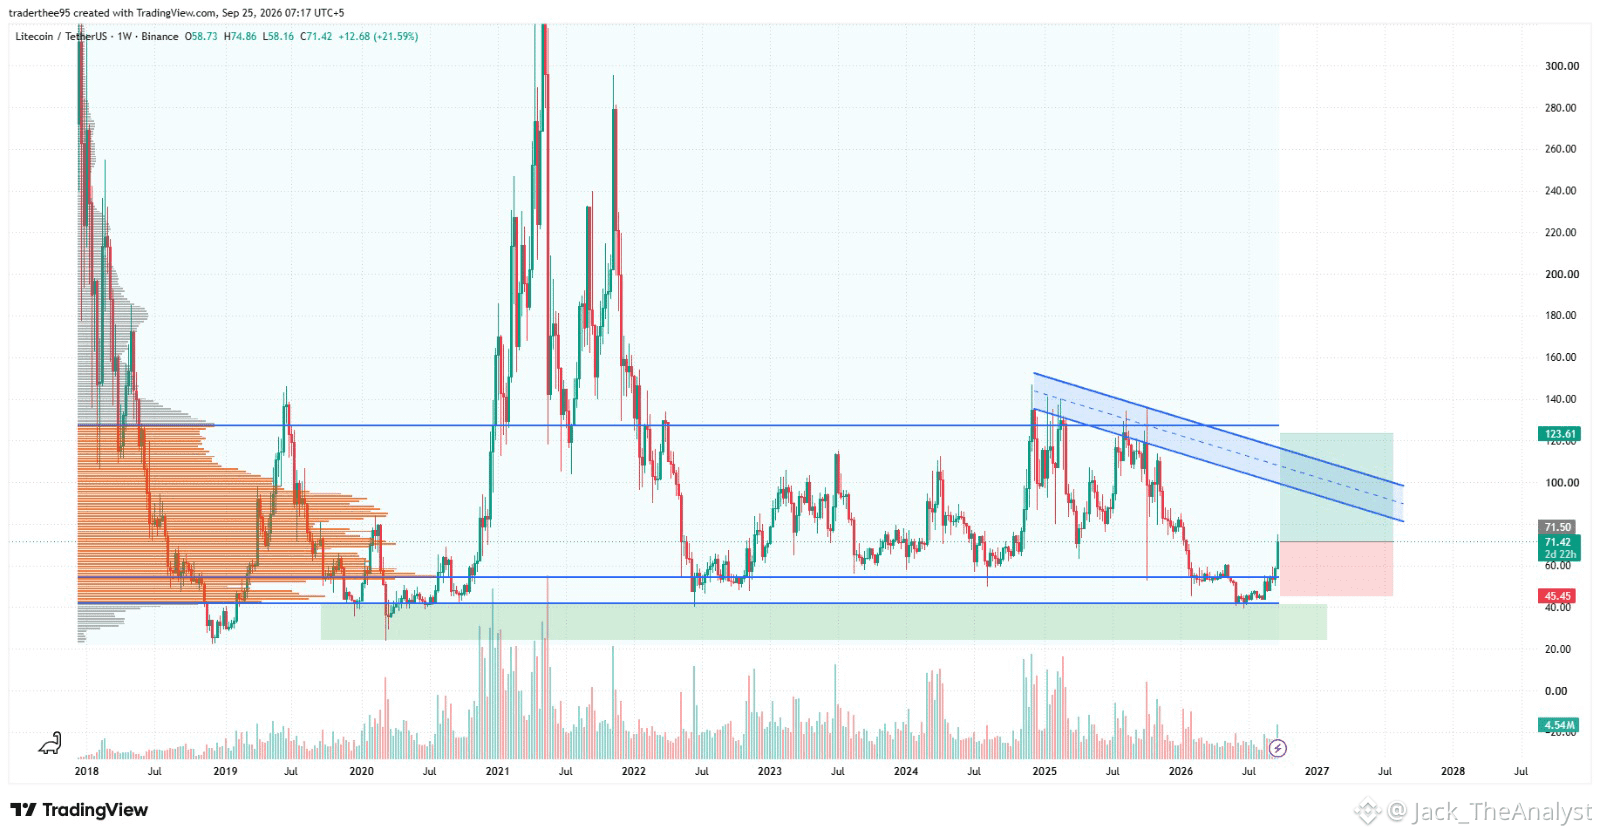
Giá Litecoin gần đây đã vượt qua một mức kháng cự quan trọng quanh $60.47, và hiện đang đóng vai trò là vùng hỗ trợ quan trọng. Sự thay đổi cấu trúc thị trường này đáng để theo dõi vì việc duy trì giá trên vùng này có thể củng cố khả năng rằng đợt giảm xuống dưới phạm vi trước đó chỉ là một đợt lệch khỏi xu hướng (deviation) chứ không phải sự phá vỡ kéo dài.
Biểu Đồ Hồ Sơ Khối Lượng (Volume Profile): Việc tích lũy vững chắc ở các mức thấp hơn cho thấy các nhà đầu tư dài hạn đang bảo vệ vùng này.
Vùng Vào Lệnh: Giá thị trường hiện tại (71.04) hoặc chờ các nhịp điều chỉnh nhẹ về khoảng $60.00 - $65.00
Chốt Lời (TP): $123.60 (Kháng Cự Trên & Mục Tiêu Kênh)
Cắt Lỗ (SL): $45.45 (Dưới hỗ trợ cấu trúc quan trọng)
#Litecoin #LitecoinUpdate #LitecoinRevolution
$NVDAB $AAPLB $AAPL.US
#Litecoin Phân Rã Tích Lũy Nhiều Năm & Phục Hồi — Thiết Lập Dài
Giá Litecoin gần đây đã vượt qua một mức kháng cự quan trọng quanh $60.47, và hiện đang đóng vai trò là vùng hỗ trợ quan trọng. Sự thay đổi cấu trúc thị trường này đáng để theo dõi vì việc duy trì giá trên vùng này có thể củng cố khả năng rằng đợt giảm xuống dưới phạm vi trước đó chỉ là một đợt lệch khỏi xu hướng (deviation) chứ không phải sự phá vỡ kéo dài.
Biểu Đồ Hồ Sơ Khối Lượng (Volume Profile): Việc tích lũy vững chắc ở các mức thấp hơn cho thấy các nhà đầu tư dài hạn đang bảo vệ vùng này.
Vùng Vào Lệnh: Giá thị trường hiện tại (71.04) hoặc chờ các nhịp điều chỉnh nhẹ về khoảng $60.00 - $65.00
Chốt Lời (TP): $123.60 (Kháng Cự Trên & Mục Tiêu Kênh)
Cắt Lỗ (SL): $45.45 (Dưới hỗ trợ cấu trúc quan trọng)
#Litecoin #LitecoinUpdate #LitecoinRevolution
$NVDAB $AAPLB $AAPL.US
Giá Litecoin gần đây đã vượt qua một mức kháng cự quan trọng quanh $60.47, và hiện đang đóng vai trò là vùng hỗ trợ quan trọng. Sự thay đổi cấu trúc thị trường này đáng để theo dõi vì việc duy trì giá trên vùng này có thể củng cố khả năng rằng đợt giảm xuống dưới phạm vi trước đó chỉ là một đợt lệch khỏi xu hướng (deviation) chứ không phải sự phá vỡ kéo dài.
Biểu Đồ Hồ Sơ Khối Lượng (Volume Profile): Việc tích lũy vững chắc ở các mức thấp hơn cho thấy các nhà đầu tư dài hạn đang bảo vệ vùng này.
Vùng Vào Lệnh: Giá thị trường hiện tại (71.04) hoặc chờ các nhịp điều chỉnh nhẹ về khoảng $60.00 - $65.00
Chốt Lời (TP): $123.60 (Kháng Cự Trên & Mục Tiêu Kênh)
Cắt Lỗ (SL): $45.45 (Dưới hỗ trợ cấu trúc quan trọng)
#Litecoin #LitecoinUpdate #LitecoinRevolution
$NVDAB $AAPLB $AAPL.US
1
135
·
--
Tăng giá
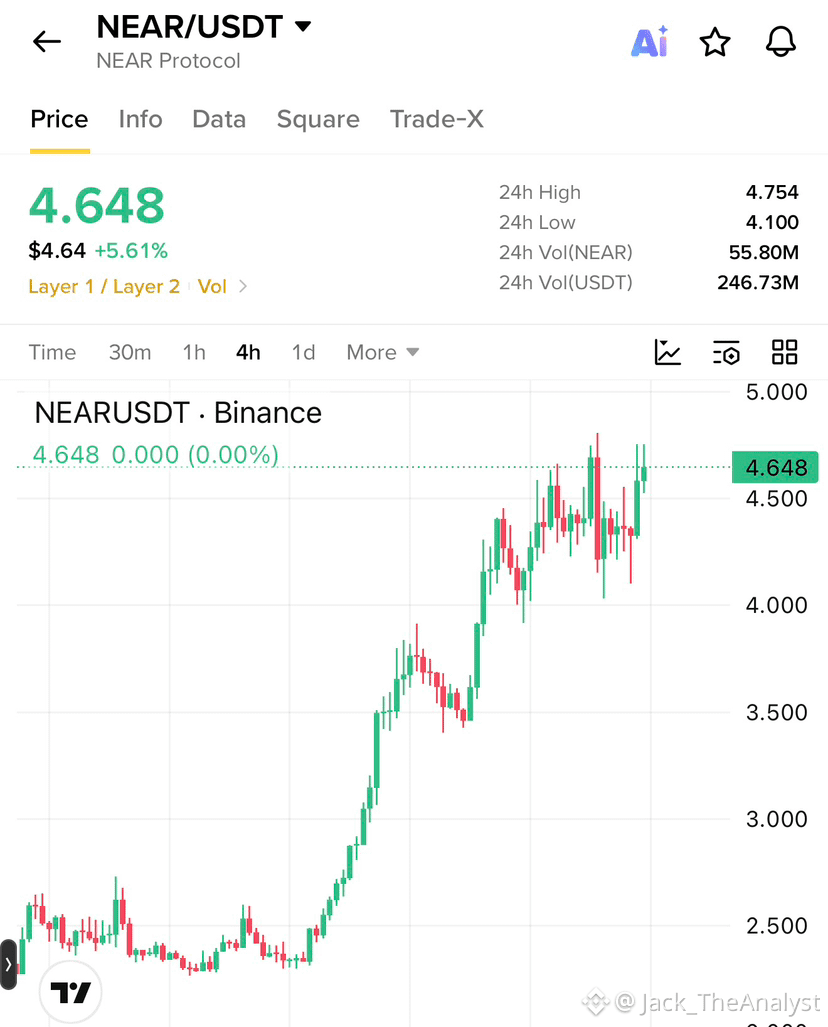
Giao thức NEAR ($NEAR) đang thể hiện đà tăng mạnh mẽ trên biểu đồ khung 4 giờ, phá vỡ các mức tích lũy kéo dài nhiều tháng để hướng tới $4.65.
Đối với Lệnh Mua: Nến khung 4 giờ đã được xác nhận đóng trên $4.75 sẽ mở ra lối đi đến $5.00, với các mục tiêu swing phụ ở $5.50 và $6.00.
Kịch bản Giảm / Điều Chỉnh: Việc không thể vượt qua $4.75 có thể khiến nhà đầu tư chốt lời trong ngắn hạn, kéo giá về vùng hỗ trợ $4.10 – $4.20 trước khi có một lần thử tăng trở lại.
#Near #NEARUSDT #NEAR🚀🚀🚀 $NEAR
{spot}(NEARUSDT)
Giao thức NEAR ($NEAR ) đang thể hiện đà tăng mạnh mẽ trên biểu đồ khung 4 giờ, phá vỡ các mức tích lũy kéo dài nhiều tháng để hướng tới $4.65.
Đối với Lệnh Mua: Nến khung 4 giờ đã được xác nhận đóng trên $4.75 sẽ mở ra lối đi đến $5.00, với các mục tiêu swing phụ ở $5.50 và $6.00.
Kịch bản Giảm / Điều Chỉnh: Việc không thể vượt qua $4.75 có thể khiến nhà đầu tư chốt lời trong ngắn hạn, kéo giá về vùng hỗ trợ $4.10 – $4.20 trước khi có một lần thử tăng trở lại.
#Near #NEARUSDT #NEAR🚀🚀🚀 $NEAR
Đối với Lệnh Mua: Nến khung 4 giờ đã được xác nhận đóng trên $4.75 sẽ mở ra lối đi đến $5.00, với các mục tiêu swing phụ ở $5.50 và $6.00.
Kịch bản Giảm / Điều Chỉnh: Việc không thể vượt qua $4.75 có thể khiến nhà đầu tư chốt lời trong ngắn hạn, kéo giá về vùng hỗ trợ $4.10 – $4.20 trước khi có một lần thử tăng trở lại.
#Near #NEARUSDT #NEAR🚀🚀🚀 $NEAR
3
717
Đăng nhập để khám phá thêm nội dung
Tham gia cùng người dùng tiền mã hóa toàn cầu trên Binance Square
⚡️ Nhận thông tin mới nhất và hữu ích về tiền mã hóa.
💬 Được tin cậy bởi sàn giao dịch tiền mã hóa lớn nhất thế giới.
👍 Khám phá những thông tin chuyên sâu thực tế từ những nhà sáng tạo đã xác minh.
Email / Số điện thoại