$QI /USDT — 1D Chart Analysis 📊
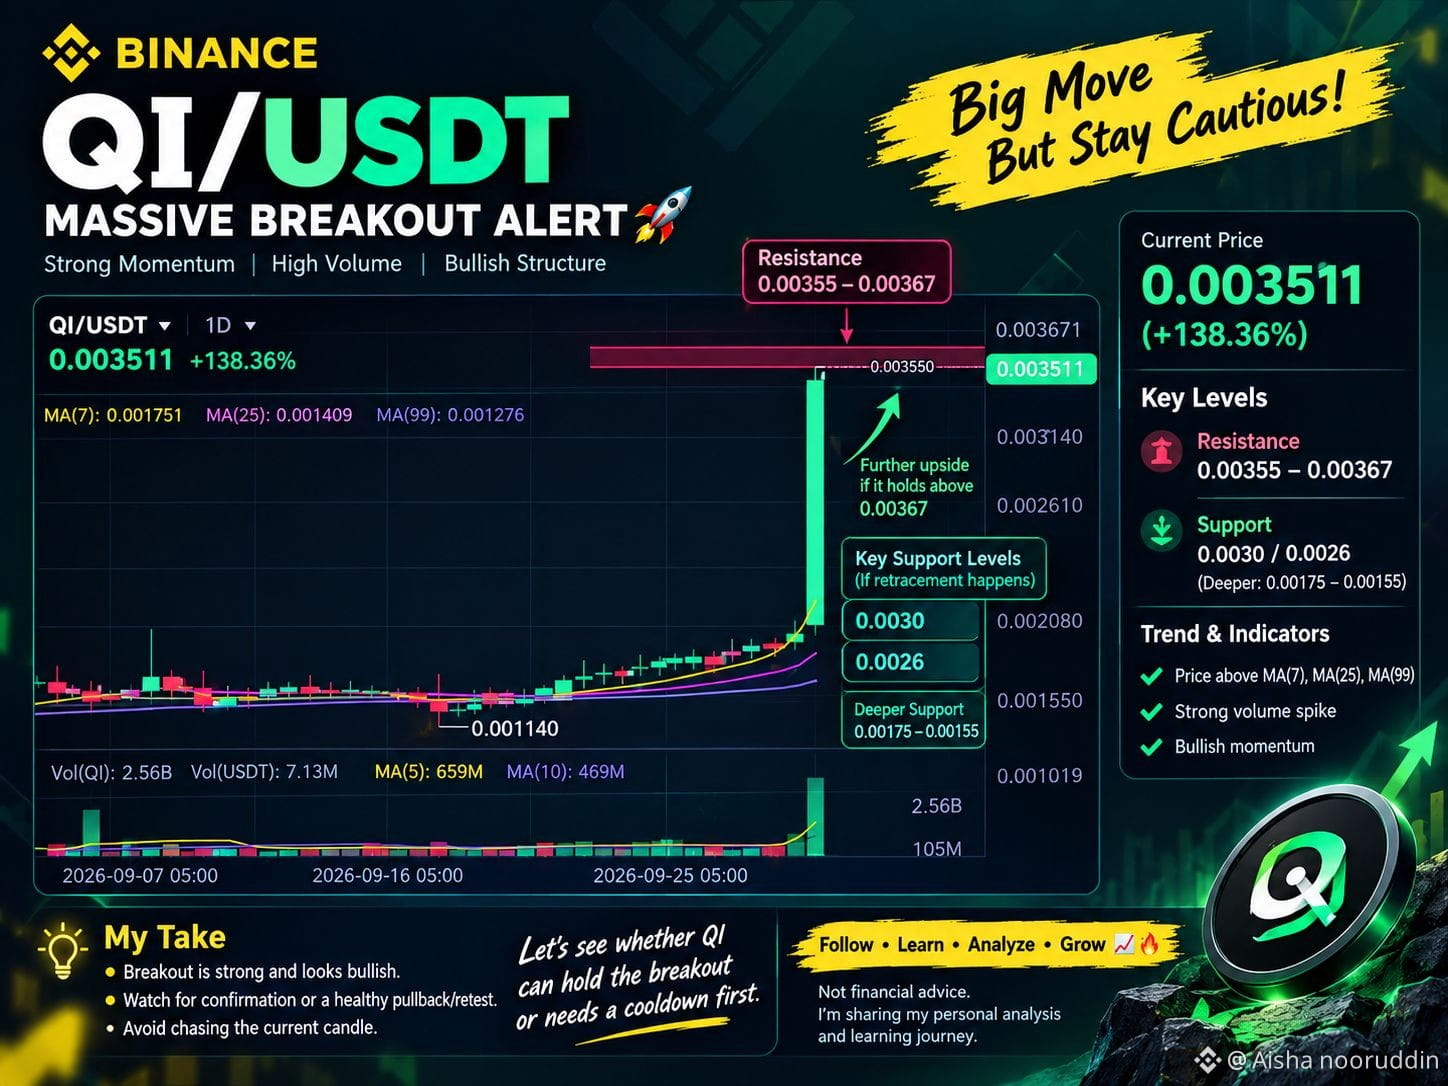
$QI is showing a very strong breakout, with price around 0.00351 and a massive daily move of approximately +138%.
What the chart shows:
🚀 Strong breakout candle with heavy volume.
📈 Price is well above MA(7), MA(25), and MA(99), showing strong short-term momentum.
🔥 Immediate resistance: 0.00355–0.00367
🟢 If price breaks and holds above 0.00367, further upside could develop.
🟡 After such a sharp move, a pullback/retest is possible, so chasing the current candle carries higher risk.
Key areas to watch on a retracement: 0.0030, then 0.0026, with deeper support around 0.00175–0.00155.
> QI/USDT — Massive Breakout Alert 🚀
$QI has exploded higher with a huge volume spike, breaking far above its previous trading range.
The momentum is impressive, but after a move this strong, I’d rather watch for confirmation or a healthy retest than chase the candle.
👀 Levels I’m watching:
Resistance: 0.00355–0.00367
Support: 0.0030 / 0.0026
Let’s see whether QI can hold the breakout or needs a cooldown first.
Not financial advice. Sharing my personal analysis and learning journey.
Follow • Learn • Analyze • Grow
$QI is showing a very strong breakout, with price around 0.00351 and a massive daily move of approximately +138%.
What the chart shows:
🚀 Strong breakout candle with heavy volume.
📈 Price is well above MA(7), MA(25), and MA(99), showing strong short-term momentum.
🔥 Immediate resistance: 0.00355–0.00367
🟢 If price breaks and holds above 0.00367, further upside could develop.
🟡 After such a sharp move, a pullback/retest is possible, so chasing the current candle carries higher risk.
Key areas to watch on a retracement: 0.0030, then 0.0026, with deeper support around 0.00175–0.00155.
> QI/USDT — Massive Breakout Alert 🚀
$QI has exploded higher with a huge volume spike, breaking far above its previous trading range.
The momentum is impressive, but after a move this strong, I’d rather watch for confirmation or a healthy retest than chase the candle.
👀 Levels I’m watching:
Resistance: 0.00355–0.00367
Support: 0.0030 / 0.0026
Let’s see whether QI can hold the breakout or needs a cooldown first.
Not financial advice. Sharing my personal analysis and learning journey.
Follow • Learn • Analyze • Grow