QI/USDT ANALYSIS
🚀 QI EXPLODES +86%: MASSIVE VERTICAL PUMP — WILL IT CONTINUATION OR RETRACE? 📈🔥
QI | QI/USDT
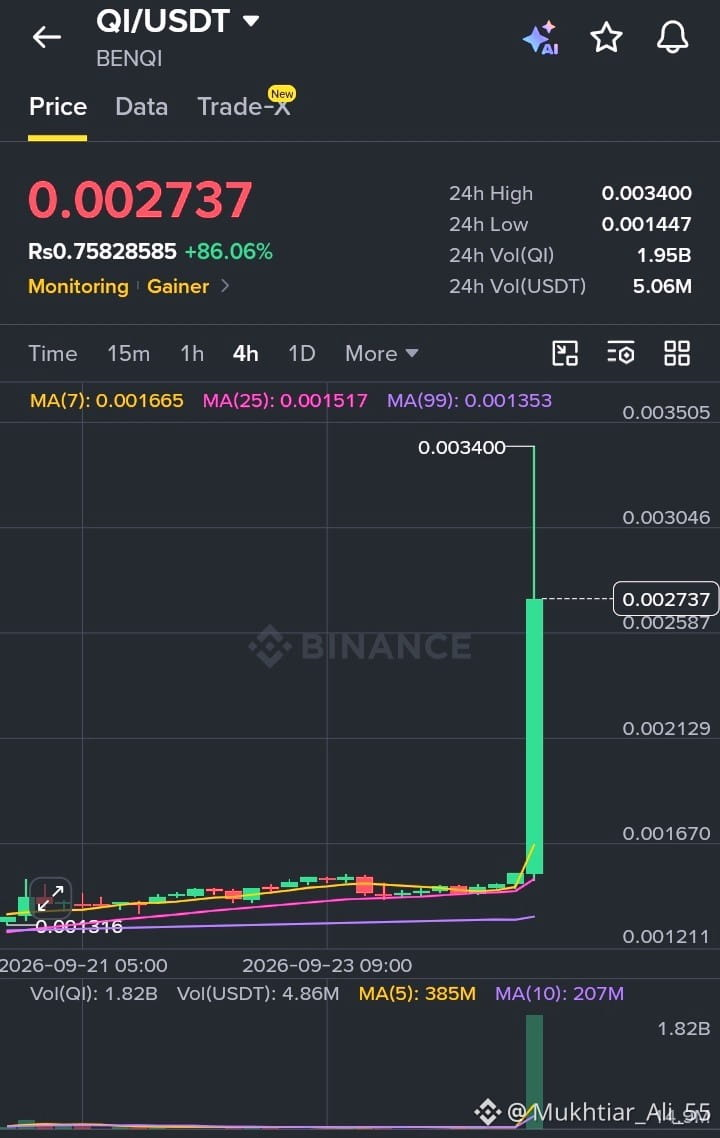
💰 Price: 0.002737
📈 24H Change: +86.06%
📊 24H High: 0.003400
📉 24H Low: 0.001447
💵 24H Volume (USDT): 5.06M
⚠️ Market Structure (4H Timeframe):
QI has printed a massive parabolic God-candle, surging directly out of a long consolidation range 🧨
🔻 Massive spike reached a local high of 0.003400 before experiencing upper wick rejection
🔻 Long upper wick indicates immediate profit-taking from early buyers near peak levels
🔻 Price is currently attempting to build a higher support floor above 0.002500
📈 Moving Averages Alignment:
📌 MA(7): 0.001665
📌 MA(25): 0.001517
📌 MA(99): 0.001353
✅ Price is trading extremely far above all key moving averages (7, 25, 99)
✅ Major bullish expansion breaking out from flat base accumulation
⚠️ Significant gap between price and MA(7) signals hyper-extended market conditions
📊 Volume Insight:
🟢 Unprecedented volume surge supporting the vertical price expansion
💥 MA(5) trading volume exploding to 385M with 24H QI volume at 1.95B
⚠️ Massive interest and volatility — high risk of quick pull-backs
🧠 What This Means:
Extreme volatility expansion move 🚀
🔹 Short-term trend: Parabolic Bullish
🔹 Momentum: Extremely High
🔹 Market emotion: Extreme FOMO & High Volatility
🎯 Key Levels to Watch:
🟢 Support Zone: 0.002100 – 0.002500 (Consolidation Floor)
🔴 Resistance Zone: 0.003000 – 0.003400 (Local High Spike)
📌 Sustaining above 0.002500 is crucial for bulls to attempt a secondary push
📌 Failing 0.002100 could trigger a mean-reversion move down toward MA(7)
💡 Final Take:
🧨 QI is highly extended; buying at current levels after an 86% move carries high risk
🧘 Let the chart settle and form a clear consolidation base before taking entries
🛡️ Strict stop-loss management is mandatory in hyper-volatile conditions! 💎
#QI #BENQI #CryptoAnalysis #AltcoinRally #TradingSignals
DYM/USDT ANALYSIS
⚡ DYM PUSHES HIGHER: BREAKS RESISTANCE WITH +12% GAINS — WHAT IS NEXT? 📊🚀
DYM | DYM/USDT
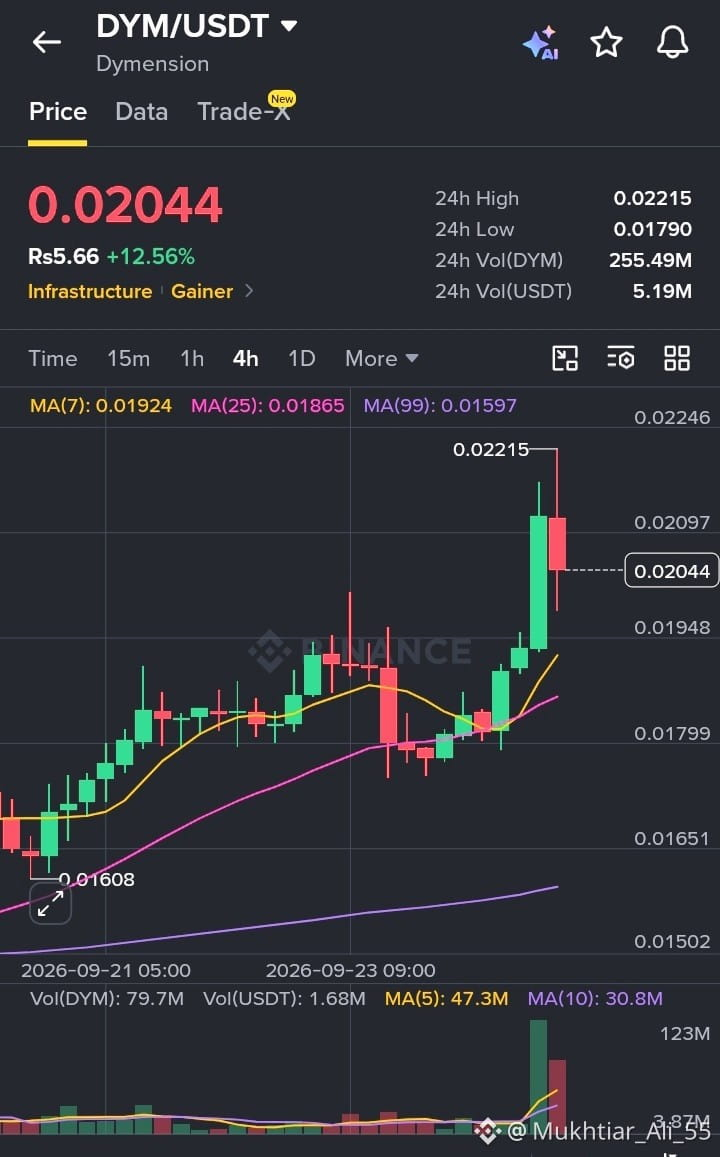
💰 Price: 0.02044
📈 24H Change: +12.56%
📊 24H High: 0.02215
📉 24H Low: 0.01790
💵 24H Volume (USDT): 5.19M
⚠️ Market Structure (4H Timeframe):
DYM has staged a solid breakout after building a steady higher-low structure 🧨
🔻 Price pushed through previous consolidation resistance to hit a high of 0.02215
🔻 Red pullback candle following the spike indicates minor resistance near 0.02200
🔻 Structure remains intact as long as buyers hold the newly established higher low
📈 Moving Averages Alignment:
📌 MA(7): 0.01924
📌 MA(25): 0.01865
📌 MA(99): 0.01597
✅ Price is holding above MA(7), MA(25), and MA(99)
✅ MA(7) continues to trend upward above MA(25), confirming bullish short-term trend
✅ Overall structure favors upside continuation on lower timeframe retests
📊 Volume Insight:
🟢 Strong green volume candle accompanying the breakout to 0.02215
💥 MA(5) volume holding at 47.3M
⚠️ Healthy expansion volume validating buyer demand
🧠 What This Means:
Steady trend continuation and range expansion 🚀
🔹 Short-term trend: Bullish
🔹 Momentum: Strong
🔹 Market emotion: Steady Buyer Accumulation 📈
🎯 Key Levels to Watch:
🟢 Support Zone: 0.01865 – 0.01924 (Confluence of MA25 & MA7)
🔴 Resistance Zone: 0.02215 – 0.02300 (Local High & Target Zone)
📌 A successful retest and bounce off 0.01950 keeps the bullish trend very healthy
📌 A 4H close below 0.01860 would signal temporary structural weakness
💡 Final Take:
🧨 DYM is showing structured bullish growth rather than an unsustainable pump
🧘 Focus on key support levels for safer risk-to-reward setups
🛡️ Maintain disciplined risk parameters and preserve capital! 💎
#Dymension #CryptoNews #TechnicalAnalysis #AltcoinRally