

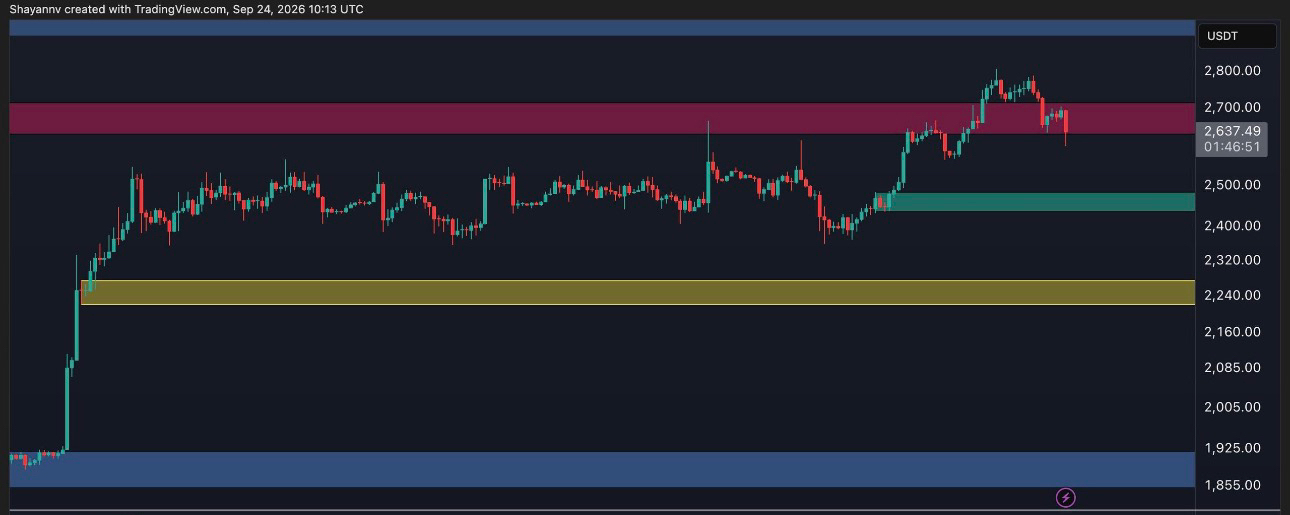

After a strong recovery from the June lows ($1.5K) and an impulsive breakout above $2.1K, the Ethereum price encountered stiff resistance. An attempt to establish a foothold above $2.8K resulted in a pullback, and $ETH is currently trading around $2.64K.
Despite the loss of short-term momentum, the medium-term structure remains constructive. Here is a breakdown of the levels worth watching right now.

🟢 Key Support Levels (Buyers)
1. $2.45K – $2.50K (First line of defense):
The zone of the current consolidation block and a key order block on the 4-hour timeframe. Holding this zone is essential to maintaining the established local bullish structure.
2. $2.25K:
The immediate safety level in the event of a break below $2.45K.
3. $2.10K (Major macro level):
The zone where the 100-day and 200-day moving averages (MAs) intersect, preparing to form a "Golden Cross." Losing this level would risk a return to a prolonged downtrend.
🔴 Key Resistance Levels (Sellers)
1. $2.60K – $2.70K (Current battleground):
ETH is currently trading within this range. A decisive daily close above $2.70K would pave the way for a retest of $2.8K. 2. $2.80K:
Local peak resistance that triggered the current RSI drop below the 50 mark.
3. $3.00K:
Psychological and technical target in the event of a decisive breakout above local resistance.
📊 On-chain fundamentals: Exchange supply is falling
The Exchange Supply Ratio continues to decline, reaching ~0.123 (down from ~0.18 in early 2025).
Less ETH on exchanges implies reduced immediate selling pressure.
Conclusion: Supply scarcity sets the stage for growth, but the market still requires a steady influx of spot demand for upward momentum.
⚠️ Summary:
As long as the price holds above $2.45K–$2.50K, the pullback from $2.8K appears to be a local correction of overbought conditions (RSI) rather than a trend reversal. A breakout above $2.7K would resume the move toward the $3K mark.