


Ethena's ENA has spent the back half of September doing exactly what strong uptrends do before their next leg: cooling off without breaking down. After a sharp impulsive run off the mid-September lows, ENA/USDT is now consolidating just beneath its recent high, and the structure on the 1H chart suggests the pullback may be closer to done than not.
Reading the Structure
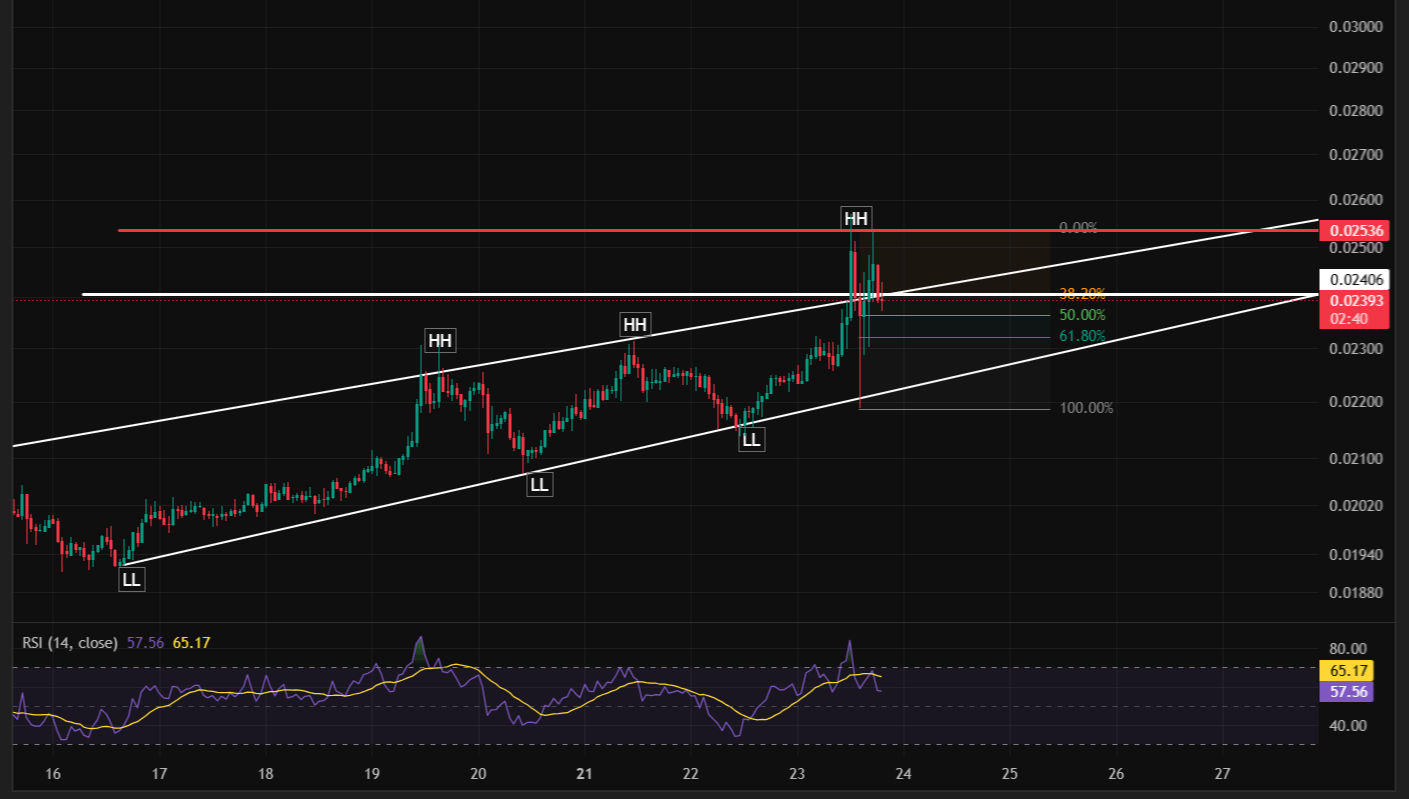
The 1H ENA/USDT perpetual chart (Binance) shows a textbook higher-low → lower-high → higher-high sequence stretching from the September 15–16 base near 0.145 up through 0.190 and into the 0.2259 swing high. That's a clean uptrend by any technical definition — each pullback has been shallower than the rally that preceded it, and buyers have consistently stepped back in ahead of the prior swing low.
Since tagging 0.2259, price has rolled into a sideways-to-lower drift, currently trading around 0.206, down roughly 1.3% on the session. Rather than a trend reversal, this reads as a retracement into a well-defined support shelf: the rising trendline drawn off the 0.145 higher low intersects almost perfectly with the 38.2% Fibonacci retracement of the last leg up, at 0.19256. Price has been hovering directly above that confluence zone for the past two sessions without a decisive break.
Below that, the 50% and 61.8% retracement levels stack up as the next layers of support, with the 100% retracement — and the base of the entire move — sitting at 0.14014. That's the level that would need to give way before the broader bullish structure is actually in question.
What Momentum Is Saying
RSI (14) is sitting at 43, with its moving average at roughly 47 — cooling from the overbought conditions seen during the initial breakout, but still holding above the 40 zone that has capped downside RSI readings throughout this entire advance. This is consolidation behavior, not distribution. A sustained RSI break below 40 alongside a trendline breakdown would be the first real warning sign that the structure is weakening; neither has happened yet.
The Setup
With price coiling directly on trendline and fib support, the higher-probability read here favors a long continuation play rather than chasing a breakdown that hasn't confirmed.
Bias: Long
Entry zone: 0.196 – 0.204 — this covers the current consolidation range and the 38.2% fib / ascending trendline confluence. A tap into the lower half of this zone (closer to 0.196–0.199) offers a tighter risk profile than chasing current price.
Stop loss: 0.183, placed below the 50% retracement and the last higher-low shelf. A close beneath this level would break the ascending trendline structure and invalidate the bullish continuation thesis.
Target 1: 0.2259 — the prior swing high and immediate resistance overhead. Expect some chop here as late longs from the last rally look to exit.
Target 2: 0.245 — the next logical extension if 0.2259 breaks with volume, aligning with where the trend's measured-move projection points on a clean breakout.
Target 3: 0.31+ — the stretch target if ENA clears both prior levels and the broader ascending channel reasserts itself. This is a multi-day target, not a scalp, and should be treated as a trailing-stop objective rather than a fixed exit.
Risk Management Note
This trade only works while price respects the trendline. A daily close below 0.183–0.185 shifts the bias from "buy the dip" to "wait for the retest of 0.14," since that would put the higher-low structure itself in doubt. Traders sizing this setup should treat the stop as non-negotiable — the entire thesis rests on the confluence holding, and if it doesn't, the next real support isn't close.
This is not financial advice. Crypto markets are highly volatile; always do your own research and manage risk according to your own trading plan before entering any position.
@Binance Square Official #AIStocksWhatNext #BitcoinRejectedAt$87,300Twice #BCHJumps28%OnCMEFuturesListing #Binance #ChartSniper