

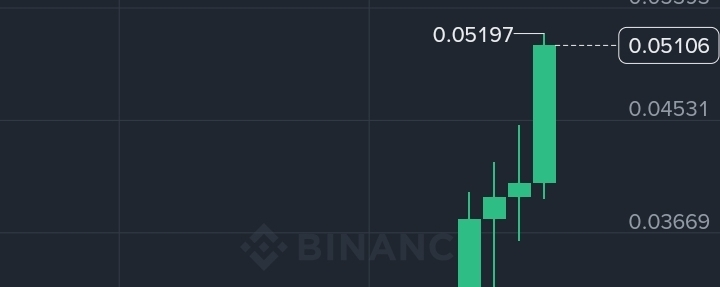

This chart actually shows a strong uptrend (bullish momentum), not a downtrend.
Current Momentum: Price is up +34.94% today (at $0.05106) with large green bullish daily candles pushing toward the 24h high of $0.05197.
Price Structure: The chart shows consecutive higher highs and higher lows climbing from the $0.01278 bottom—the classic definition of an uptrend rather than a downtrend.
Longer Timeframes: Over 7 days (+115%), 30 days (+243%), and 90 days (+295%), performance remains strongly positive
(The only negative metric shown is the 1-year change of -76.56%, which reflects long-term historical performance rather than the active daily trend shown on the chart).