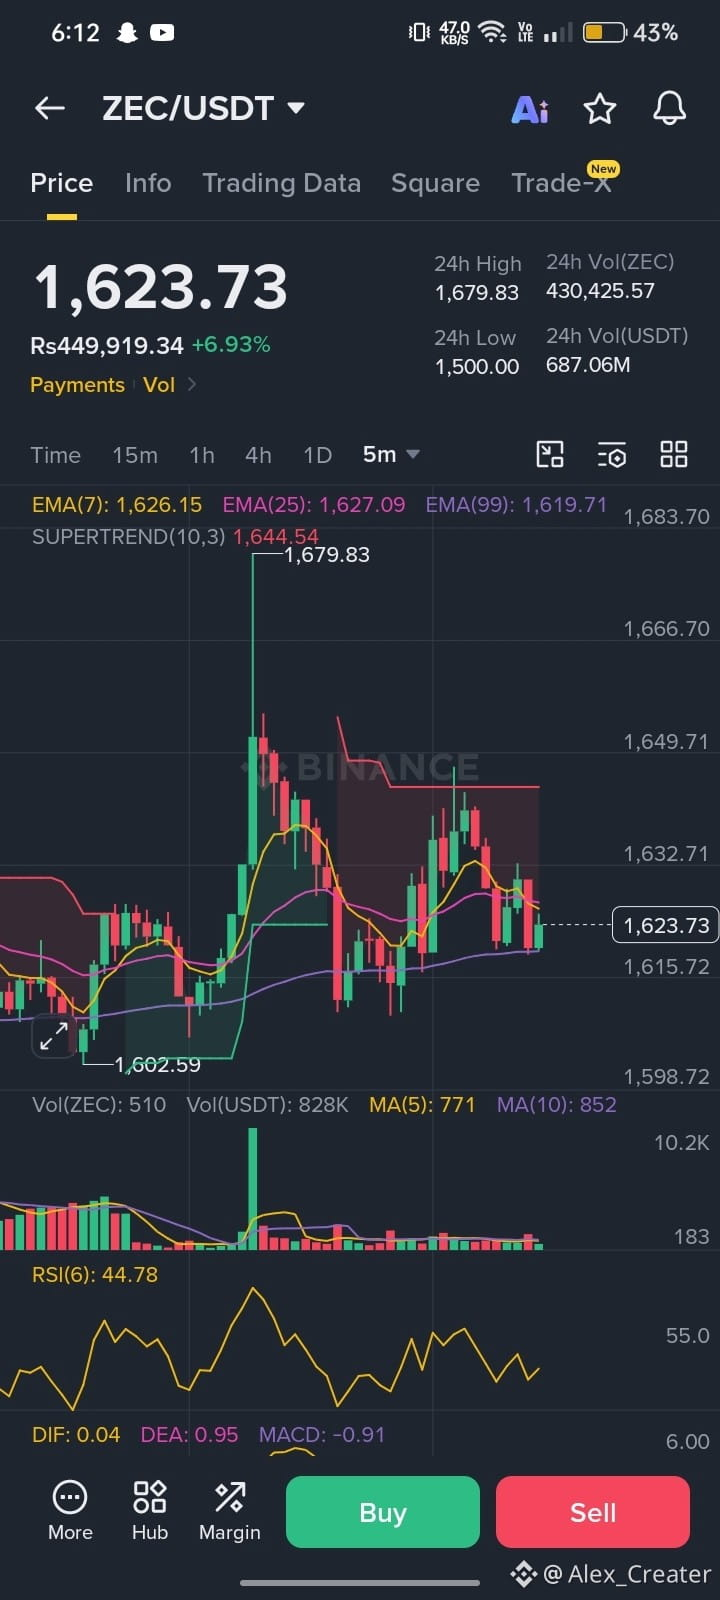
$ZEC /USDT — 5M Chart Analysis 📊
Price: 1,623.73
Short-term trend: Sideways with bearish pressure.
🔴 Resistance: 1,632–1,644
🟢 Support: 1,615 → 1,603
🚀 Break above 1,644 could signal renewed bullish momentum toward 1,667–1,680.
⚠️ Break below 1,615 may expose 1,603.
RSI: 44.8 — neutral-to-bearish momentum.
Supertrend: Bearish while price remains below ~1,644.
📌 Post:
⚡ ZEC/USDT 5M UPDATE
ZEC is consolidating around 1,624 after a strong move. Price is below the short-term EMA cluster and Supertrend resistance at 1,644. A breakout above 1,644 with strong volume could strengthen the upside, while losing 1,615 may trigger another move toward 1,603.
Key levels: 1,615 | 1,644
#ZEC #ZECUSDT #Crypto #Trading #Binance #TrendingTopic #BinanceSquareTalks #BTC
$ZEC $BTC
Price: 1,623.73
Short-term trend: Sideways with bearish pressure.
🔴 Resistance: 1,632–1,644
🟢 Support: 1,615 → 1,603
🚀 Break above 1,644 could signal renewed bullish momentum toward 1,667–1,680.
⚠️ Break below 1,615 may expose 1,603.
RSI: 44.8 — neutral-to-bearish momentum.
Supertrend: Bearish while price remains below ~1,644.
📌 Post:
⚡ ZEC/USDT 5M UPDATE
ZEC is consolidating around 1,624 after a strong move. Price is below the short-term EMA cluster and Supertrend resistance at 1,644. A breakout above 1,644 with strong volume could strengthen the upside, while losing 1,615 may trigger another move toward 1,603.
Key levels: 1,615 | 1,644
#ZEC #ZECUSDT #Crypto #Trading #Binance #TrendingTopic #BinanceSquareTalks #BTC
$ZEC $BTC