$INOD.US
Innodata (INOD) — Momentum Recovery Watch
◆━━━━━━━━━━━━━━━━━━━━━━━━━━━━━━━━◆
✔︎ Market Overview
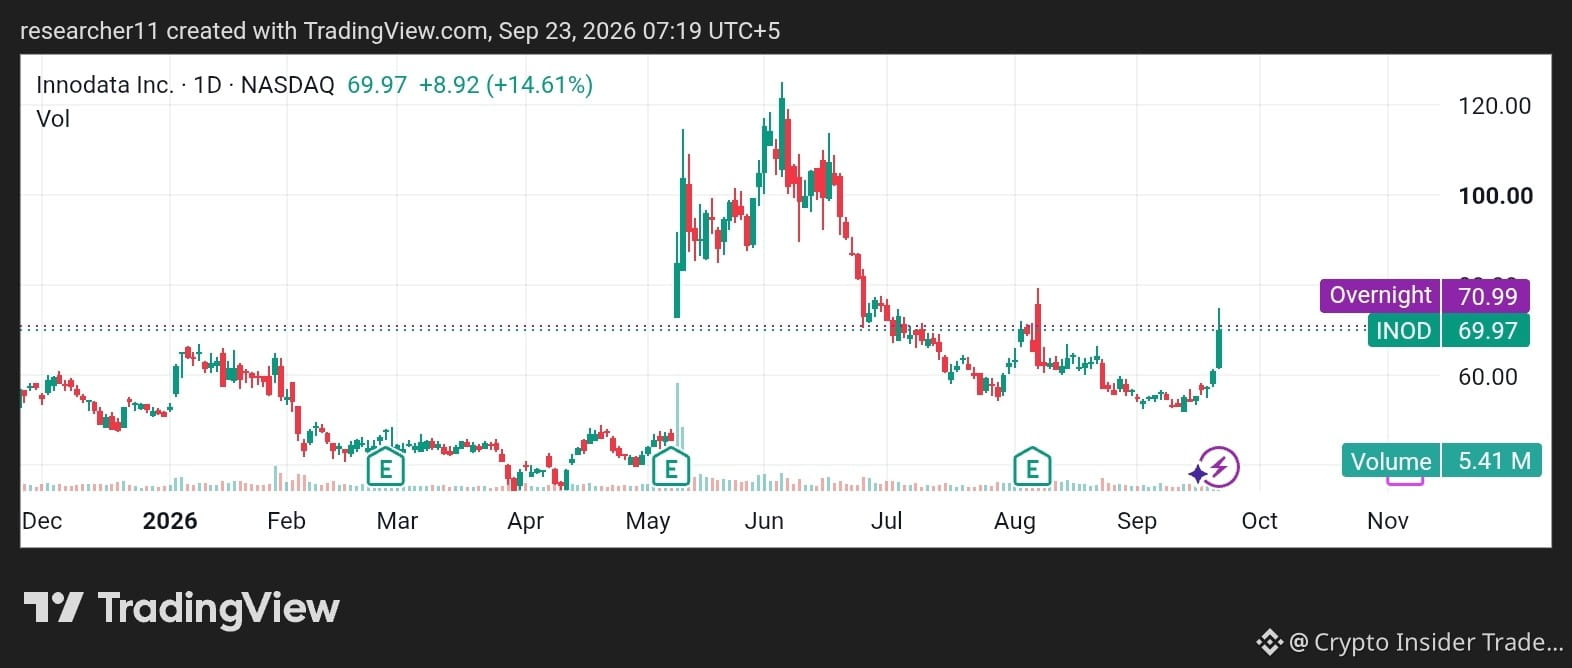
INOD jumped +14.61% to $69.97, rebounding from a prolonged correction that dragged shares from June highs near $120 down toward $60. Buyers appear to be defending a key support base, bringing renewed momentum into the stock.
◆━━━━━━━━━━━━━━━━━━━━━━━━━━━━━━━━◆
➤ Technical Analysis
✔︎ Trend: Long-term downtrend, short-term recovery developing
✔︎ Structure: Strong reversal candle above consolidation support
✔︎ Volume: 5.41M shares, showing improving participation
Key Technical Zones
➜ Resistance: $73.00 (August swing area)
➜ Major Resistance: $85.00 (prior breakdown zone)
➜ Support: $63.00 (recent base)
➜ Major Support: $58.00 (September low)
◆━━━━━━━━━━━━━━━━━━━━━━━━━━━━━━━━◆
➤ Scenario Analysis
🟢 Bullish: A breakout above $73 could accelerate momentum toward $85.
🔴 Bearish: Failure to hold $63 may trigger another test of $58 support.
⚪ Neutral: Sideways trading between $63–73 while buyers and sellers seek direction.
◆━━━━━━━━━━━━━━━━━━━━━━━━━━━━━━━━◆
➤ Key Levels
✔︎ Resistance: R1 $73.00 | R2 $85.00
✔︎ Support: S1 $63.00 | S2 $58.00
◆━━━━━━━━━━━━━━━━━━━━━━━━━━━━━━━━◆
➤ Conclusion
The recovery is gaining attention, but confirmation above resistance remains essential before a broader trend shift can be established.
Educational content only. Not financial advice.
#INOD #AIStocksWhatNext #TokenizedStockPlatformsCouldLaunchNextQuarter
Innodata (INOD) — Momentum Recovery Watch
◆━━━━━━━━━━━━━━━━━━━━━━━━━━━━━━━━◆
✔︎ Market Overview
INOD jumped +14.61% to $69.97, rebounding from a prolonged correction that dragged shares from June highs near $120 down toward $60. Buyers appear to be defending a key support base, bringing renewed momentum into the stock.
◆━━━━━━━━━━━━━━━━━━━━━━━━━━━━━━━━◆
➤ Technical Analysis
✔︎ Trend: Long-term downtrend, short-term recovery developing
✔︎ Structure: Strong reversal candle above consolidation support
✔︎ Volume: 5.41M shares, showing improving participation
Key Technical Zones
➜ Resistance: $73.00 (August swing area)
➜ Major Resistance: $85.00 (prior breakdown zone)
➜ Support: $63.00 (recent base)
➜ Major Support: $58.00 (September low)
◆━━━━━━━━━━━━━━━━━━━━━━━━━━━━━━━━◆
➤ Scenario Analysis
🟢 Bullish: A breakout above $73 could accelerate momentum toward $85.
🔴 Bearish: Failure to hold $63 may trigger another test of $58 support.
⚪ Neutral: Sideways trading between $63–73 while buyers and sellers seek direction.
◆━━━━━━━━━━━━━━━━━━━━━━━━━━━━━━━━◆
➤ Key Levels
✔︎ Resistance: R1 $73.00 | R2 $85.00
✔︎ Support: S1 $63.00 | S2 $58.00
◆━━━━━━━━━━━━━━━━━━━━━━━━━━━━━━━━◆
➤ Conclusion
The recovery is gaining attention, but confirmation above resistance remains essential before a broader trend shift can be established.
Educational content only. Not financial advice.
#INOD #AIStocksWhatNext #TokenizedStockPlatformsCouldLaunchNextQuarter